Home
> Musings: Main
> Archive
> Archive for January-April 2011 (this page)
| Introduction
| e-mail announcements
| Contact
Musings: January - April 2011 (archive)
Musings is an informal newsletter mainly highlighting recent science. It is intended as both fun and instructive. Items are posted a few times each week. See the Introduction, listed below, for more information.
If you got here from a search engine...
Use the search function of your browser to find the topic you want on this page. It is an exact-text-match search, so it is best to use a small distinctive term or phrase. You may get an idea from the output on your search page.
Introduction (separate page).
This page:
2011 (January-April)
April 30
April 27
April 20
April 13
April 6
March 30
March 23
March 16
March 9
March 2
February 23
February 16
February 9
February 2
January 26
January 19
January 12
January 5
Also see the complete listing of Musings pages, immediately below.
All pages:
Most recent posts
2026
2025
2024
2023:
January-April
May-December
2022:
January-April
May-August
September-December
2021:
January-April
May-August
September-December
2020:
January-April
May-August
September-December
2019:
January-April
May-August
September-December
2018:
January-April
May-August
September-December
2017:
January-April
May-August
September-December
2016:
January-April
May-August
September-December
2015:
January-April
May-August
September-December
2014:
January-April
May-August
September-December
2013:
January-April
May-August
September-December
2012:
January-April
May-August
September-December
2011:
January-April: this page, see detail above
May-August
September-December
2010:
January-June
July-December
2009
2008
Links to external sites will open in a new window.
Archive items may be edited, to condense them a bit or to update links. Some links may require a subscription for full access, but I try to provide at least one useful open source for most items.
Please let me know of any broken links you find -- on my Musings pages or any of my regular web pages. Personal reports are often the first way I find out about such a problem.
April 30, 2011
Bears hibernate -- but stay warm
April 30, 2011
We may have a mental image about hibernation: an animal largely turns off its biology for the winter. However, the story is based on studying only a few types of animals, mainly rather small ones. After all, imagine what it would take to study a hibernating bear. Now, a group of scientists at the University of Alaska - Fairbanks (200 miles south of the Arctic Circle) has done just that -- and come up with some surprises.
Their technical advances were rather straightforward... They used bears that had been captured locally as nuisance animals. They fitted the animals with some instruments, including radio transmitters. They provided the bears with an outside den, highly instrumented, for the winter -- and "watched".
|
|
|
The figure at the right is reduced from Figure 1 of the paper. Apparently, lighting is poor in the hibernation den.
|
|
Here is an example of their data for three bears. This is from Figure 3B of the paper.
The upper graph shows the oxygen consumption by the three bears over about a five month period. The oxygen consumption is a measure of the level of metabolic activity. The lower graph shows the body temperature of the bears.
The vertical dashed line shows the (approximate) time of emergence of the bears. Thus the data shown to the right are for normal, active bears.
The O2 curves show that the metabolism slows during hibernation, to about 1/3 the normal rate.
The temperature curves show that the bears cool -- but only by a few degrees.
(Outside temperature? It is shown in other graphs. It varies, of course. As a generality, the outside temperature was often -20°C -- or colder, and it was 10-20 degrees warmer in the den.)
|
Superficially, the hibernation of bears and of small mammals may seem similar. But with small mammals -- easily studied in the lab -- much data has accumulated, and it is known that the body temperature falls to near freezing. The current study tells us that bear hibernation is a rather different phenomenon.
News story: Watching bears sleep -- A "heroic" five-month study reveals the secrets of black bear hibernation. (The Scientist, February 17, 2011.)
* News story accompanying the article: Physiology: Life on Low Flame in Hibernation. (G Heldmaier, Science 331:866, February 18 2011.)
* The article: Hibernation in Black Bears: Independence of Metabolic Suppression from Body Temperature. (Ø Tøien et al, Science 331:906, February 18 2011.)
More on hibernating bears... Why bears don't get blood clots during hibernation (May 9, 2023).
More on hibernation... Underground hibernation in primates? (October 6, 2013).
More on bears...
* Bears (May 25, 2010).
* Loss of ability to taste "sweet" in carnivores (April 6, 2012).
Justice should be blind -- and well fed
April 29, 2011
The legal system is supposed to act on the relevant facts of a case, free of bias (e.g., about race) or any extraneous factors. That is the ideal we strive for; it is sometimes summarized in the phrase "justice is blind". Of course, we all know that human systems do not live up to the ideals. Sometimes, bias is evident. Sometimes, we are just mystified. Someone even quipped, "Justice is what the judge had for breakfast."
A new paper, in the prestigious scientific journal PNAS (Proceedings of the National Academy of Sciences, US), examines how the decisions of judges on similar cases vary during the working day. Their results, while not literally supporting the "breakfast" quip, certainly remind us of it, and require further attention.
One activity of a judge is to examine petitions from defendants, for matters such as parole. These are short acts; the judge spends about 6 minutes on average on each case, and handles many such cases in a single session. Thus one can analyze the nature of the decision vs time (or position) within a single court session.
|
The graph shows the key results. This is Figure 1 of the paper.
The ordinate (y-axis) is the fraction of decisions that are favorable to the defendant. The abscissa (x-axis) is, loosely, time during the day. More precisely, it is the position of the case in the sequence of cases -- what they call the ordinal position. The dotted lines indicate breaks -- meal breaks. The circled points are for the first case of each session during the day.
The major trend is clear: The first case in each session (the three circled points) has about a 65% chance of being decided favorably for the defendant. As each session continues, that probability trends lower -- eventually reaching zero.
|
Much of the paper is about explaining details of the court system, looking for possible variables that might be affecting the results. They do not find anything. They are left with the conclusion that the position of the case in the session affects the outcome -- that meal breaks affect the outcome. They do not know why. For example, it might be the meal itself that affects the decisions. However, it might also be the break from the stress of decision-making. There is nothing in the analysis at this point to clearly distinguish those possible explanations. The key point here is to show that there is an effect -- a big effect.
The paper analyzes courts in Israel. From the description of the courts and the cases, I would say the system is similar to US courts (though with different scheduling). Since the paper focuses on human issues, such as food and mental freshness, the general results are likely to hold anywhere.
News story: A Judge's Willingness to Grant Parole Can Be Influenced by Breaks. (Science Daily, April 14, 2011.)
The article: Extraneous factors in judicial decisions. (S Danziger et al, PNAS 108:6889, April 26, 2011.)
More about justice: Police training (July 19, 2020).
April 27, 2011
A photosynthetic salamander? Follow-up
April 27, 2011
Original post: A photosynthetic salamander? (August 24, 2010). This item described the invasion of salamander eggs by green algae, resulting in salamanders that apparently carried out photosynthesis. Although the intimate association of photosynthetic cells with animals has been seen before, this is the first documented case in vertebrates. The original post was based on a meeting presentation and accompanying news story. The paper describing the work has now been published; I have added it to the original post, and list it here. For more info and news stories, see the original post.
The article: Intracellular invasion of green algae in a salamander host. (R Kerney et al, PNAS 108:6497, April 19, 2011.)
Connecting the senses
April 26, 2011
Imagine the following test...
Step 1. You are presented with an oddly shaped object.
Step 2. You are then presented with two objects, and asked to identify which is the one from step 1.
|
|
|
The figure at right shows some examples of pairs of objects used for the tests. This is Figure 1a from the paper.
|
Seems simple enough, and it does not matter whether step 1 is done by feel or sight, and whether step 2 is done by feel or sight -- or even whether the two steps are done with the same sense. After all, your brain integrates the information into "the object" -- regardless of which sense you use; you have no problem combining information obtained with the different senses.
Now imagine a 12 year old boy, blind from birth. He has surgery to restore sight, and is given this test shortly after the surgery. He can't do it. He can do it if both steps are done with the sane sense. That he can do it if both steps are by sight shows that his vision is ok. However, he cannot do step 1 by feel and then step 2 by sight. (They did not test the opposite combination.)
What I described there has been done, in a study by Project Prakash, which provides sight-restoring surgery to children in India, and is also able to carry out some testing. The paper reports results for five children, ages 8 to 17. What I wrote above summarizes the first key finding; medical and test details are in the paper.
First key finding? What is the second? For three of the children, they were able to repeat the testing. Each child showed major improvement in the touch-sight part of the test -- in one case being re-tested only five days after the initial test.
These results show that the role of the brain in processing sensory information is complex. The integration is not "automatic", but it occurs rapidly enough that it cannot be due to growth of new brain cells. The full story remains to be told.
News stories...
* MIT Study Of Blind Children In India Reveals Insights Into Brain Development. (Asian Scientist, April 14, 2011.)
* Shedding light on a longstanding puzzle -- Study of blind children in India helps answer a 300-year-old philosophical question. (MIT, April 11, 2011.) From one of the institutions involved. (At least one of the authors is an MIT professor who is also involved with Project Prakash.)
The article: The newly sighted fail to match seen with felt. (R Held et al, Nature Neuroscience 14:551, May 2011.) It's a short and readable article; give it a try.
More on the interrelationships of the senses:
* Can you see your hand in total darkness? (April 14, 2014).
* What does blue light smell like? (July 18, 2010).
More on restoring sight:
* A camera-based device to restore vision (February 25, 2013).
* Restoring sight by use of stem cells to regenerate a new cornea (July 13, 2010).
What makes us human? A new approach
April 25, 2011
The genomics era is opening up new approaches to understanding what makes us distinctively human. What are the important genetic differences between, say, chimpanzees and humans? A new paper shows one approach to exploring this question, and is of interest as much for its approach as for any specific results (which are rather preliminary). The work involves a constructive collaboration between those expert in dealing with computer data and a range of biologists.
The new work starts with a computer analysis of the chimp and human genomes. They look for genetic regions that occur in chimp but not in human. Perhaps these regions were in our common ancestor, but were deleted in the human lineage. The regions of interest are not only in chimp, but in other animals they check; this makes it even more likely that there has been a deletion in the human lineage. To narrow down the list, they look for deletions that are in genome regions that seem important: regions that are otherwise highly conserved, and near genes. This computer analysis leads to a list of about 500 candidate deletions, which they then suggest are prime candidates for further study by the biologists. Simply making this list already leads to an interesting observation: almost all of the candidates are outside genes. That is, these deletions are more likely to affect gene regulation than protein structure. Time will tell what the significance is of this point, but it has long been felt that much evolution occurs as a result in changes in gene regulation. The basic gene set of all the primates is very similar, but small changes in how they are regulated can result in substantial changes in the result.
The paper then goes on to study two of these deletions in more detail. Both appear to be in regulatory regions, and lead to changes that may be characterized as part of humanness. One of these is about sexual development, and one is about brain development. This part of the work is fairly preliminary. What is most important in the paper is their approach to developing a list of candidate genetic regions that should be studied to find out more about what makes us human. The first two they start to examine closely appear to be valid hits.
It's important to note that the computer analysis of genome data is not used to prove anything in particular. What it does is to generate a list of candidates to be examined more closely. Each candidate suggested by the genome analysis is examined to see what its biological effect is, and that result is then interpreted in terms of the human lineage. There are thousands of differences between human and chimp. Most are probably of little or no importance; the genome analysis is a little trick to focus attention on mutations more likely to be important.
News story: Missing DNA Helps Make Us Human. (Science Daily, March 9, 2011.)
The article: Human-specific loss of regulatory DNA and the evolution of human-specific traits. (C Y McLean et al, Nature 471:216, March 10, 2011.)
For more on chimpanzees...
* Speech: Are chimps good listeners? (July 25, 2011).
* Do young chimpanzees play with dolls? (January 28, 2011).
Music-making technology -- for the physically disabled
April 23, 2011
This item is along the lines of some others we have noted: robotic devices, controlled by the mind. But the specific application here is particularly interesting: the purpose of the device is to allow those with extreme physical disability to make music. There is considerable literature attesting to the therapeutic value of music. For some people, "music" includes making their own, not just listening.
With that perspective, what they do is "straightforward"; it is also rather preliminary at this point. The idea is to allow a person to control a musical device using their mind. The test subject is a person with "locked-in syndrome", capable of little physical movement except for the eyes. The subject learns to make music, using eye motions to control the computer. (Actually, the control is done by measuring the brain waves associated with the eye movements.) It's very limited music at this point, but a start to an interesting project. The test subject has expressed pleasure at what she has done so far.
News stories:
* Music is all in the mind. (Nature News, March 18, 2011.)
* Thoughts Make Music For Patient With Locked-in Syndrome. (Medical News Today, March 22, 2011.)
The article: Brain-Computer Music Interfacing (BCMI): From Basic Research to the Real World of Special Needs. (E R Miranda et al, Music and Medicine 3:134, July 2011.) The article is largely a general overview, and is not very technical.
Among posts on mind-controlled devices:
* Brain-computer interface: Paralyzed patients control robotic arm by their thoughts (June 16, 2012). A major development.
* FDA to fast-track prosthetic arm -- Follow-up: videos (April 2, 2011).
* Reading the brain waves from speech (October 17, 2010)
More about brains is on my page Biotechnology in the News (BITN) -- Other topics under Brain (autism, schizophrenia). It includes a list of brain-related Musings posts.
There is more about music on my page Internet resources: Miscellaneous in the section Art & Music.
Fossil discovered: A big stupid rabbit
April 22, 2011
Spanish scientists have reported a new rabbit, based on fossils found on an island in the Mediterranean near Spain.
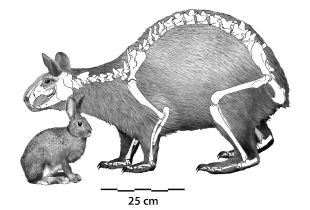
|
The newly discovered rabbit, as reconstructed from key bones. Estimated weight: 12 kg (26 lb).
A modern rabbit is shown for comparison. Weight: 1 kg (2 lb).
This is Figure 3 from the paper.
|
Their major point of interest about this rabbit is its size. They claim it is the largest known rabbit. Perhaps, but some caution... In figures, such as the one above, they compare it to a particular type of European rabbit. It is not clear why they make that particular choice; much larger rabbits are known. A list of rabbit types -- about 50 of them -- at Wikipedia [Wikipedia: List of rabbit breeds], shows rabbits at least 2/3 the weight they suggest for their finding. That would still make their new rabbit the largest, but not by much.
I suggested another property of the rabbit in the title for this post. That may be a bit of artistic license by my headline writer (me), but the paper notes that the rabbit had a small braincase, and clearly reduced sensory capabilities: small eyes and ears. (These comparisons are relative to body size.) The paper discusses these features in view of the adaptation to island living.
These rabbits may be an example of the "island rule" -- a pattern that on small islands (or other isolated habitats), small organisms tend to evolve to larger forms. It's also found that large animals tend to evolve to smaller forms. An interesting question is whether the fossils of small humans found in Indonesia are examples of this island rule for humans; see the post: The little people of Indonesia (May 14, 2009).
News story... Nuralagus rex: Giant extinct rabbit that didn't hop. (Phys.org, March 21, 2011.) The story originally listed here is no longer available; this is a replacement.
The article: Nuralagus rex, gen. et sp. nov., an endemic insular giant rabbit from the Neogene of Minorca (Balearic Islands, Spain). (J Quintana et al, Journal of Vertebrate Paleontology 31:231, March 2011.) The paper serves as an example of how a claim of a new organism is made. (The "gen. et sp. nov" in the proposed name indicates that both the genus and species here are new.) Some of it is required formalism (with much jargon!), but it also includes what they know, including some pictures, and comparison with related organisms.
Please do not check out the following two articles:
* Wikipedia: Capybara;
* Wikipedia: Josephoartigasia monesi.
If you read these, it will undermine our effort here to note a puny 12 kg rabbit as interesting. Of course, it is the rabbit of this news story that led us to look further to see what the biggest known modern and fossil rodents are. You can do your own looking, too, but unless the fossil rodent you come up with is more than a tonne, you'd better have a pretty good story as to why we should be interested.
However, the current story offers a caution that reminds us that some of these reports may not reach correct conclusions. A part of the new story is that the match between head and body is different from what one would normally assume for this group of animals. It's common that fossils yield bones for only part of the animal. The scientists then fill in their best estimate of what the rest looked like, based on their general understanding of the type of animal. It is inherent in this approach that special cases get missed -- until further fossil evidence shows up.
Musings has previously noted what appeared to be a rather large rodent: post on a large rodent? (September 19, 2009).
Also see...
* Domestication of rabbits (August 16, 2021).
* What is in the rubella virus family? (November 15, 2020). Another capybara.
* A story of dirty toes: Why invading geckos are confined to a single building on Giraglia Island (November 12, 2016). Another animal story from the Mediterranean islands.
* Climate change and hare color (May 10, 2013).
Thanks to Borislav for sending this rabbit tale.
April 20, 2011
Using stem cells to study a heart condition
April 19, 2011
When we hear about stem cells, it is often in the context of using them to treat a disease or defect. Indeed, that is one of the long term dreams. However, stem cells can be useful as research tools in the lab. New work offers a good example.
The stem cells here are induced pluripotent stem cells (iPSC); these are stem cells based on taking cells from an individual, and causing them to "regress" back to a stem cell-like state. This ability to generate stem cells from an individual means that we can develop stem cells that carry certain specific disease genes. In the current work, they generate stem cells from patients with a certain type of genetic defect in heart rhythm, called long QT syndrome (LQTS). They then cause the stem cells to form various kinds of heart cells, and these can even be assembled into simple tissues. As a result, they are able to do lab studies of heart tissue carrying specific defects -- something not easily done by other means.
|
Here is an example of the results. They assemble such "artificial" heart tissue in the lab, using cells from a normal person and cells from a patient with LQTS. The figure shows an electrical measurement made on the two groups of cells. The difference is evident.
FPD = field-potential duration; it is related to the QT interval.
This is Figure 2e from article #1 listed below.
|
One useful aspect of this work is that they can study drugs. This includes drugs that might affect the condition, but it also means that they can test for side effects of other drugs. A common issue is finding that a drug affects heart rhythm; a lab system such as the kind developed here could be useful for screening for such side effects.
This is early work. Pretty much everything with stem cells is early stage work. The key idea here is using stem cells in the lab to study human physiology in ways that have not been practical before. This is a useful development -- much more modest than using stem cells therapeutically, but much closer to reality.
Two papers on this were published together; they represent similar work from independent labs. The term "Timothy syndrome" refers to a specific type of LQTS.
News stories:
* Stem cell help for Long QT. (The Naked Scientists, January 16, 2011.) A useful brief overview of paper #1. It includes a diagram of the heartbeat, showing what QT refers to.
* Skin Cells Used to Develop Possible Heart Defect Treatment in First-of-Its-Kind Study. (Science Daily, February 10, 2011.) A good presentation of paper #2. This is the most thorough of the news stories, but reading the shorter ones above may be good for starters.
The articles:
* 1. Modelling the long QT syndrome with induced pluripotent stem cells. (I Itzhaki et al, Nature 471:225, March 10, 2011.)
* 2. Using induced pluripotent stem cells to investigate cardiac phenotypes in Timothy syndrome. (M Yazawa et al, Nature 471:230, March 10, 2011.)
For more on stem cells:
* Using patient-specific stem cells to study Alzheimer's disease (February 24, 2012). This, too, involves the use of patient-specific iPSC.
* Cardiac stem cells as a treatment for heart damage: preliminary results are "very encouraging" (November 29, 2011).
* Children with two fathers (January 3, 2011).
There is more on stem cells on my page Biotechnology in the News (BITN) - Cloning and stem cells.
For more on heart beats: Lighting the heart (August 31, 2010).
For more on heart disease: DNA testing -- for rejection of a transplanted heart (May 24, 2011).
Why don't woodpeckers get headaches? Designing better shock absorbers
April 18, 2011
This work is fascinating at multiple levels. A simple study of how woodpeckers avoid brain damage from banging their head against the wall (or tree) would be a good piece of biology. They do that -- and then more. They take what they learned from the bird and use that understanding to build a better shock absorber; they then show that the device really works. Thus the study of the bird leads to a practical advance.
|
A woodpecker. Engineer's view.
Here is their figure legend:
"Figure 4. Simplified model of a woodpecker.
(a) Kinematic model of the woodpecker's drumming motion.
(b) Mass-damper-spring model of the head of a woodpecker which drums a tree."
|
The following table summarizes some of their results testing the bio-inspired shock absorber. It is based on Table 4 of the article. It lumps all the data for various types of samples, but includes only the data at the most extreme condition tested, 60,000 g.
|
Type of shock absorber
|
Failure rate (at 60,000 g)
|
|---|
|
Woodpecker-inspired:
|
0.25% (1 out of 404)
|
|
Control:
|
17% (67 out of 404)
|
This is an example of engineers studying how biology has solved a problem; understanding biological solutions offers the engineers new models. Emphasize that the new shock absorber they made is not made of woodpecker skull pieces. Rather, they analyzed the woodpecker, and figured out how it works (as suggested by the lower half of the figure, above). They then used the principles they learned from the woodpecker to make a new shock absorber.
News story: Woodpecker's head inspires shock absorbers. (New Scientist, February 4, 2011.)
The article: A mechanical analysis of woodpecker drumming and its application to shock-absorbing systems. (S-H Yoon & S Park, Bioinspiration & Biomimetics 6:016003, March 2011.) The paper is from UC Berkeley. I encourage you to read the abstract. Beyond that, the paper gets quite technical.
There is an emerging field of bio-mimetic, or, better, bio-inspired engineering. For more, see my Biotechnology in the News (BITN) topic Bio-inspiration (biomimetics).
A previous Musings post on bio-inspiration: Robots should learn to crawl first, then walk (February 27, 2011).
A previous post on animals drumming: Drumming affects caste development (March 21, 2011).
More birds: Of birds and butts (February 2, 2013).
More headaches: Would a placebo work even if you knew? (January 31, 2014).
Measuring radiation: The banana standard
April 17, 2011
There is a lot of radiation in the news, and you may be getting confused with all the different ways to measure it. It may be refreshing to find a unit of radiation that you can relate to: the banana. It may be whimsical, but it is also interesting and instructive.
It's well known that bananas are a good source of the mineral potassium. That is the basis of the point. Naturally occurring potassium is radioactive, as it contains about 0.01% of the radioactive isotope potassium-40 (K-40 or 40K). The K-40 isotope gives off quite strong emissions; it also has a very long half life (over a billion years), so will always be around. Since all biological materials contain potassium, they (we!) are all radioactive. In fact, exposure to other organisms -- including our friends -- is a significant source of background radiation.
With the common banana being a known K source, the idea of using the banana as a reference for measuring radiation has some appeal. We can all relate to being exposed to one banana per day.
For an introduction to the banana standard: Wikipedia: Banana equivalent dose. (The radioactive sample shown above is edited from a figure at Wikipedia: Banana.)
I don't want to attempt any comprehensive presentation of the units that are really used for radioactivity. However, a brief survey might be in order. A useful start is to realize that the various units for radioactivity may actually be measuring different things. For each type of measurement, there may be different units, including official SI units.
One thing to measure is the number of radioactive decay events -- simply count them. This is most simply and directly presented as disintegrations per minute, or dpm. Common units that count decay events are the becquerel (SI) and curie.
There are different kinds of radiation, so simply counting events is not a good measure of the risk from an exposure. Thus one way to measure radiation is to measure the energy adsorbed from the radiation. Units for this energy include the gray (SI) and rad.
The types of units discussed above measure different things, but they are objective. Unfortunately, the effects of radiation on organisms is complex. Biologists have attempted to account for this complexity with something called the effective dose. The effective dose is a measure of the biological importance of the radiation. Units for this include the sievert (SI) and rem.
On average, a person receives about 2 mSv (millisieverts) of radiation per year, from natural "background" sources. An X-ray may contribute a few mSv -- a significant but still small increase in risk. It is likely that no one outside the Three Mile Island facility received more than a mSv from the 1979 accident. (These numbers are from the page: Wikipedia: Sievert.)
Eating one "standard" banana per day is equivalent to about 36 microsieverts over a year. This should not be taken too literally; the Wikipedia article notes that there are some complexities about what the banana standard really means. In any case, it is fun, and a reminder of our common exposure to low doses of radioactivity.
Other posts on radiation include:
* How radioactive is your avocado (and some other common exposures)? (November 16, 2016).
* Effect of low dose radiation on humans: some real data, at long last (July 24, 2015). And accompanying post.
* Berkeley RadWatch: Radiation in the environment (February 24, 2014).
* An improved CT scanner, with a reduced radiation dose (February 5, 2013).
* Does radiation treatment of cancer cause new cancers? (April 8, 2011).
My page of Introductory Chemistry Internet resources includes a section on Nucleosynthesis; astrochemistry; nuclear energy; radioactivity. That section contains some resources on the effects of radiation.
Other posts on bananas include:
* Food security: the potential of enhanced cultivation of enset (February 22, 2022).
* The genome of Musa acuminata (August 8, 2012).
* Rats, bananas, and tuberculosis (March 11, 2011).
* What does blue light smell like? (July 18, 2010).
Post-traumatic stress disorder (PTSD): a clue to its biochemistry
April 15, 2011
Post-traumatic stress disorder (PTSD) is an extreme reaction to an event that is psychologically traumatic. It is commonly associated with war; some -- but not all -- who return from combat show symptoms of PTSD for an extended period. However, it can also result from civilian traumatic events, such as a major car crash or physical violence. New work shows a specific chemical feature that is associated with PTSD, at least in women. This is a breakthrough, the first real clue of the underlying biological nature of this disorder. We understand that brain function involves chemistry, and that people may have different behaviors because of real chemical differences in their make-up. However, finding the details can be difficult.
Let's start with the key finding. There is a hormone called PACAP (the full name is in the paper, but it doesn't matter here). They find that women with PTSD have higher blood levels of this hormone than those who do not show PTSD symptoms upon being similarly stressed. The following graph presents some key data behind that finding. (This is Figure 1b of the paper.)
|
The plan... They simply measure the blood level of the PACAP hormone in a number of individuals who have had the kind of stress that leads to PTSD.
There are four bars. They are for low and high levels of the hormone (dark and light bars, respectively), for males and females. (The number near the base of each bar is the number of individuals.) The height of the bar (y-axis) is a PTSD score. The most striking finding is for females, where those with high levels of the hormone have much higher PTSD scores than those with low levels. Males do not show that effect. Another way to look at this is to say that low levels of the hormone protect females -- but not males -- from PTSD.
|
Of course, simply finding a correlation (or association) between two things does not means they are causally related. However, it is a clue, and they did further work. They found mutations that supported the relationship, and they also made a connection to the female sex hormone, estrogen. Finally, rodent model systems support the role of PACAP in the fear response. Thus they have good evidence that this hormone -- and its receptor -- have a role in PTSD, though beyond that they know little at this point. The rodent models will let them do some studies for more information -- though anything learned from rodents must be checked to see if it holds in humans.
This is clearly an incomplete story. What's notable is that it is about as good a biochemical clue as anyone has about PTSD. Following it up could lead to prediction of risk for PTSD and possibly treatment.
News story: New Biological Pathway Identified for Post-Traumatic Stress Disorder. (Science Daily, February 24, 2011.)
* News story accompanying the article: Psychiatry: A molecular shield from trauma. (M B Stein, Nature 470:468, February 24, 2011.)
* The article: Post-traumatic stress disorder is associated with PACAP and the PAC1 receptor. (K J Ressler et al, Nature 470:492, February 24, 2011.)
Also see: A person without fear -- due to a brain lesion (January 18, 2011). This post was broadly about an anatomical basis for fear, and made note of some work on PTSD.
For more about M-F biochemical differences: Why male scientists may have trouble doing good science: the mice don't like how they smell (August 22, 2014).
April 13, 2011
Bouba and kiki: A puzzler
April 12, 2011
Look at the two objects at the right. One is a bouba and one is a kiki. Which is which?
Saying that you do not know is not helpful. Most people actually do know -- even if they have never heard the terms before. And they know regardless of their language.
So, fairly quickly, make your choice. Perhaps you have a conscious reason, or perhaps it just seems obvious. Make your choice, and then read on.
|

|
For basic background: Bouba/kiki effect. (Wikipedia.) The figure above is from this page. The page includes reference to the original 1929 work that got the topic started, as well as to more recent scientific papers. Note that the spelling of the terms varies from one use of them to another.
Why did this come up? Because the American Museum of Natural History (New York City) has a major exhibition Brain: The Inside Story, and one of their activities involves Bouba and Kiki -- now in human form. Kiki and Booba. (AMNH, November 30, 2010. Now archived.)
Also see: Bright lights and pupil contraction (March 2, 2012). It's not really related, but...
Effect of cell phone on your brain
April 11, 2011
This is a paper that is getting attention, and will stir up some controversy. Frankly, I am not sure what to make of it. I suspect it is best for now to note it, and realize that it will take a while to know what it means. Most importantly, others in the field will follow up. Can they reproduce the basic result here? That is, is the report here likely to be "correct" (rather than a statistical fluke, or due to some unusual experimental condition)? Then, people will try to extend it, to understand more about what is going on, and to look at what the consequences might be. It's important to realize that the study here does not show that anything bad is happening.
What did they do? They held two cell phones to the person's head, one at each ear. They turned one on; the other served as an "off" control. They then used a PET scan to measure glucose metabolism in the brain.
|
Here is an example of their results. (This is Figure 3D of the paper.)
The graph shows the glucose metabolism at particular regions of the brain, from the PET scan, on the y-axis. This is plotted vs the electromagnetic field, E/Eo, on the x-axis. (Eo is the maximum field, right at the phone; E/Eo is the fraction of the maximum field at a given distance from the phone.) Results are shown for 47 individuals tested.
They show a regression line through the data. The line shows a trend: higher glucose metabolism at higher electromagnetic field (EMF). They claim the line is statistically significant, but clearly there is much noise in the data; the effect, even if real, is small compared to the natural variability.
|
The effect is small, and there is no claim that it is "bad". Nevertheless, it is an effect, and, if real, we would like to know more about it. As noted at the start of this post, I think what may be most important is that they have opened up an issue for further work. Their basic experimental system seems sound, and can be extended. Stay tuned.
As an example of a limitation of the work so far... They use a pair of cell phones, one at each ear. But they only test the effect of turning the right one on. They should run similar tests turning the left one on. If the effect is due to the EMF, they will see highest glucose activity at the left side. However, if the effect is due to some inherent activity of regions of the brain, then they will see highest glucose on the right -- just the opposite of what is expected if there is a direct effect of the EMF.
News story: Cell Phone Use May Have Effect on Brain Activity, but Health Consequences Unknown. (Science Daily, February 23, 2011.)
* Editorial accompanying the article: Cell Phone Radiofrequency Radiation Exposure and Brain Glucose Metabolism. (H Lai & L Hardell, JAMA 305:828, February 23, 2011.)
* The article: Effects of Cell Phone Radiofrequency Signal Exposure on Brain Glucose Metabolism. (N D Volkow et al, JAMA 305:808, February 23, 2011.)
For another post on the possible effects of cell phones... Do cell phones prevent Alzheimer's disease? (January 13, 2010).
For more on cell phones -- as tools in medicine... Connecting a cell phone and a microscope (September 2, 2009). Another such application was briefly noted in the post What's around the corner? (January 7, 2011).
For more on cell phones -- as tools in traffic analysis... Traffic congestion patterns analyzed from cell phone records (July 7, 2013).
For more on cell phones -- how to power them: Windmills for your cell phone? (January 21, 2014).
For more on PET scans:
* Early detection of brain damage in football players? A breakthrough, or not? (September 14, 2015).
* Can we predict the proper treatment for depression? (June 24, 2013).
More about brains is on my page Biotechnology in the News (BITN) -- Other topics under Brain (autism, schizophrenia).
Capsaspora owczarzaki and you
or
Where did animals come from?
April 10, 2011
The modern era of DNA sequencing and genome analysis -- the last decade or so -- has brought huge amounts of new evidence on the relationships between organisms. Sometimes people look at the genome similarities and differences between closely related organisms, such as various primates. Sometimes they look at broad issues, such as the overall "tree of life". For example, how did the line of organisms we call animals develop? What were the key steps in making the transition from a unicellular organism to a simple animal? It turns out that the genomes of all animals, from the simplest sponge to vertebrates such as us, are remarkably similar. Many key molecules of human development are there in the simplest animals. And now the story goes back further, as information comes in for even simpler organisms, perhaps representative of those that gave rise to animals. The current news is about Capsaspora owczarzaki, an amoeba. It, too, has some of these same key molecules, as do other pre-animals that have been examined.
The emerging story is that the development of the various types of animals was largely due to subtle changes in how key regulatory molecules acted. The basic "toolkit" for being an animal -- sponge or human -- was developed long ago. This leaves much to be figured out, but it establishes a framework that is quite satisfying.
News story: From Single Cells, a Vast Kingdom Arose. (New York Times, March 14, 2011.) Highly recommended, as a general overview, whether you go on to the more technical article below or not.
The article: Unexpected repertoire of metazoan transcription factors in the unicellular holozoan Capsaspora owczarzaki. (A Sebé-Pedrós et al, Molecular Biology and Evolution 28:1241, March 2011.)
As I was finishing this item, I finally got around to the January issue of The Scientist. It includes a nice feature article closely related to this post. The broad theme is the development of multicellular organisms. For most of the era of life on earth, most life was unicellular. Then, multicellularity developed, as now seen in all the macroscopic organisms we routinely encounter. Multicellularity was clearly one of nature's great innovations. How did it occur? The story above addresses part of this; the article in The Scientist is a broader overview, and very readable. Highly recommended. From Simple to Complex. (J Akst, The Scientist, January 2011, p 38.) Lead-in: "The switch from single-celled organisms to ones made up of many cells has evolved independently more than two dozen times. What can this transition teach us about the origin of complex organisms such as animals and plants?"
A previous post on the use of genome sequences to determine relatedness of organisms: The Siberian finger: a new human species? -- A follow-up in the story of Denisovan man (January 14, 2011).
A post on the early history of skeletons: The earliest biomineralization? (January 24, 2012).
More about amoebae...
* Trogocytosis -- How an amoeba chews its food (May 16, 2014).
* The largest known virus (August 5, 2013).
Does radiation treatment of cancer cause new cancers?
April 8, 2011
One standard type of treatment for cancer is radiation. As with many other general approaches to treating cancer, it makes use of the fact that cancers contain actively growing cells, and many of the normal cells in the body are more quiescent. Radiation selectively kills actively growing cells, including the cancer. However... radiation can cause damage, too. In fact, radiation can cause cancer. The question, then, is inevitable: does the radiation treatment of cancer cause new cancer?
A new study, from the (US) National Cancer Institute, analyzes the available data, and concludes that yes, radiation treatment of cancer does cause new cancers -- but not very many. It's an impressive analysis of a huge database. They look at nearly 650,000 patients, accumulated over 30 years. They subdivide the patients by whether or not they received radiation treatment for the primary cancer, using the information in the database. Then they analyze the frequency of second cancers for those who did or did not receive radiation treatment for the primary cancer. Nearly 10% of the people developed a secondary cancer during the period of observation; that number was only slightly higher for those who had received radiation initially: more specifically, nearly 10% of the secondary cancers can be attributed to the original radiation treatment. Thus they conclude that radiation treatment does contribute to the development of later cancers, but is not a dominant factor. The benefit of (appropriate) radiation treatment for cancer outweighs the risk of causing new cancer. However, improved approaches to cancer treatment with lower side effects would always be welcomed.
There are a lot of details in the study. For example, they discuss many types of cancer, and the nature of radiation treatments varied over the time period. Nevertheless, the study is so large that the basic findings seem likely to be valid, though one should not make too much of a precise number. If you read over the paper, be careful to not get drowned in all the details, especially the first time through.
News story: Benefits of Radiation Therapy Outweigh Risks of a Second Cancer: Study -- Likelihood that radiotherapy will cause another tumor is low, researchers say. (US News and World Report, March 30, 2011.)
The article, via abstract at PubMed: Proportion of second cancers attributable to radiotherapy treatment in adults: a cohort study in the US SEER cancer registries. (A Berrington de Gonzalez et al, Lancet Oncology 12:353, April 2011.)
For some thoughts on general approaches to cancer treatment... Targeting cancers (January 15, 2011).
For more about radiation...
* Effect of low dose radiation on humans: some real data, at long last (July 24, 2015). And accompanying post.
* Berkeley RadWatch: Radiation in the environment (February 24, 2014).
* An improved CT scanner, with a reduced radiation dose (February 5, 2013).
* Measuring radiation: The banana standard (April 17, 2011).
My page of Introductory Chemistry Internet resources includes a section on Nucleosynthesis; astrochemistry; nuclear energy; radioactivity. That section contains some resources on the effects of radiation.
For an unusual cancer: The devil has cancer -- and it is contagious (June 6, 2011).
My page for Biotechnology in the News (BITN) -- Other topics includes a section on Cancer. It includes a list of related posts.
April 6, 2011
Weather report from Titan: Clouds? Puddles? Does that mean it rained?
April 6, 2011
Musings doesn't do many weather reports. However, if this one holds up, it is remarkable. Rain. A billion (109) kilometers from here. The first report of rain somewhere else than on Earth. Of course, we have an "eye-in-the-sky" watching: the Cassini spacecraft. Even then, it did not directly see the rain, but merely circumstantial evidence that makes it likely that the rain happened. The rain report is for Titan, the big moon of Saturn. The rain of course is methane, CH4.
Titan is cold. Any water that might be there is permanently solid (with only a trace in the vapor phase). However, the temperature does allow methane to cycle between gas and liquid phases -- much as water does here on Earth. Lakes of methane are now rather well characterized on Titan. The lakes change with time, and there are seasonal patterns. In fact, much of the paper involves interpreting the observed rain in terms of seasonal variation, just as we have Spring rains here.
Th heart of their observations is that they see clouds, and then see dark regions on the surface, which they interpret as being "puddles" of liquid methane. These puddles disappear, presumably by evaporation. Figures in the paper show what they see, but of course it is the interpretation that matters -- and that is hard for an untrained observer.
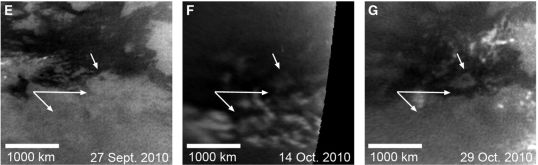
|
The figure above shows an example of what they see. The three frames are shot at about two week intervals. Look at the "double arrow". You can see that both arrowheads point to regions that get darker between the first two frames (E & F). For one of them, the darkening is reversed by the last frame (G); for the other, reversal of the darkening can be seen in the next frame (not shown here). They interpret the darkening as puddles, which appear and then evaporate.
This is part of Figure 2 of the paper, which shows more frames, and at higher resolution.
|
News story: Seasonal Methane Rain Discovered on Titan. (Wired, March 17, 2011.)
* News story accompanying the article: Planetary science: Precipitation Climatology on Titan. (T Tokano, Science 331:1393, March 18, 2011.)
* The article: Rapid and Extensive Surface Changes Near Titan's Equator: Evidence of April Showers. (E P Turtle et al, Science 331:1414, March 18, 2011.) See "Supporting Online Material" for more, including diagrams where they show their interpretation of the figures.
More about Titan...
* Weather forecast: Clouds will form near North Pole within two years (April 9, 2012).
* Quiz: NASA's boat (June 29, 2011).
More from Cassini... Enceladus and its plume (November 17, 2009).
More about rain...
* What would raindrops be like on other planets? (April 13, 2021).
* The aroma of rain (June 13, 2015).
* Lyell on fossil rain-prints (May 6, 2012) (and accompanying post).
* Previous post about turtles: Where is turtle #92587? (February 22, 2011).
* Previous post about an article written by a Turtle: none.
Electric cars and pollution
April 5, 2011
Electric cars are beginning to make their mark. The promise is that they have advantages. But what are these advantages? To some extent, it is not obvious. Traditional cars run on fossil fuels. Electric cars run on electricity -- which is most commonly made from fossil fuels. So what is the benefit? Clearly it is more subtle than simply using electricity.
The benefits are likely in two areas. One is that the use of fossil fuels, to make the electricity, is concentrated (in the power plants, rather than in individual cars). Pollution control, including capture of resulting CO2, is easier with a concentrated source. Secondly, if charging is done at times of low demand on the electrical system, such as at night, then it makes the electric generators more efficient. Of course, if electricity is generated from renewable resources, then we would have another benefit.
As you can see from those statements, the benefits of electric cars depend on the details. Now we have a paper analyzing the details. There are two aspects to this type of analysis. One is the assumptions used to make the model, and the other is the answers that come out. In fact, they run various cases -- and they get various results depending on the case. For example, they look at the specifics of two regions in the Eastern US, and show how local factors lead to different predictions for the benefits of the electric cars. The most important aspect of this paper is that it sets a framework for discussing the advantages of electric cars. I encourage you to look it over with that in mind. Don't get too caught up in the details of particular assumptions or particular conclusions, but try to see their approach.
One of the findings is that use of electric cars will increase SO2 pollution. Why? Because gasoline is low in sulfur, whereas the coal that would be used to generate the electricity is relatively high in sulfur. This is an example of the level of detail that needs to be considered to get the full picture.
News story: Study finds PHEVs will reduce net emissions of CO2 and NOx; upward pressure on SO2. (Green Car Congress, February 27, 2011.) Good overview. (NOx is used as a shorthand to encompass the various nitrogen oxides; this is common usage.)
The article: Net Air Emissions from Electric Vehicles: The Effect of Carbon Price and Charging Strategies. (S B Peterson et al, Environmental Science & Technology 45:1792, March 1, 2011.)
Prior posts on electric cars and other possible car technologies include:
* A new electric car (July 11, 2009).
* Hydrogen fuel cell cars (June 8, 2010).
More on pollution: Deaths from air pollution: a global view (October 23, 2015).
More about coal: Coal: a new source of rare earth elements? (April 6, 2016).
Addition/clarification May 4, 2011...
A reader expressed concern that the post could be misinterpreted. The article is not a complete analysis of electric cars vs traditional gasoline-powered cars. It focuses on one issue: the effects of fuel usage, electricity vs gasoline, on emissions. In fact, it compares the fuels for the same vehicle: the plug-in electric hybrid (PHEV). Other analyses might, for example, also consider manufacturing and maintenance issues of electric vs gasoline engines, but these are beyond the scope of this article.
The confusion comes, in part, from the term "electric cars" in their title -- and then in mine. It would have been better to refer to use of electricity as fuel than to electric cars per se. The paper is quite clear, but the title suggests something else..
The 6th mass extinction?
April 4, 2011
The paper discussed here has received a lot of attention. My initial reaction to hearing about the work was that the paper was likely to be too complicated to understand. I was pleasantly surprised to find that much of the paper was very readable and very interesting. I encourage people to have a look, at the news story and at some of the paper. I should also caution that the paper has a political element; it is important to be cautious. The paper raises a question, and discusses what is known; importantly, it discusses how we know -- and what the problems are. The discussion is very interesting. Emphasizing an answer is missing the point, from a scientific viewpoint.
There are two basic background points that the paper builds on:
* Our best estimate is that there have been five "mass extinctions" of life on earth in the last 540 million years (the period where there is an abundance of complex organisms). A mass extinction is defined by the loss of 75% of the species in a short time (geologically speaking). The most recent of these is perhaps the most famous. It was about 65 million years ago, and included the extinction of the dinosaurs; this event was associated with an asteroid colliding with Earth. The extinction of the dinosaurs opened up niches, and allowed the proliferation of mammals -- including humans. We thus recognize that extinctions are part of nature -- and are not entirely bad.
* We are now going through a time of loss of biodiversity. It may be caused, in part, by human activities.
So, they ask: Is this the 6th mass extinction? In order to address this, they need to make clear what the "rules of the game" are. How do we count species -- now, and for the distant past? What are the types of evidence we use, and what are the limitations of the analyses? These are the aspects of the paper that I found most interesting; they constitute a serious overview of how we know about mass extinctions.
|
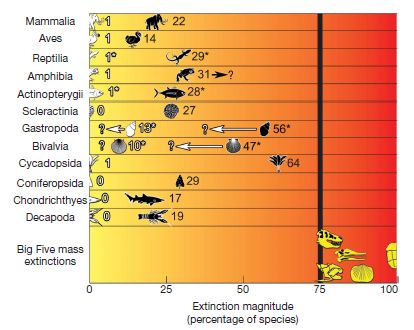
An example from the paper... (Figure 2)
The upper parts of the figure show known and projected extinctions for various types of organisms over the last 500 years. For each row, the white icon shows the known extinctions, and the black icon shows threatened species. (The number by each icon is the percentage of species.)
The lower part shows the five mass extinctions; each shows 75% extinction or more.
The general pattern is that the number of known extinctions is small. However, the number of threatened species raises serious concerns.
|
News story: Has Earth's Sixth Mass Extinction Already Arrived? (Science Daily, March 5, 2011.)
The article: Has the Earth's sixth mass extinction already arrived? (A D Barnosky et al, Nature 471:51, March 3, 2011.)
More about extinctions:
* Did selenium deficiency play a role in mass extinctions? (February 5, 2016).
* What caused the dinosaur extinction? Did volcanoes in India play a role? (April 13, 2015).
* What caused the mass extinction 252 million years ago? Methane-producing microbes? (October 12, 2014).
* The Obama lizard (March 20, 2013).
More about the effect of humans on biodiversity: The ultimate census: the distribution of life on Earth (June 22, 2018).
FDA to fast-track prosthetic arm -- Follow-up: videos
April 2, 2011
Original post: FDA to fast-track prosthetic arm (February 14, 2011). Borislav found some videos to complement this item
1. A video of the DARPA arm in action, with some commentary on it: YouTube: DARPA prosthetic arm. (Applied Physics Lab, Johns Hopkins University.) You can see that the prosthetic arm is mimicking the motions of the human. It is not clear how the signal is being transmitted, though wiring is evident. The video is a show of the arm motions, but not of its control system. (Incidentally, the same lab is responsible for the MESSENGER spacecraft. MESSENGER orbits Mercury, shoots Debussy (June 10, 2011).)
2. An older video of the DARPA arm, perhaps an earlier version (not clear). It provides some close-up pictures of the arm motions. YouTube: DARPA's Bionic Hand.
3. DARPA is not alone in working on such things. Here is a news clip about another project with similar goals. Again, we emphasize that it is not clear what control is being shown. YouTube: Man Controls Robotic Hand with Mind.
And a reminder that the original post on Prosthetic arms (September 16, 2009) included a video.
Another use of mind-controlled devices: Music-making technology -- for the physically disabled (April 23, 2011).
More DARPA robotics: See cat run (March 14, 2012).
Soft drinks (sugar) and blood pressure
April 1, 2011
Soft drinks again. Recall Fructose; soft drinks vs fruit juices (November 7, 2010). That post focused on the special effects of fructose, a natural sugar that some people consume in high quantities via soft drinks that have been sweetened with high fructose corn syrup.
Now we have a new report, which suggests a link between sugar consumption and blood pressure. The sugar consumption is for all sugars, not just fructose; the focus is on sugar-sweetened beverages (SSB), whether soft drinks or juices, as a major source of sugar. By looking at the accumulated databases of health information, they find a correlation between the consumption of SSB, and blood pressure (BP).
A key limitation of this type of study, as we have noted before, is that it does not look at causality. That is, they find that people who drink lots of SSB tend to have higher BP -- a correlation. However, we do not know that the SSB is causing the BP changes. Interestingly, they refer to one paper in which there is a direct test of BP changes upon drinking SSB; that paper also shows an effect of the SSB on BP. Thus the current paper should be taken seriously, though it certainly needs more careful follow-up.
The magnitude of the effect suggested here is about 1.5 torr (mm Hg) per can of SSB. This may seem small, but for those who regularly consume multiple cans of soft drink -- or equivalent amounts of juices -- each day, this can add up. Note that this would represent a substantial calorie intake, as well as possible contribution to BP.
News stories:
* Sugary soft drinks linked to high blood pressure. (BBC, March 1, 2011.)
* Sugar-Sweetened Drinks Associated With Higher Blood Pressure. (Science Daily, March 1, 2011.)
* Editorial accompanying the article: Sugar and Salt in the Pathogenesis of Elevated Blood Pressure. (K Stolarz-Skrzypek, Hypertension 57:676, April 1, 2011.)
* The article: Sugar-Sweetened Beverage, Sugar Intake of Individuals, and Their Blood Pressure: International Study of Macro/Micronutrients and Blood Pressure. (I J Brown et al, Hypertension 57:695, April 1, 2011.) The paper discusses other studies of sugar effects, both short and long term, on BP. (Those interested in the prospective study mentioned above should check out reference 30 of this paper.)
Also see: The Berkeley soda tax: does a "fat tax" work? (August 30, 2016).
March 30, 2011
How long is a hug?
March 29, 2011
This is a story that is, superficially, odd or amusing. However, they suggest it may reflect something more basic.
The simple story is that the author measured the length of 188 hugs, as shown on TV from the 2008 Olympics in Beijing. The mean length of the hugs was about 3 seconds. Analysis of classes of hugs showed some differences. Hugs of competitors were shorter than hugs of supporters, and hugs of Americans were shorter than hugs of Asians. Nevertheless, all the subgroups showed hug lengths around 2-4 seconds.
So? Well, the author suggests that the hug length is an example of a basic unit of mammalian biology: the length of time for a simple motor activity. She brings in diverse data -- for various animals: chimpanzees, deer, okapis, giraffes, kangaroos, raccoons, and pandas, as well as for humans from infants to adult. They all show a basic time for a unit activity of around 3 seconds. She even interprets the result in terms of underlying biochemistry and neurology. She concludes [final sentence]: "The finding suggests that these 3-s segments of time may be basic temporal building blocks of not only perceptual experiences and motor processes but also behaviourally expressed and synchronised, interpersonal, intersubjective experiences." How seriously should you take this? Beats me. Have a look, and at least enjoy a bit of unusual science. The news story is a good overview, and much of the paper is a readable discussion of these issues.
News story: Hugs Follow a 3-Second Rule. (Science Now, January 28, 2011.)
The article: Sharing the moment: the duration of embraces in humans. (E Nagy, Journal of Ethology 29:389, May 2011.)
Also see:
* How long is a yawn? (December 16, 2016).
* Genetics of the giraffe neck (May 27, 2016).
* Why do koalas hug trees? (June 13, 2014).
Human origins, and the species question
March 28, 2011
We have noted recent developments in understanding human origins, including genome work. It is a remarkable development that we now have information about the genome of two ancient populations of hominids, the Neandertals and the Denisovans. In both cases, there is evidence for some inter-breeding between the ancient population and what we call modern humans, Homo sapiens. We noted this, with its implications, in the post The Siberian finger: a new human species? -- A follow-up in the story of Denisovan man (January 14, 2011).
Inevitably, we ask: are these ancient populations part of our species, or not? The traditional view has been to consider Neandertals as a distinct species of human, but the inter-breeding results lead us to question that. The two papers on Denisovans make different statements on the species issue.
A recent news feature in Science addressed this species question. The main focus of the story was discussing various views of ancient human migrations. However, of immediate relevance is a "side-bar" (p 394) on "The Species Problem". It briefly summarizes a range of views on what "species" means in modern biology. The bottom line is that this is something of a mess. No big surprise; as we learn more, it is common enough in science for an idea we thought we understood to become murky. Reading this short sidebar is a useful introduction to the species problem. As a specific, you will see why the group studying the Denisovan man decided to step back and not take a position on whether or not that is a new species of human.
The article: A New View Of the Birth of Homo sapiens -- New genomic data are settling an old argument about how our species evolved. (A Gibbons, Science 331:392, January 28, 2011.) As noted, the side-bar on the species question is the main reason for this post.
More about ancient humans: An interesting skull, and a re-think of ancient human variation (November 12, 2013).
Playing in the sand
March 26, 2011
Borislav writes...
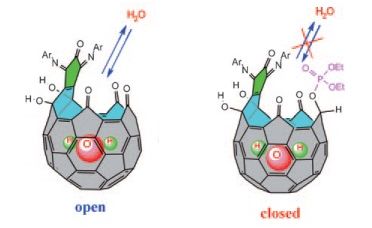
Imagine that you have two cylindrical sleeves (or shells -- the term used in the paper), one open at one end and one open at both ends. A simple example would be soda cans with one or both ends removed. If one end is removed, we have a closed sleeve (CS), since one end is closed. If both ends are removed, it is an open sleeve (OS). An ordinary drinking glass is also an example of a CS. If you try to press these two types of sleeves down into a pan of water, you might expect that the OS would move down into the water more easily, because the top end is open.
But what if we try this with a pan of sand instead of water? A group of French scientists has recently reported doing just that -- and the results are surprisingly complex. The first figure below shows some results.
The basic experiment is to press the cylindrical sleeve down into a bed of sand, and see how far it goes. The graph shows how far the sleeve goes into the sand, "z" on the y-axis, versus the "load" (how hard they push) on the sleeve, on the x-axis. They do this for four conditions: two types of sand bed and two types of sleeve.
|
The upper two curves (open circle and black circle symbols, with the curves almost overlapping) are for a loose sand, with either an open or closed sleeve (OS or CS). Both go down fairly easily, and it does not matter much whether the sleeve is open or closed at the top.
The next two curves (open and black diamonds) are for a more tightly packed sand, with the same OS or CS. These curves are quite different -- from the previous case and from each other. The CS (black diamonds) went considerably further into the sand than the OS (open diamonds).
(This is Figure 2 from the paper. Ignore the lower two curves, with no symbols.)
|
|
Why does the closed sleeve actually go down further -- in one case? Apparently, they suggest, because the increased pressure in the closed sleeve serves to disrupt the sand. The figure at left gives the idea. You can also see this in the movie file that accompanies the article; see below. One clue is that the sand level rises outside the sleeve; this is noticeable in the movie, and in the remaining frames of this figure in the paper.
This is Figure 3a from the paper.
|
News story: Convince Your Friends You're a Genius With Two Cans and Some Sand. (Science Now, February 7, 2011.)
Caution... Some of the stories, including the title of the news item above, might suggest that you can easily demonstrate the effect yourself. Maybe, maybe not. It may be easy enough to try, if you want. However, the result depends on the precise nature of the sand bed, as shown above. So it may or may not work for you. If you try and it does not work, you might experiment with the nature of the sand bed.
The article: Penetration and Blown Air Effect in Granular Media. (R Clement et al, Physical Review Letters 106:098001, March 4, 2011.) There is a movie file available there; choose the Supplemental Materials tab. The movie shows only the case of the CS going into the denser sand; this is the most interesting case, and the movie is helpful and recommended.
More about the properties of sand:
* How to climb a pile of sand (November 7, 2014).
* Sandstorms and midair collisions (September 16, 2013).
A modified chicken that cannot transmit bird flu
March 26, 2011
The 2009 influenza (flu) virus seems to have passed without causing much problem. But the specter of a serious flu pandemic remains -- and remains substantially a mystery. What is likely is that a serious flu will involve birds -- including domestic poultry. A serious strain of bird flu is active in Asia, causing substantial economic losses -- and causing fear about what might happen if the virus adapts to humans. Thus the idea of reducing flu infection in birds is of interest -- both to protect the birds per se, and to protect us.
New work offers a novel approach to reducing bird flu. It's already possible to vaccinate birds against the flu, But that has the same disadvantages as vaccinating humans against the flu. What if we could engineer the birds to be intrinsically resistant to the flu? That is the idea of the new work. They genetically modify the birds to make a small piece of RNA that mimics a key part of the viral genome -- a part needed for the virus to replicate. As a result, the viral polymerase (replication system) sees this "decoy" RNA -- rather than the virus. With the polymerase tied up with the decoy, there is little virus replication.
Here is an example of some of their preliminary work, showing that the decoy can inhibit the viral polymerase enzyme. No chickens or viruses here, just cells with various genes being added to test the proposed interaction. This is Figure 1C from the paper, and summarizes two types of experiments.
|
The first three bars are for one experiment. The left-most bar, labeled pLentilox, is the control; enzyme activity is 100%. (The control here is simply the vector used in the rest of the experiment for carrying decoys, but without anything added; that is, it is an empty vector.) Decoy 5 is the decoy they designed; you can see that it greatly reduces the enzyme. Decoy 7 was designed so that it does not affect the enzyme, and indeed it does not; a control such as this helps to make the point that the first decoy is working for the intended reason.
The two right-most bars are for another type of experiment. Non-TG is the control, at 100%. TG-D5 uses the same decoy 5 we saw above, and again it inhibits the enzyme.
|
The experiments above establish that the idea has merit: a decoy can inhibit the viral enzyme, It's now time to test whether this works in real chickens with real viruses. They modify chickens to produce the decoy, and they present some results on how these modified chickens respond when challenged with flu virus. They find that the modified birds infected with flu may get sick and die, but virus transmission is greatly reduced. Blocking transmission is the key to blocking the spread of an infectious disease, so the results are encouraging.
This is an intriguing piece of work. It is logical, and the data show a good effect. However, there are reasons to be cautious -- as both the Science articles make clear. The work here should be taken as preliminary: an interesting finding that deserves to be followed up. Only with careful follow-up will we know how effective it is over the long term, and what side effects there might be. On the plus side, if it works, it probably can be extended to other flu virus hosts, particularly the pig, and perhaps to other viruses. Each case will need to be worked out, but if one case works well, others will follow.
News story: Chickens Modified to Not Spread Bird Flu. (Discovery News, January 14, 2011.)
* News story accompanying the article: Avian influenza: Transgenic Chickens Could Thwart Bird Flu, Curb Pandemic Risk. (M Enserink, Science 331:132, January 14, 2011.)
* The article: Suppression of Avian Influenza Transmission in Genetically Modified Chickens. (J Lyall et al, Science 331:223, January 14, 2011.)
Many posts on the flu are listed on a supplementary page Influenza (Swine flu).
More decoys: Making decoys that trap the SARS-2 virus (August 10, 2022).
More on disease transmission... Should you ask your doctor to go BBE? (May 12, 2014).
March 23, 2011
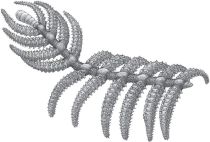
How fast can a plant eat?
March 23, 2011
Borislav writes...
Urticularia is a genus of carnivorous plants, commonly called bladderworts, that occur in fresh water and wet soil across every continent except Antarctica. They are popular for their flowers -- and they sport a vicious death trap intended for wandering critters. New work reveals how the trap operates.
|

|
|
The figure is reduced from Wikipedia: Utricularia macrorhiza flowering. Photographed near Wright's Lake, California, by Noah Elhardt. (This is a different species than those used in the paper here.)
|
The trap-chamber is about the size of an ant. It is elastic and maintained under vacuum. When triggered, the entry shaft opens, creating a powerful whirlpool that lasts for half a millisecond and sucks in the wandering prey. Then the shaft closes, and the feast, which lasts a few hours, begins. After consuming the prey, the chamber is readied for the next round, in 15-30 minutes. The video, below, shows this very well.
Video: The ultra-fast trap of an aquatic carnivorous plant. (YouTube)
News story: Ultra-Fast Suction Traps Leave No Chance for Prey Animals. (Science Daily, February 16, 2011.)
The article: Ultra-fast underwater suction traps. (O Vincent et al, Proc. R. Soc. B 278:2909, October 7, 2011.)
More about bladderworts: Junk DNA: message from the bladderwort (June 4, 2013).
Another type of carnivorous plant: Why would a plant have leaves underground? (January 21, 2012).
Also see:
* Venus flytrap: converting defense into offense (July 27, 2016).
* Carnivorous plants: A blue glow (March 16, 2013).
And now, a carnivorous alga: Carnivorous algae -- that hunt large animals (October 7, 2012).
Your genes: What do you want to know, and when do you want to know it?
March 22, 2011
This post is prompted by a news feature in a recent issue of Science. The topic is familiar enough: getting information about your genes, part of the broad issue of personalized medicine. The article starts with a little story that is, frankly, rather scary. So, I think it is worth sharing.
The article: What Would You Do? (J Couzin-Frankel, Science 331:662, February 11, 2011.) Lead-in: "As technology makes it easier to sequence people's DNA for research, scientists are facing tough decisions over what information to give back."
This is not a new topic. Numerous Musings posts have dealt with the emerging story of personalized medicine; some have dealt with the ethical issues. An early post, with links to many others, is: Personalized medicine: Getting your genes checked (October 27, 2009). Most recently we presented the declining cost of genome sequencing -- a point that makes the current story all the more relevant. That post is: The $1000 genome: Are we there yet? (March 14, 2011). (The articles for that post and this one are together in that issue of Science.)
Sometimes it is tempting to blame the advancing knowledge for creating ethical issues. However, in a sense it is only the details that are new. Some years ago, in the early days of recombinant DNA work, there was concern that such work would create ethical problems. I gave talks about various aspects of the new work from time to time at local high schools. One point I made was to discuss an ethical problem resulting from parents refusing a standard medical treatment for their child, and the attempt of the state to take the child from the parents so they could treat the child. This case was from the current news -- and had nothing to do with any advanced technologies. Ethical issues usually, by their nature, involve different values we hold coming into conflict with each other. It is the nature of values that they will conflict. Let's promote the discussion of the values and how they might apply to one problem or another, so that individuals can make decisions they are comfortable with -- for themselves.
Consistent with the previous point, I post this item without intending to favor any particular outcome. Read the article, learn about what is known, think about the values involved and how they may conflict -- so you can make decisions for yourself. You can't avoid the question.
Drumming affects caste development
March 21, 2011
Let's just jump in and look at the data.
Developing wasp larvae were exposed to sound. The "experimental" sound was a 17 Hz drumming -- similar to what they would be exposed to normally, by the beating of the antennae of the queen. As a control, other wasps were treated with a "random" noise, of similar total energy. The researchers then measured the fat stores of the wasps; they know that the fat store correlates well with the fate of the wasp: workers have low fat stores compared to queens.
The results are shown at the right. Each point is for one wasp; the height of the point shows the fat store. The y-axis scale is not shown (because of the way I cut out part of a figure), but the points range from about 5 to 30% percent. What's important is the clear difference between the two treatments. Wasps treated with the 17 Hz sound had lower fat stores. This is consistent with the suggestion that the sound -- normally from the queen -- directs the wasps toward development as a worker.
|
|
|
This is Figure 3B from the paper. The number above each set of points shows the number of wasps in that set.
|
Thus the work shows how two different types of animals result from genetically identical young -- as a result of a physical stimulus (the sound). The immediate data show only that the sound affects the fat store, but they think that this is part of a bigger story.
A couple of cautions...
* The story is incomplete here. However, the work lays a good base that should allow them to complete the story. Perhaps they will uncover some surprises, but as one reads the work here, and the background, they have at least formed a good hypothesis.
* The answer here is for this animal (the wasp Polistes fuscatus). Other animals with similar life styles may do things differently. In fact, they note that the analogous decision for some honeybees is made by a nutritional signal -- rather than the mechanical signal found here.
News story: Drumming guides caste system in wasps. (College of Agricultural and Life Sciences, University of Wisconsin, Madison, January 24, 2011.) At the bottom of the page is a link that leads to a short movie file. Recommended! The movie is also at: YouTube video.
The article: A Mechanical Signal Biases Caste Development in a Social Wasp. (S Suryanarayanan et al, Current Biology 21:231, February 8, 2011.)
More on wasps...
* Wasp hides under ladybug (January 3, 2012).
More about social insects: Insulin: role in reproduction in ants (October 2, 2018).
Other posts on drumming...
* Why don't woodpeckers get headaches? Designing better shock absorbers (April 18, 2011).
* Playing music can make you sick (July 31, 2010).
Bird lays egg
March 19, 2011
At age 60, that is news.
Borislav sends the following news story... Oldest recorded wild bird raising a chick. (USA Today, March 8, 2011. Now archived.) We don't have any more information, but the article discusses why this is interesting -- as well as fun. We'll just let it stand.
The date on the story listed above is March 8. Three days later, Mother Nature added a footnote: Japan tsunami: Thousands of seabirds killed near Hawaii. (BBC, March 16, 2011.)
Update, 2021...
Wisdom the albatross has hatched yet another chick at the age of 70 -- She's the oldest known wild bird in history - and she's pretty awesome! (Fermin Koop, ZME Science, March 8, 2021.)
More on Hawaii: Hawaii's hot spot(s) (October 9, 2011).
More about seabirds: Why don't penguins fly? (August 24, 2013).
More birds: Of birds and butts (February 2, 2013).
More about bird eggs... What is the proper shape for an egg? (September 18, 2017).
Gut bacteria affect the brain
March 18, 2011
A new paper that makes an interesting but perhaps unsurprising point is getting considerable attention. So let's note it.
The main point of the paper is to show that mice with "normal" gut bacteria and mice lacking gut bacteria behave differently. That should be no surprise; gut bacteria are effectively part of the organism. If we accept that food intake affects the brain, then we should expect that gut bacteria, that modify our food intake, would affect the brain.
|
Here is an example of their data, from their Figure 1B.
In this test, the mice were put into a field box, and observed. The data points are the distances the mice traveled (in each 10 minute interval). The lower curve (open symbols) is for normal mice, with their normal bacteria. The upper curve (closed symbols) is for "germ-free" mice. (The little inset shows similar data for the time intervals shown.)
The observation is that the results are different for the mice with and without bacteria. In this test, the germ-free bacteria show more activity.
|
They do more. First, they show effects on gene function in the brain, not just behavioral effects. Second, they show that the effect of bacteria occurs early in life. Adding gut bacteria to germ-free mice early reverses the effect of bacterial deprivation; adding back the bacteria later does not.
This is very preliminary work at this point. They have studied only extreme conditions: no bacteria vs all bacteria. Ok, a start. It lays the groundwork for doing experiments with specific bacteria. Do specific gut bacteria have specific effects on the brain -- in mice?
This is work worth knowing about, but don't try much to interpret it. The main point is that it opens up an area for further work. It is a part of the big story of the role of our microbiota.
News stories:
* Bacteria in mouse gut affect development and behaviour. (BBC, February 1, 2011.)
* Bacteria in the Gut May Influence Brain Development. (Science Daily, February 1, 2011.)
The article, which is freely available: Normal gut microbiota modulates brain development and behavior. (R Diaz Heijtz et al, PNAS 108:3047, February 15, 2011.)
Among the many posts that deal with how we get along with microbes...
* Is Helicobacter pylori good for you or bad? (April 10, 2012).
* Are childhood infections bad for brain development? (February 5, 2011).
* Designing a probiotic that fights cholera (December 13, 2010).
Thanks to those who called my attention to this work. I had already noted it; however, "extra votes" help to ensure that a particular paper really gets included.
March 16, 2011
A curcumin-based drug and stroke treatment
March 16, 2011
Curcumin is the yellow stuff in the spice turmeric. It is a common ingredient of curries. Various possible health effects have been suggested for curcumin. These suggestions come from simple correlations, that people who eat lots of curcumin have less of some disease, followed by some lab work in model systems. At its best, the work shows some effect in an animal model, and offers some explanation for why it works. Nevertheless the question of its usefulness in humans usually remains an open question.
We noted an interest in using curcumin to treat Alzheimer disease [Curry and Alzheimer's disease (June 15, 2009)]. So far, limited testing has been reported in humans, with no clear benefit.
John now sends a news story about the possible use of a new drug derived from curcumin to treat stroke. Animal results have shown promise. The good news is that they want to do testing in humans. It is an important part of this story that they have used curcumin as the starting point, but the drug being tested is a derivative -- a derivative designed to better cross the blood-brain barrier. By modifying the curcumin, we can no longer simply call it curcumin. For example, one reason for the interest in using curcumin is that it is already widely consumed, and regarded as rather safe. However, once we modify the molecule, we can no longer assume that it has the same safety profile. After all, the purpose of the modification was to get more of it into the brain. It remains to be seen whether this increases side effects as well as effectiveness.
|
Here is an example of the results, using a rabbit model for studying stroke. This is Figure 3 of the first paper listed below (the one in Journal of Neurochemistry).
In this test, stroke is induced by injecting blood clot material into the rabbit; this results in a blood clot (embolism) in the brain. The x-axis of the graph shows the amount of blood clot, which serves as a measure of the severity of the stroke event. The rabbits are then observed, and their response is scored; the Methods section of the paper elaborates on how this is done. The y-axis of the graph shows the percent of rabbits with abnormal behavior. Thus the y-axis is a measure of "damage".
|
In the test shown here, some of the rabbits are controls -- untreated. Others are treated with the drug one hour after the stroke event. The dotted curve (left) shows the results for the control rabbits; the solid curve (right) shows the results for the rabbits treated with the curcumin-based drug CNB-001 one hour after the induced stroke. You can see that the solid curve is shifted to the right. That is, it takes more clot (more severe stroke event) to get the same amount of damage when the drug is used. In other words, the drug reduced the damage.
|
Modifying a potential drug to change specific properties is a standard tool in drug development. Having new options for treating stroke would be welcomed. Thus the new work is welcome. However, caution is important. Do not assume that anything in particular will work out, and do not weigh very heavily anything you know about curcumin as being relevant to a possible new drug that is related to curcumin. This is what drug testing is about, and the annals are littered with well-intentioned but failed drugs.
News story: Spice drug fights stroke damage. (BBC, February 10, 2011.)
Articles:
* Via abstract at PubMed... Delayed treatment with a novel neurotrophic compound reduces behavioral deficits in rabbit ischemic stroke. (P A Lapchak et al, Journal of Neurochemistry 116:122, January 2011.) Use of the new drug in a rabbit model.
* Neuroprotective and neurotrophic curcuminoids to treat stroke: a translational perspective. (P A Lapchak, Expert Opin. Investig. Drugs 20:13, January 2011.) Overview. This could be a good place to start. Browse and check the section headings. The article includes chemical structures for curcumin, and for natural and synthetic derivatives.
A background post is listed above.
Also see: Can we pinpoint a specific molecular explanation for tissue damage following a heart attack? (March 24, 2015).
What is it? Follow-up
March 15, 2011
Original post: What is it? (March 8, 2011).
I have updated the original post to include the work that brought this up, a news story, and a brief discussion. Go to the original post: What is it? (March 8, 2011).
The $1000 genome: Are we there yet?
March 14, 2011
The main purpose here is to discuss a single graph. In fact, the main purpose is to discuss a single curve on that graph.
Look at the red curve on the graph at the right. It shows, in round numbers, the cost of DNA sequencing over the last decade, The scale for this line is on the right -- a log scale. (The curve is so well-labeled that one hardly needs to check that scale.)
The curve starts in 2000, about the time the human genome project was announcing a "complete", though rough, human genome. That project cost a few billion dollars, but much of that was development costs. As of that time, they estimate the cost of sequencing as $10,000 -- per million base pairs (Mbp). The human genome is about 3 billion base pairs, so that would be about $30 million to sequence a human genome.
The cost of DNA sequencing has dropped dramatically over the decade. On average, the cost has dropped by half every year or so -- a faster pace than the famous Moore's Law for computers. The graph now shows $1 -- per Mbp. That would be about $3,000 for a human genome.
|
|
As the original human genome project wrapped up, a new goal was formulated: the $1000 genome. That's a nice round number, and the graph here is rough. Nevertheless, we are about there. The cost of sequencing the human genome has come down by a factor of 10,000 over the decade. If you need your genome sequenced, it is now practical. If you just want your genome sequenced, for fun or curiosity, why not?
Caution... Although it is now practical for an individual to get his or her genome sequenced, our ability to understand the genome information is still limited. Nothing here is intended to encourage anyone to actually get their genome sequenced. The point is that cost per se is no longer the critical limitation.
The graph is part of a news story, generally discussing the pressure that genomics is putting on computer systems. The lower curve in the graph shows the cumulative amount of genome sequence known; it is overwhelming the computer systems needed to analyze it. Those interested in the computer issues may find the article of interest. It is: Will Computers Crash Genomics? (E Pennisi, Science 331:666, February 11, 2011.)
Among many Musings posts on sequencing, the following seem especially relevant here...
* The $1000 genome: we are there (maybe) (January 27, 2014). An announcement, from a supplier of sequencing equipment.
* More genome sequencing for newborns? (September 17, 2013).
* DNA sequencing: an overview of the new technologies (June 22, 2012). An accompanying post discusses nanopore sequencing.
* How many human genomes have been sequenced? (November 30, 2010).
* Genome sequencing to diagnose child with mystery syndrome (April 5, 2010).
* A subsequent post also is about how we deal with genome information: Your genes: What do you want to know, and when do you want to know it? (March 22, 2011). (The articles for that post and this one are together in that issue of Science.)
* A post on cancer genome sequencing... Studying cancer development by analyzing the genomes of individual cancer cells (May 16, 2011).
* Using DNA sequencing to monitor a patient: DNA testing -- for rejection of a transplanted heart (May 24, 2011).
* Is whole genome sequencing a useful medical tool? (November 9, 2011). What is the role of genome sequencing in medicine?
* Also see: Using DNA for data storage (March 5, 2013). That's storage of computer data. DNA sequencing is how you read it.
There is more about genomes on my page Biotechnology in the News (BITN) - DNA and the genome.
The first report of a new planet
March 13, 2011
Thus began a paper that marked the first step in discovering a planet. Now, we have had various Musings posts about discovering planets; it is something of a hot topic these days. So let's be clear... This was the first time in man's recorded history that the discovery of a planet was reported. It was the first time that a planet not visible with the naked eye was reported. This paper reported the discovery of the planet Uranus -- in 1781, by musician-turned-astronomer William Herschel.
The solar system planets from Mercury through Saturn are visible to the naked eye, and were known to the ancients. There may be some interesting stories about how these were discovered, but we have no record of them.
There are some things you need to know in order to deal with this paper...
First, simply to read it, you need to know something about the history of the letter "s". The word "Tuefday" is your first hurdle -- and clue. In those days, our "s" was written with a character that looks like an "f" (except at the end of a word, where our modern s is used for plurals; see "ftars" -- stars -- in the second line).
Second, you will not find the name Uranus in this paper. In fact, you won't find any name at all for the new object. When the dust settled, Herschel did provide a name, honoring his fellow German immigrant who was the English king: Herschel called it the Georgian star. (Americans have bad stories to tell about that king, but that is not for here.) The modern name Uranus came much later; Herschel had nothing to do with it.
Third, and most important... The quotation above refers to a comet, rather than to a planet; so does the title of the paper. Understanding how Herschel's observations led to this being identified as a planet requires looking more carefully at what was found, with some context about the emerging story of the nature of the heavens.
- The first observation was simply that the new object was large. The distant stars are basically point sources of light. We see twinkling, but not really size; the observed size does not depend on magnification by the telescope. Herschel found something that was big -- and over time showed that its apparent size did depend on the magnification, and on its course through the skies (i.e., on its orbit).
- The previous point talks about "course through the skies". That in itself was important. In the ancient view, the stars had fixed positions in the skies -- as if they were part of some "dome". The planets were distinguished by moving through the star system; the word planet means wanderer. (We now understand this distinction is due to distance. The stars are simply so far away that we do not ordinarily observe their motion relative to the other stars.)
|
|
The figure above shows the movement of the new-found object, now understood to be the planet Uranus, across the sky. It is based on measurements of the angle between the new object and a known fixed object (α -- where the dashed lines converge). This is Figure 1 of Herschel's paper.
|
The article, which is freely available: Account of a Comet. (by Mr. Herschel, Philosophical Transactions of the Royal Society of London 71:492, 1781. The paper was originally read to the Society on April 26, 1781.) The quotation at the start of this post is the opening paragraph of this paper.
Another planet search: Finding Planet 9: You can help (March 13, 2017).
Posts on the search for planets beyond our solar system:
* An "early" report... The first truly habitable exoplanet? (October 12, 2010).
* A post about the Kepler mission -- a large-scale search for extrasolar planets... The Kepler Orrery (June 3, 2011).
A post that mentions Uranus: Rendezvous with Lutetia (August 14, 2010).
This item is being posted to Musings 230 years -- to the day -- after Herschel's initial observations shown above.
* Previous history post: Evolution of the end of Origin (November 30, 2009).
* Next: Central Dogma of Molecular Biology (August 16, 2011).
My page Internet resources: Miscellaneous contains a section on Science: history. It includes a list of related Musings posts.
The legacy of Herschel: A water fountain for Saturn (October 23, 2011).
More from William Herschel: Why aren't asteroids considered planets? Implications for Pluto? (September 30, 2018).
A post that is, in part, about Herschel's son: Blueprint of a seaweed (1843) (May 2, 2012).
Another planet discovery: Discovery of Neptune: The one-year anniversary (July 12, 2011).
More from Space: European journal open to authors around the world -- and beyond (January 2, 2012).
Herschel was originally a musician before becoming an astronomer. His status as a scientist-musician is noted on my page of Internet resources: Miscellaneous under Art & Music: Science. That item includes a photograph of Uranus.
A post about the journal that Herschel published that article in: Happy birthday, Phil Trans (March 25, 2015).
Rats, bananas, and tuberculosis
March 11, 2011
Before going on, what do you think is the story line connecting the elements of the title?
When ready, go have a look at one of the following news stories:
* Detecting Tuberculosis: No Microscopes, Just Rats. (New York Times, January 3, 2011.)
* Rats vital in curbing spread of TB. (APOPO, January 20, 2011. Now archived.) A page from the organization doing the work. Links to much information. (APOPO? It is a Dutch acronym: Anti-Persoonsmijnen Ontmijnende ProductOntwikkeling; in English: Anti-Personnel Landmines Detection Product Development. The name of the organization refers to another use for the rats.)
* Also note that an update to this post has been added at the end.
Stories about using an animal, such as a dog, to detect some disease are common enough. The logic behind them is straightforward: the animal is trained to distinguish some feature, usually the odor, of a diseased sample compared to a normal sample. Rarely do we hear of the details behind the detection, such as what specific molecules are being detected. Perhaps more importantly, rarely do we hear of such a test actually getting serious consideration for practical use. It's not entirely clear how close this is to practical use, but maybe. The point is that rats are quite good at detecting tuberculosis (TB), and the use of rats is probably less expensive that currently used tests (at least the more sensitive ones). (The bananas? They are used as reward for the rats during the training phase.)
Quite good? The rats detect most cases that were already noted by the routine field test (examining a stained sputum sample under the microscope). (Why the rats missed a few cases is not addressed.) Interestingly, the rats detected a huge number of samples that the routine test did not. Are these false positives? Well, more careful examination has already suggested that a third to a half of them are real positives, but had been missed in the initial screening. So what about the rest? Are they false positives? They don't know. It may be that the rats are simply more sensitive, and are detecting samples with a low level of TB bacteria. An important part of the follow-up will be to sort this out.
Other posts on TB include...
* A new vaccine against tuberculosis? (November 9, 2018).
* How did tuberculosis get to the Americas? (January 24, 2015).
* A bio-ethics controversy: HIV-TB interaction (July 13, 2010).
* Both ways (November 18, 2008).
For more on rats: A rodent that can't chew (November 5, 2012).
Another example of using animals to help with medical diagnosis: Can pigeons diagnose cancer by reading patient X-rays? (December 29, 2015).
Also see:
* Bomb-sniffing grasshoppers? (November 8, 2020).
* Copper ions in your nose: a key to smelling sulfur compounds (October 10, 2016).
* When life imitates art... Bacteria blink for arsenic (April 15, 2012). Biosensors.
* Leprosy: the armadillo connection (May 14, 2011). The bacteria that cause tuberculosis and leprosy are related: both are from the genus Mycobacterium.
More, January 30, 2012...
Here are some recent stories. The new paper provides more evidence of the same type as shown earlier; the questions raised above are not really addressed.
News story: Tanzania: Trained Giant Rats Sniff Out Land Mines And TB. (I Eveleens, African Spotlight, January 3, 2012. Now archived.) This story also notes the use of the same type of rat in detecting land mines.
Article, which is freely available: Using giant African pouched rats to detect tuberculosis in human sputum samples: 2010 findings. (A M Mahoney et al, Pan African Medical Journal 9:28, July 18, 2011.)
March 9, 2011
What is it?
March 8, 2011
I'll post an answer, with proper source information, next week
[see immediately below].
Answer (posted March 15, 2011):
The picture shown is a drawing -- based on analysis of fossils. The paper includes some beautiful photos of the fossils themselves; have a look. The drawing reflects some interpretation by the authors.
The specimens are about 6 cm long -- a little over 2 inches. That means the small figure above may be about real size (depending of course on your screen); the "full size" image is larger than the specimen itself, but shows more detail.
Careful analysis of the specimens suggests that they are something like worms with legs. Most interesting to the scientists are the skeletal features, suggesting that this is an organism that may be something like a primitive arthropod. (Arthropods are segmented animals, such as insects and lobsters, with exoskeletons and lots of joints.)
The spiny appearance has led to the nickname "walking cactus". In fact, they reflected that in the formal name (genus and species) they proposed: Diania cactiformis. (The genus name has a Chinese origin that is not well explained in the paper.)
News story: Meet Diania the walking cactus, an early cousin of life's great winners. (E Yong, Not Exactly Rocket Science (Discover blog), February 23, 2011.)
The article: An armoured Cambrian lobopodian from China with arthropod-like appendages. (J Liu et al, Nature 470:526, February 24, 2011.)
Other posts on walking include:
* Personal optimization of an exoskeleton (September 22, 2017).
* Robots should learn to crawl first, then walk (February 27, 2011).
* Berkeley Bionics: From HULC to eLEGS (October 22, 2010).
* How molecules walk: a movie (December 15, 2009).
Other "What is it?" features include...
* Next: What is it? (May 25, 2011).
* Previous: What is it? (February 7, 2011).
Who is #1: the most DNA?
March 7, 2011
The twentieth century brought a basic understanding of heredity at the molecular level. Briefly, the chemical known as DNA carries genetic information, and the basic unit of information is the "gene" that codes for one protein chain. The discovery of the structure of DNA by Watson & Crick is symbolic of this understanding. [The original Watson-Crick paper on the structure of DNA (October 25, 2010).]
If genes or DNA are the underlying basis of heredity, surely it is good to have more of them? Surely, more complex organisms have more? But no. Biology is not so straightforward, First, there is no particular relationship between the number of genes and the amount of DNA. That is, the gene density in the DNA varies widely from one organism to another. Second, neither measurement correlates well with any measure of complexity. Clearly, the basis for genome size -- whether measured by amount of DNA or by number of genes -- is a complex story.
No matter the importance, it is human nature that we like to keep score. In recent months, two newcomers have taken over the #1 spot on genome size lists. One is discussed in this post, and one is discussed in the accompanying post, below: Who is #1: the most genes (for an animal)? (March 7, 2011).
The first paper is based on work measuring the DNA content of various plants found at the Royal Botanic Gardens at Kew (England). They show that a particular plant, Paris japonica, has a larger genome than any eukaryote previously reported. In this case, genome size refers to the amount of DNA in the haploid (1C) chromosome set.
|

|
The figure at right is reduced from the main figure in the ScienceDaily news story listed below.
|
|
Here is an example of how they measure the genome size, from Figure 1C of the paper.
They prepare nuclei from a mixture of their sample ("2") and a reference material whose genome size they know ("1"). They then add a fluorescent dye that binds to DNA; the amount of dye bound is a measure of the amount of DNA. They then measure the fluorescence from each nucleus.
The graph shows the number of nuclei (y-axis) with a particular amount of fluorescence (x-axis). You can see that the data is largely in two peaks -- one for each kind of nucleus. It appears that nuclei of peak 2 (the sample, at about 300) are about 3 times bigger than the nuclei of peak 1 (the reference, or standard, at about 100). The little table in the figure shows the detailed analysis, and shows that the nuclei of peak 2 are 2.807 times bigger. Since the genome size of the reference is known, they multiply that by 2.807 to get the genome size of their sample. It is 152 picograms (pg) -- for "1C", the haploid DNA content.
|
A 152 pg genome for this little plant. That is about 15% larger than that of the lungfish, the previous champ. For comparison, humans have about 3 pg of DNA in the 1C (haploid) set.
Some things to note about this work...
First, it is about amount of DNA, not number of genes. As noted above, these vary quite independently. We do not yet know the number of genes; however, it is likely that the gene number in this plant is not much different than in other plants.
In order to claim that this genome is the largest eukaryotic genome, they have to ignore one measurement that has been reported. There is an old report of the genome of an amoeba, Amoeba dubia, that is about five times larger than the genome reported here. There has long been skepticism about that result, and they choose to set it aside.
They note that their plant, like many plants, has undergone genome duplication -- twice! That is the plant may behave as a diploid, but actually is octuploid. Thus the large genome size is not fundamental to this group of plants, but reflects duplication events. This is an interesting but incomplete story in how organisms evolve. One reason biologists look at genome sizes is to try to see the evolutionary story.
News stories:
* Jaume and the Giant Genome. (The Scientist, February 2011.)
* Rare Japanese Plant Has Largest Genome Known to Science. (Science Daily, October 7, 2010.)
The article: The largest eukaryotic genome of them all? (J Pellicer et al, Botanical Journal of the Linnean Society 164:10, September 2010.)
A good general resource on genome sizes is the Animal Genome Size Database, maintained by Ryan Gregory at the University of Guelph. Choose the Statistics page (menu bar at the left) for a nice overview -- of all genome sizes, plant and microbial as well as animal. The figure near the bottom of the Statistics page is good perspective. [This database is also listed on my pages Internet Resources for Molecular Biology: Genomes and Unusual microbes: Microbes with too much DNA.]
Thanks for Borislav for calling this new plant genome work to my attention.
The accompanying post, below, is related to this one: Who is #1: the most genes (for an animal)? (March 7, 2011). At the end of it are some general comments.
More about genome duplications: On genome duplications (September 10, 2015).
There is more about genomes and sequencing on my page Biotechnology in the News (BITN) - DNA and the genome. It includes an extensive list of related Musings posts.
Another post from a journal of the Linnean Society... Was Linnaeus's original elephant African or Asian? (December 7, 2013).
Who is #1: the most genes (for an animal)?
March 7, 2011
This post is related to the accompanying post, above: Who is #1: the most DNA? (March 7, 2011). If you have not already done so, I encourage you to at least read the introductory parts there before continuing with this item.
This paper is very different, yet in some ways raises some similar issues. Scientists have determined the genome sequence of Daphnia pulex. What's Daphnia? It's sometimes called a water flea -- because of its behavior (it jumps around, seemingly erratically), but it is actually a crustacean, something like a tiny shrimp. Daphnia has long been a major organism for biological research, so doing its genome sequence was a welcome development. And an interesting one.
|
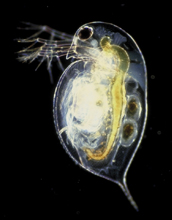
|
The figure at right is from the main figure in the NSF press release listed below.
|
What's so interesting about the Daphnia genome? Genes. Lots of them. Over 30,000 genes -- the largest number of genes found in any animal so far. (Some plants have more.) Tiny Daphnia has nearly 50% more genes than we do.
Why does this little critter have so many genes? Of course, our story on this is quite preliminary; we just learned that there are so many. But there are some observations...
A key observation is that there are many sets of related genes. Certain genes have been duplicated (or "amplified"). The duplicates diverge some, to become distinct -- but related -- genes. In the case of the Paris japonica plant of the accompanying post, it seemed that whole chromosomes, perhaps the whole genome, had undergone duplications. In this case, it seems that individual genes have been duplicated. Broadly, various types of duplication events are now well understood to be major parts of the evolutionary process.
Daphnia is a very adaptable organism. The term you will see is phenotypic plasticity. Phenotype refers to the characteristics of the organism, and plasticity indicates that the characteristics can vary. What they begin to explore is how the large gene set is related to the plasticity. Put Daphnia under a new set of conditions, and it turns on new genes. Daphnia has different genes for different life conditions. This is a story that will receive much further attention. It is an example of the role of genome studies in understanding the organism.
Press release from the funding agency: The Most Genes in an Animal? Tiny Crustacean Holds the Record. (National Science Foundation, February 3, 2011.)
* News story accompanying the article: Genomics: A Genome for the Environment. (D Ebert, Science 331:539, February 4, 2011.) Includes a nice introduction to Daphnia, and its importance in biological research.
* The article: The Ecoresponsive Genome of Daphnia pulex. (J K Colbourne et al, Science 331:555, February 4, 2011.)
General comments about this and the accompanying item (above)...
Both involve organisms with one or another feature of being #1 on some genome list. One important point is that being #1 per se does not matter much, and being #1 in one category has no particular relevance to being #1 in another. Daphnia, with the largest known number of genes for any animal, actually has a fairly small genome. Being #1 catches our attention, but more important is to learn the features of each genome.
One idea does come through as important in both cases: duplication. This may involve duplication of the whole genome, of complete chromosomes, or of certain regions of the genome. The broad idea of duplication is increasingly recognized as important. Duplication creates extra copies -- which are in a sense not needed. Thus they are free to mutate, and take on new function. Other duplicates may mutate to being non-functional (what we call pseudo-genes), and may eventually be lost. Duplications play an important role as "raw material" for evolution. New genes are usually not made from scratch, but by changing copies of existing genes.
A corollary of the previous point is that being #1 is likely to be a transient state. Duplication has occurred, but the role of the duplicates has not been determined. Some will take on new functions, some will be lost. I would not be surprised that if we came back in some millions of years, we would find that both organisms discussed here have less DNA or fewer genes than they now have. That might represent progress -- toward a more refined genome.
Child development: nature vs nurture? Year 2 as a window of opportunity.
March 5, 2011
It is generally accepted that children of higher socioeconomic status (SES) do better in school than children of lower SES. Why, and what might we do about it?
A new study shows that the differences are clear by age 2 -- but minimal at only ten months. Further, they show that genetics plays a role in the progress made by the children of higher SES. It is as if the poorer environment of the children of lower SES prevents them from realizing their full potential, from realizing what genes would allow -- and that there is a key step in this process during the second year of life.
A key tool used here, and widely in biology, is study of twins. So-called identical twins come from the same fertilized egg; the more technical term, monozygotic twins, derives from this fact. They are genetically identical, at least to a first approximation. Fraternal twins come from different eggs, and therefore are no more genetically similar than any siblings. Thus the general idea is that differences between identical twins and fraternal twins reflect differences in the role of genetics.
As so often, it is important to distinguish their facts and their interpretations. They did certain tests, and found certain results. The nature of the tests is actually not very clear in the paper itself, which simply refers to them. The news stories give you a better idea what was done. Then we raise the question of SES vs development. What aspect of SES, precisely, is relevant to the developmental steps tested here? What genetic features are relevant? Would we get different results if we studied other aspects of development? As the news stories make clear, the authors want to look at such questions. That is, the work here helps aim them to further work; it does not reach a simple conclusion on its own. Nevertheless, it does lead to some optimism: if we could learn what the critical aspects of child development are, at any particular age, we would have the prospect of making improvements. That's worth pursuing. At the same time, we must be careful to avoid reaching premature conclusions. Let the research work proceed.
News stories:
* Children's Genetic Potentials Are Subdued by Poverty. (Association for Psychological Science, January 31, 2011.)
* Being Poor Can Suppress Children's Genetic Potentials, Study Finds. (Science Daily, January 11, 2011.)
The article: Emergence of a Gene x Socioeconomic Status Interaction on Infant Mental Ability Between 10 Months and 2 Years. (E M Tucker-Drob et al, Psychological Science 22:125, January 2011.)
More on child development: Measuring development of humor in children (October 4, 2022).
More from the same journal (as the current post):
* What if there was a gorilla in the X-rays of your lungs? (July 26, 2013).
* How to talk to yourself (June 11, 2010).
Reversing Alzheimer's disease
March 4, 2011
A simple story... a simple genetic modification reverses the effects of Alzheimer's disease (AD) -- in a mouse model. Will it work in humans? We don't know. Still, it is an intriguing bit of work, one that will certainly be followed up.
As we have noted before, AD is associated with high levels of a peptide we call Aβ ("amyloid beta"). Somehow, Aβ causes neurodegeneration (loss of memory). It is likely that the active (toxic) form of Aβ is an oligomer: some complex containing several copies. In the mouse model of AD, the mice have been modified to have high levels of the Aβ peptide. These AD mice show some aspects of the disease as we know it in humans. It is important to emphasize that the mouse disease is not the same as the human disease; it is a model of certain aspects, and one part of the work is always to figure out which parts of the model are relevant and which are not.
The work led them to a nervous system protein, known to be involved in the formation of memories, called EphB2. The Aβ protein inhibited EphB2. There is a lot of detail behind this, but the point is that the evidence pointed to a problem with EphB2 -- and thus led them to ask "What if we increase the amount of EphB2?" Easy enough. Well, it's not easy, but it is something practical to do with mice: they genetically engineered the mice to "over-express" EphB2 -- to make more of it.
So what happened when they over-expressed EphB2? The behavior of the mice improved. In fact, they seemed pretty much normal. In fact, the mice seemed to be cured of their AD. A remarkable finding. Taken at face value, it would seem that EphB2 is the primary target of Aβ -- and that increasing its level solves the problem. There are various reasons to not claim things are so simple -- including the basic point that this is a mouse model. Nevertheless, this is a striking finding that will be followed up.
|
Here is a sample of the results, from Figure 5b of the paper.
Each frame shows the path taken by one mouse in a maze test, after a training period. The maze test is generally considered to be a test of learning and memory.
A quick glance shows that three of these mice did a good job of going to the target, whereas the one at the upper right did not. So, what are these mice? The two on the left are normal mice (NTG means non-transgenic). The two on the right had AD -- they had been given the gene for hAPP, the human Alzheimer precursor protein. The two on the bottom received the treatment with extra EphB2, whereas the two on the top received a sham treatment, labeled empty. Thus we see that the mouse that had trouble finding the target was the one with untreated AD. And we see that the mouse with AD that had been treated with extra EphB2 (lower right) behaved normally.
|
News story: Gene Therapy Prevents Memory Problems in Mice With Alzheimer's disease. (Science Daily, November 29, 2010.)
* News story accompanying the article: Alzheimer's disease: Recollection of lost memories. (R C Malenka & R Malinow, Nature 469:44, January 6, 2011.) A good overview of the work, and its implications. The final paragraphs discuss various cautions that we need to have about this work.
* The article: Reversing EphB2 depletion rescues cognitive functions in Alzheimer model. (M Cisse et al, Nature 469:47, January 6, 2011.)
Other posts about Alzheimer's disease include:
* Insulin as a treatment for Alzheimer's disease? (January 28, 2012).
* Alzheimer's disease may be delayed in people who are actively bilingual (March 1, 2011). Immediately below.
* The Alzheimer's disease peptide: Why does it accumulate? (January 22, 2011).
* GSAP -- a clue to treating Alzheimer's disease? (October 2, 2010). Both this post and the current post deal with possible treatments for AD. The GSAP post is about reducing the production of Aβ; the current post is about reducing its effect. We might say that one deals with the cause of the disease, whereas the other deals with a symptom. Both are valid approaches. It is also important that both posts present an increase in our understanding of the disease; with luck, that ultimately leads to treatment, but treatment can be a complex issue requiring understanding many parts of the disease.
* My page for Biotechnology in the News (BITN) -- Other topics includes a section on Alzheimer's disease. It includes a list of related Musings posts.
More on gene therapy: Gene therapy: Curing an animal using a ZFN (August 9, 2011).
March 2, 2011
Alzheimer's disease may be delayed in people who are actively bilingual
March 1, 2011
Both Alzheimer's disease (AD) and bilingualism have been discussed in Musings before. (Some links to a sampling of such posts are at the end of this post.) But it was a surprise when Borislav told me about a study combining these two topics.
The basis of the study is simple. They take a collection of AD patients, and collect background information about them. In particular, they classified the patients as monolingual or bilingual, and compared those two sets of patients.
|
The table at the right shows some of their results. The data here are a subset of more complete data shown in their data table (second page of the article).
|
Language group
|
Age at AD onset
|
Years of education
|
|---|
|
Monolingual
|
72.6
|
12.6
|
|
Bilingual
|
77.7
|
10.6
|
The key observation is that AD appeared at a later age in their bilingual patients, by about five years. This is a quite large delay.
Studies such as this must be interpreted with caution. The study basically shows a correlation, not causation. What is the real cause? As one example of ruling out a possible confounding variable, the table (above) shows that the effect is not simply due to educational background; in fact, the monolingual patients had more education. In their full table (in the paper), they also show that the effect is not simply due to having a higher status job. Again, the monolingual patients rated higher on that scale. (I do not know anything about that scale; they simply refer to a standard scale they used.) A confounding variable they cannot eliminate is immigration. Not surprisingly, there is a much higher frequency of immigrants in the bilingual group. Does this matter? There is no basis for answering that now, but they note the concern.
If the correlation shown here turns out to be significant, it fits with a pattern that activities that enhance brain use can delay AD. A goal is to define this better: what kind of use, or what parts of the brain?
News story: Being bilingual may delay Alzheimer's and boost brain power. (Guardian, February 18, 2011.)
The article: Delaying the onset of Alzheimer disease -- Bilingualism as a form of cognitive reserve. (F I M Craik et al, Neurology 75:1726, November 9, 2010.) Check Google Scholar, and you may find a freely available pdf. (Reference 7 of this paper addresses a similar question, including the immigration aspect; in fact, that work was stimulated by earlier work from the people who wrote the current paper. It, too, does not lead to a clear conclusion at this point, but those interested in following this story closely should check it.)
Other posts on AD include:
* Reversing Alzheimer's disease (March 4, 2011). Immediately above.
* Is Alzheimer's disease transmissible? (February 4, 2011).
My page for Biotechnology in the News (BITN) -- Other topics includes a section on Alzheimer's disease. It includes a list of related Musings posts.
Several posts on bilingualism have been consolidated onto the page: Musings: Bilingual.
Dengue fever: an overview
February 28, 2011
Dengue fever is a viral disease that is transmitted by certain mosquitoes. An unusual feature of dengue fever is that the second case a person gets may be much worse than the first case, because of an unusual immune reaction. Musings noted this feature of dengue fever in the post Dengue fever -- Two strikes and you're out (August 10, 2010).
Dengue fever is not well known in the United States. However, Americans should be aware of it. The disease is found in the warmer regions (Puerto Rico, Florida, Hawaii), and occurs sporadically in other places. If the country warms and mosquitoes spread, dengue could become a bigger problem.
The purpose of this post is to note a recent article that is simply a good general overview of dengue. It is worth a browse. Dengue fever is expanding globally. (M Cimons, Microbe 5:515, December 2010.) This article is no longer available; I do not find any alternative source.
More about dengue:
* Dengue vaccine follow-up: Phase 3 trial (September 15, 2014).
* A new type of dengue virus (October 27, 2013).
* A dengue vaccine trial (December 1, 2012).
Robots should learn to crawl first, then walk
February 27, 2011
That's the way we do it, so why shouldn't robots do it that way, too? There is a whole class of robots that learn from their experiences, but typically their body remains fixed. Would they learn better if they started with simpler bodies?
That's the essence of the question asked by "roboticist" Josh Bongard at the University of Vermont. Computer simulations showed that robots with an evolving body did indeed do better. Preliminary experimental work supports that.
An interesting aspect of the work is the interplay between biological thinking and engineering thinking. In this case, thinking about biology offered some guidance about robot design -- not answers, but rather questions to ask. An interesting question is whether we learn some biology from the work here with robots -- simulated or live.
News stories:
* For Robust Robots, Let Them Be Babies First. (University of Vermont, January 20, 2011.) This is from the author's university, and may be basically a press release. It is a quite good presentation of the ideas, and may be a good place to start.
* Metamorphosis key to creating stable walking robots. (New Scientist, January 10, 2011.) A short but useful overview of the work; includes the overview video.
Video. There is an "overview" video, which is included with some news stories, and is available separately at YouTube. This contains a narration that helps some with making sense of what is being shown. Overview video, at YouTube. More videos with the paper, below.
The article: Morphological change in machines accelerates the evolution of robust behavior. (J Bongard, PNAS 108:1234, January 25, 2011.) The paper itself is very dense, with complex and unclear figures; it is probably difficult reading for all but the robot connoisseurs. There are some videos to accompany the paper. Unfortunately, they, too, are rather confusing -- partly because the time compression is inconsistent and unclear. But they are cute. If you want to try these, it may be best to start with the "Supporting information" pdf, posted along with the article at the journal site; it describes and links to the videos.
For more about designing things inspired in part by looking at biology, see my section for Biotechnology in the News (BITN) on Bio-inspiration (biomimetics).
Another Musings post on bio-inspiration: Why don't woodpeckers get headaches? Designing better shock absorbers (April 18, 2011).
A recent post on robots: Robot uses coffee as a picker-upper (December 17, 2010).
For more on walking...
What is it? (March 8, 2011).
Are girls too clean?
February 26, 2011
The importance of microbes to humans is being increasingly explored. Vast numbers of microbes are in our bodies, especially in the gut. They are part of us. They affect us -- for better or worse. Numerous Musings posts have dealt with aspects of this complex relationship. Most recently, we have seen an analysis suggesting that childhood infections are detrimental to brain development: Are childhood infections bad for brain development? (February 5, 2011). That post links to others, including some that show a benefit of our microbes to us.
One direction that work on our microbes has taken is reflected in what is called the hygiene hypothesis. Briefly, this makes a connection between cleanliness and immune disorders such as asthma. The general idea is that exposure to infections at an early age is the norm for humans, and proper development of our immune system depends on it. If we are too clean in childhood, as might be typical of more modern society, then our immune system becomes hyper-sensitive, leading to various auto-immune diseases. The hypothesis is talked about a lot; it has supporters and detractors, and should still be taken as a hypothesis. One particular question about the hygiene hypothesis is whether it refers to specific organisms, which might have specific effects on the development of our immune system, or whether it involves "infection in general".
And now? Sharyn Clough, a philosopher at Oregon State University, reviews the available information, and suggests that the higher incidence of some auto-immune diseases among girls reflects that girls tend to be cleaner. Her purpose is to stimulate more careful examination of her suggestion. The news story below is a good overview. The paper itself has lots of information.
As you read over these materials, keep two ideas in mind... One is the basic hygiene hypothesis, and the second is that the hygiene hypothesis might play out differently for boys and girls, for cultural reasons. Think about what kind of evidence you would like to see to support (or to disprove) either of these, and what the implications might be. I think you will find this to be a fascinating and provocative story, especially if the hygiene hypothesis is new to you. It is also an incomplete story; it raises questions and points to the insufficiencies of current answers, but it does not supply final answers.
News stories:
* Gender and Hygiene: Could Cleanliness Be Hurting Girls? (Science Daily, January 27, 2011.)
* Why Keeping Little Girls Squeaky Clean Could Make Them Sick. (an NPR blog, February 3, 2011). The main point of including this item is that it features a picture of a child in a moment of extreme non-hygienic behavior. According to the legend, the child is a girl.
The article, via the abstract at PubMed: Gender and the hygiene hypothesis. (S Clough, Social Science & Medicine 72:486, January 2011.) "I argue that, insofar as the hygiene hypothesis successfully identifies standards of hygiene and sanitation as mediators of immune health, then, properly augmented by feminist analyses of the gendered standards of cleanliness in children, the hypothesis can account for the unexplained variation in the relevant morbidity rates between men and women." [p 487]
Also see:
* Are lab mice too clean to be good models for human immunology? (May 21, 2016).
* How intestinal worms benefit the host immune system (February 27, 2016).
* Reducing asthma: Should the child have a pet, perhaps a cow? (November 28, 2015).
* Is Helicobacter pylori good for you or bad? (April 10, 2012).
Cellulose: improved processing
February 25, 2011
A recent post noted that the development of cellulose for making biofuels is progressing slowly. [Cellulosics for energy: an update (October 30, 2010).] Of course, work is proceeding. This post briefly notes two recent papers that report progress. Each of them is scientifically interesting, and does represent some progress toward understanding and improving cellulose production. It will take many such steps to develop a process that is economically practical.
Paper #1 is probably simpler to understand. If we think of cellulose as a long polymer of glucose residues, we might write it as (Glc)n; Glc is a standard abbreviation for glucose, and n is simply a large number. Complete breakdown of cellulose might be thought of as (Glc)n → n Glc; that is, a chain of n glucose residues is converted to n glucose molecules. However, common methods of breaking down cellulose give small chains of glucose, such as (Glc)2 or (Glc)3. What they did in the new work was to genetically modify the yeast so that they could use these short glucose chains. Once the yeast have been modified, one no longer needs to add extra enzymes to do those steps; further the short chains tend to inhibit cellulose breakdown, so getting the yeast to remove them improves the rate of cellulose digestion.
|
Here is an example of their results, from Figure 2C of paper #1.
The graph shows the concentration of ethanol vs time for two fermentations. Growth was on cellulose, with cellulase enzyme added to break it down. The two fermentations differ in that one used a yeast strain that had been engineered to take up and use the short glucose chains.
The upper curve (solid dots), is for the engineered strain. You can see that it makes ethanol faster, and makes more of it.
The results show that the engineered strain is improved "as advertised". What they do not show here is that the improvement is of economic benefit compared to other ways of solving the problem.
|
The short glucose chain (Glc)2, connected as in cellulose, is known as cellobiose. Similarly, (Glc)3 is cellotriose -- and so forth. Collectively, such short chains are called cellodextrins.
Paper #2 is more mysterious -- but interesting. Bottom line, they have a new enzyme that stimulates cellulose digestion. Well, even that is not quite right. In this work, they are not studying cellulose at all, but rather chitin. Chitin -- the structural material of lobster shells -- is chemically and structurally similar to cellulose, so there may be a connection. And they say that other groups have evidence for a similar helper enzyme with cellulose. What does this new enzyme do? They suggest that it has two features: it binds very tightly, and it produces unusual ends when it breaks down the chitin. Both features may help to open up the material for further digestion. It's not very clear -- but they do show that this new enzyme, however it works, does help.
News stories:
* #1 Researchers Expand Yeast's Sugary Diet to Include Plant Fiber. (Science Daily, September 10, 2010.)
* #2 Researchers Identify Enzyme That Breaks Down Chitin; May Lead to Cheaper Biofuels. (Green Car Congress, October 14, 2010.)
The articles:
* #1: Cellodextrin Transport in Yeast for Improved Biofuel Production. (J M Galazka et al, Science 330:84, October 1, 2010.)
* #2: An Oxidative Enzyme Boosting the Enzymatic Conversion of Recalcitrant Polysaccharides. (G Vaaje-Kolstad et al, Science 330:219, October 8, 2010.)
Engineering E coli bacteria to convert cellulose to biofuel (December 13, 2011). A milestone. Not an economic process, but an interesting technical achievement.
A recent post on another approach to development of alternative energy: A Christmas present: Using concentrated sunlight to split water and CO2 (February 18, 2011).
More about chitin, and its derivative, chitosan: Some shrimp in your wine? (August 27, 2016).
February 23, 2011
In what year was the word "slavery" most used in books?
February 23, 2011
As you can see from the graph at the right, the answer is about 1860 -- when the word appeared in books at a frequency of nearly 1x10⁻⁴, or one in every ten thousand words.
You can also see that, following a long period of decline in the usage of the word "slavery", there was a significant up-tick around 1970.
(The vertical colored stripes mark the US Civil War and the civil rights movement.)
|
|
So what? You don't care? Or maybe you hadn't even thought of asking when the usage of the word "slavery" in books peaked? Now we are getting to the point. If you had thought of asking, there would not have been much you could do about it. Now, there is something you can do -- for the word "slavery" or any other word (or short phrase) that interests you.
A local (San Francisco area) company has embarked on a project to digitize the world's books. Not just page images, but converted to words, using optical character recognition. That gives us a computer full of words, with the dates they were written. Then all we need to do is to search that database for the word slavery, and note the date of each instance. Thus we witness the birth of a new way to study human history -- culturomics.
The paper is actually fun to look over. (This may be a case where the paper itself is actually more fun than the stories about it.) They describe what they did, and give numerous examples of things they found in their database; the slavery item is their first example. If you don't like their examples, go to their database and try your own. Yes, indeed; the first page of the article tells you where it is.
News story: Using Digitized Books as 'Cultural Genome,' Researchers Unveil Quantitative Approach to Humanities. (Science Daily, December 18, 2010.)
* News story accompanying the article: Digital data: Google Books, Wikipedia, and the Future of Culturomics. (J Bohannon, Science 331:135, January 14, 2011.) Among other things, this discusses (and links to) the Science Hall of Fame (SHoF), a ranking of scientists by how many times each name appears in the books. The discussion on the SHoF page emphasizes the limitations of the analysis at this point; it is a good example of learning how to use the database.
* The article: Quantitative Analysis of Culture Using Millions of Digitized Books. (J-B Michel et al, Science 331:176, January 14, 2011.) (Check Google Scholar for a pdf copy.) Worth at least a browse!
The database used here consisted of 5,195,769 books, from 1800-2000. They claim that the set is about 4% of all the books ever published. Is there a bias? They don't really talk about this much, but I presume there may well be biases, from their book sources. Harping too much on that would miss the big point here, but do keep it in mind if you do any serious work with their data.
This is not the first time that the company involved here has claimed that their computers contain useful information. See the post Google tracks the flu (April 30, 2009).
* Also see its follow-up: Google tracks the flu -- follow-up (April 11, 2014).
Previous post on slavery: Slavery (January 22, 2010).
More on cultural analysis: Cultural evolution: How a common folk tale takes on local characteristics (May 11, 2013).
Previous post on sushi: Sushi, seaweed, and the bacteria in the gut of the Japanese (4/20/10).
More, July 10, 2011...
Computer scientist Brian Hayes has written an essay on this for his regular column in American Scientist. I probably don't read much written by computer scientists, but I generally enjoy Hayes's essays, and this one is no exception. Recommended, for an enjoyable perspective on culturomics. Computing Science: Bit Lit. (B Hayes, American Scientist 99:190, May 2011.) Freely available copy.
More from Brian Hayes: Pi (November 10, 2014).
A book by Hayes, listed on my page Books: Suggestions for general science reading... Hayes, Foolproof -- and other mathematical meditations, 2017. The book includes 13 such essays.
Jumping -- flea-style
February 21, 2011
John tells us that Cambridge University scientists have reported progress on a major problem in modern physics. As so often, technical advances were a key part of making progress. In this case, a key development was learning how to get fleas to jump at the will of the experimenter -- so they could be filmed.
The flea jump is a remarkable event. The tiny flea, 2 millimeters long and weighing less than a milligram, jumps several centimeters -- perhaps 10-100 times its body length. It does so very quickly, with an acceleration of over 100 G (that is, more than 100 times gravity). It became clear some time ago that the flea jump is based on releasing a spring -- a protein molecule known as resilin. But the spring is in the thorax (the main body). How does the flea exert the spring force against the ground? More specifically, does the flea bounce off using its tarsus ("foot") or its trochanter ("knee")?
If you think the answer to that is obvious enough... You can form a hypothesis if you wish, but we need to test it. I would also suggest that if you think this is obvious, it means you have not looked at the details of a flea body in a while. In fact, flea experts have proposed both answers -- each with some evidence in support.
Now, a definitive experiment. High speed photography reveals the details of a flea jump. As a result, they make several arguments that the flea presses off from its tarsus, not its trochanter. Among their arguments... Careful study of the films shows that in some jumps the trochanter does not touch ground -- and yet these jumps appear quite normal. Further, mathematical modeling of the force transmission shows that the jump details can be explained by a tarsus-based jump, but not by a trochanter-based jump.
|
An example of the evidence is shown at the right; this is Figure 4B of the paper. From their figure legend (modified slightly, to focus on this one frame -- and to correct a grammatical error in their version): Image captured at 5000 frames s-1 during natural jumping and at the moment when their hindlegs first began to move to propel a jump. The thick vertical magenta bar shows that the trochanter was not in contact with the ground. The hind tarsus (magenta arrow) was in contact with the ground. The positions of the segments of the hindlegs are indicated by thin yellow lines.
|
|
News stories:
* Flea's jumping ability explained. (BBC, February 10, 2011.) Includes movies.
* Mystery of How Fleas Jump Resolved After 44 Years. (Science Daily, February 10, 2011.)
* News story accompanying the article: Mystery of flea jump resolved: tarsus push off. (Y Hager, Journal of Experimental Biology 214(5):i, March 2011.)
* The article: Biomechanics of jumping in the flea. (G P Sutton & M Burrows, Journal of Experimental Biology 214:836, March 2011.) There are two movie files here; choose "Supplementary Material". Each shows one flea jump: they differ in that one may involve the trochanter, whereas one clearly does not; the two jumps are essentially the same. (I suggest you start with #2; #1 has several seconds of inaction at the start.)
The fleas used in the work were provided by the St Tiggywinkles Wildlife Hospital Trust. Those who do not remember who St Tiggywinkles was should check Wikipedia.
More fleas: Bacteria found in rectum of old flea (October 16, 2015).
More about jumping insects:
* Chronic pain in flies? (October 6, 2019).
* Quiz: What are they? (September 27, 2013). This work is from the same people as the current work.
More about jumping: Why the spider needs green light to find its food (March 3, 2012).
More about knees: Using your nose to fix knee damage (January 28, 2017).
Also see: Human-wildlife conflict -- what is the proper way to get rid of a pest? (July 12, 2017).
Dust
February 19, 2011
Dust is important. We may find it a nuisance, at the personal level. However, dust in the atmosphere affects the weather, as it adsorbs or reflects energy. Further, dust contains minerals, and the global movement of dust provides a transfer of nutrients from one place to another. For example, large amounts of the critical nutrient iron are transported by dust clouds.
One source of dust is "desert". Such dust varies. Why? One possibility is that dust varies depending on rainfall: wet soil prevents surface soil from being transported by wind. But beyond that? Do human activities affect dust?
The new work looks at long term dust records from the Sahel region of the Sahara Desert -- one of the largest dust sources on earth. Their analysis shows that dust levels correlate with rainfall up to about the 18th century. After that? Much more dust. Why? Well, it correlates with the introduction of agriculture in the area. Does that mean that the human activity of agriculture increases dust? That's their suggestion. It will be interesting to see how the suggestion is received.
|
The graph shows the key findings, from Figure 3 of the paper.
Both axes are rather complicated, but we can simplify them. The y-axis is about the amount of dust for the year. The x-axis is about rainfall: note the labels "wet" and "dry".
Now, look at the points on the graph. Most of them fall into a broad region near the bottom -- which they bracket and label "600 BC to 1700 AD". During this time there is a general trend: more dust in dry years. Then there are three points above those, each with a date. Each century is showing more and more dust. The 1700s may be almost "normal", but certainly the 1800s and 1900s show much more dust than expected from the main part of the graph.
This graph is the heart of their argument; it is data. Dust has increased dramatically since about 1800. The idea that it reflects agriculture is one interpretation of the result; let's wait and see what others think of it.
|
News story: Modern agriculture a major control of increased rates of dust flux from continent to ocean. (Wired, July 14, 2010.)
The article: Increase in African dust flux at the onset of commercial agriculture in the Sahel region. (S Mulitza et al, Nature 466:226, July 8, 2010.)
Musings posts about dust...
* What happened to the Neandertals? (October 8, 2010). Volcanoes are another source of dust. Although such dust affects both solar radiation to the earth and re-radiation from the earth, the net effect is cooling. This post suggests that an extreme burst of volcanic activity might have caused such major climate change as to be a factor in the extinction of the Neandertals.
* Geoengineering: a sunscreen for the earth? (February 20, 2010). If atmospheric dust can cool the earth, it was inevitable that someone would suggest that we intentionally add dust to the atmosphere in order to combat global warming. It's controversial, but the idea remains on the table as one geoengineering approach.
This post has nothing to do with the post on smart dust: Smart dust: A central nervous system for the earth (July 20, 2010). This is about ordinary dust; perhaps we could say dumb dust.
More from the Sahel: Wind-borne mosquitoes repopulate the Sahel semi-desert after the dry season (October 14, 2019).
I started to write this item some months ago, actually alongside the "Smart dust" post. Somehow, it got set aside. Recently, the topic of dust came up in a private discussion. We went back to this post and decided it was worth finishing up. This is an example of how readers affect the selection of topics.
A Christmas present: Using concentrated sunlight to split water and CO2
February 18, 2011
In the Christmas Eve issue of Science, Caltech engineering professor Sossina Haile and her colleagues published an intriguing way to use solar energy. And it starts with a little trick most of us have done at home: concentrating sunlight with a lens.
In fact, the process they describe involves several steps, all of which are well known. What they do is to combine them into an integrated process. Based on preliminary results, they suggest that it might be a practical process for using solar energy.
As noted, the first step is to concentrate solar energy. Thus the sun becomes a concentrated heat source. They use the heat to heat up a piece of ceria. Ceria is a well known ceramic-type material; chemically, it is CeO2, or cerium(IV) oxide. They heat the ceria enough to partially decompose it, driving a bit of the oxygen out of the crystal lattice. The CeO2 becomes CeO2-δ, where the "2-δ" indicates that a bit of the oxygen is gone.
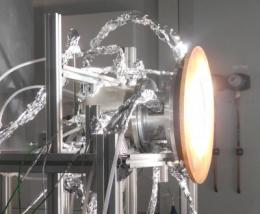
|
The picture at the left shows the lab-scale reactor. This is from the news story listed below. Figure 1 of the paper includes a well-labeled diagram of the reactor.
|
Since it takes an extremely high temperature to remove some of the oxygen from the ceria, it should not be surprising that the resulting oxygen-depleted ceria has a very strong affinity for oxygen when it is cooled -- so strong that it takes oxygen from water or carbon dioxide. So, they pass streams of these gases over the cooled oxygen-depleted ceria, and oxygen is transferred from the gas to the ceria. Upon losing O, the H2O becomes H2; the CO2 becomes CO. Both of the products are useful materials, as fuels or chemical feedstocks. The ceria, now back to CeO2, is re-used. That is, the reactor is cycled between high and low temperature. The high T drives some O out of the ceria, thus activating it; at lower T, the activated ceria converts the input gases to useful materials. The overall effect is that the solar energy is used to convert water and carbon dioxide to useful materials.
Is this a good idea? Is this really a process that will be practical for commercial use? That's hard to know. Ultimately, a commercial process will be judged by its economics. The work here is lab-scale. All we can say here is that this is an interesting idea, worth pursuing. It will compete with alternatives being developed.
News story: New reactor paves the way for efficiently producing fuel from sunlight. (PhysOrg, January 19, 2011.)
The article: High-Flux Solar-Driven Thermochemical Dissociation of CO2 and H2O Using Nonstoichiometric Ceria. (W C Chueh et al, Science 330:1797, December 24, 2010.)
Other posts on energy issues include:
* Making electricity in your windows: sharing the solar spectrum (July 5, 2011).
* Cellulose: improved processing (February 25, 2011).
* Planning (November 23, 2010).
* Cellulosics for energy: an update (October 30, 2010).
* Engineering cyanobacteria to make high-value chemicals (September 21, 2010).
More cerium oxide: Low temperature treatment for auto exhaust? (February 18, 2018).
There is more about energy on my page Internet Resources for Organic and Biochemistry under Energy resources. It includes a list of some related Musings posts.
This post is listed on my page Introductory Chemistry Internet resources in the section Lanthanoids and actinoids.
More Christmas posts: More resin for Christmas through better use of Boswellia (December 17, 2012).
February 16, 2011
Farming by amoebae
February 15, 2011
We know about farming carried out by mankind -- and we know of farming by ants and some other insects. Now, biologists at Rice University (where I used to be on the faculty) claim to have uncovered the simplest known agricultural system -- and the smallest farmers.
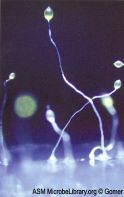
|
The smallest farmers? The photo is about 3 millimeters high. (The particular strain shown here may or may not be a farmer.)
This photo is reduced from one that had been posted by Richard Gomer, of Rice University, in the Microbe Library of the American Society for Microbiology.
|
Dictyostelium discoideum (or "Dicty" among friends) is a tiny organism, now commonly called a social amoeba; it is also called a cellular slime mold. In good times, Dicty lives as single-celled amoebae, eating bacteria. When food becomes scarce, the cells come together to form a multicellular "slug", which differentiates into multiple cell types. This leads to the production of spores -- and to dispersal of the organism. Thus the cellular slime molds have characteristics both of unicellular and multicellular organisms.
So, how does farming enter the picture? The new finding is that some strains of Dicty don't eat all the bacteria in the environment. Instead, when the food begins to be scarce, they start hoarding it -- and they put the bacteria in the spores. This gives an advantage to the spores if they arrive in an area where the food is poor -- but may be a disadvantage (just a cost) if the spores arrive in a food-rich area.
The figure at the right shows some of the evidence for Dicty farming. (This is Figure 1b of the paper listed below.)
The figure shows the contents of the sorus for two Dicty strains. The sorus, or spore sac, is the round structure seen at the top of each stalk in the top figure. The scale bar here is 5 micrometers.
Both sori contain Dicty spores -- as would be expected. The sorus of the farming strain also contains bacteria. It is an important part of their findings that having or not-having bacteria in the sori is a reproducible characteristic of each strain.
|
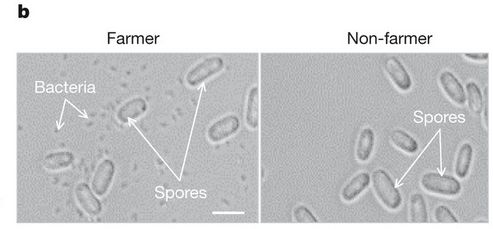
|
Is this really "farming"? Well, the purpose of using the term is to draw comparisons. So the response should be to analyze the situation, looking for similarities and differences -- thus increasing our understanding. The term itself is beside the point.
It's a delightful story, well presented in all the readings listed below.
News story: Like Humans, Amoebae Pack a Lunch Before They Travel. (Science Daily, January 20, 2011.)
* News story accompanying the article: Evolutionary biology: Farming writ small. (J J Boomsma, Nature 469:308, January 20, 2011.)
* The article: Primitive agriculture in a social amoeba. (D A Brock et al, Nature 469:393, January 20, 2011.)
For a delightful book about the social amoebae, see John Tyler Bonner, The Social Amoebae -- The biology of cellular slime molds on my page Books: Suggestions for general science reading. Bonner was one of the pioneers of work on these organisms. The book is something of a memoir, as well as a wonderful overview of the organisms -- from an old-school biologist who loves the organisms themselves, not just genes.
More about amoebae... The largest known virus (August 5, 2013).
More about farming: The case of the missing incisors: what does it mean? (September 13, 2013).
More about lunch: Astronomers identify source of peryton signals received by radio telescopes: it is the microwave oven in the observatory kitchen (April 24, 2015).
A post about a quite different kind of "slime mold": How slime molds learn (June 11, 2019).
FDA to fast-track prosthetic arm
February 14, 2011
The (US) Food and Drug Administration (FDA) is charged with approving drugs and medical devices, assuring that marketed products are safe and effective. However, neither "safe" nor "effective" are entirely objective criteria. Thus the FDA -- and any such regulatory agency -- must strike a balance between careful consideration, to protect the public, and expeditiously providing beneficial products to the public. Needless to say, many feel they do not always get that balance right.
The FDA has announced a new program to expedite review when the need for a device is considered extremely high. The specific example at the moment is prosthetic limbs.
The story for now is this regulatory plan. Both of the following readings are primarily about the FDA plans for expedited review. There is little here on the scientific content.
FDA announcement: FDA launches Medical Device Innovation Initiative -- DARPA-funded prosthetic is first test case. (FDA, February 8, 2011. Now archived.)
FDA document -- with more detail (and bureaucratic language) than most will want: Medical Device Innovation Initiative White Paper -- CDRH Innovation Initiative. (FDA, February 2011. Now archived.) CDRH = Center for Devices and Radiological Health.
There are follow-up posts:
* FDA to fast-track prosthetic arm -- Follow-up #2: approval (June 9, 2014).
* FDA to fast-track prosthetic arm -- Follow-up: videos (April 2, 2011).
Some related Musings posts...
* Prosthetic arms (September 16, 2009). This post notes work done by DARPA; their device is the one currently under FDA review, though it is now further developed. The post links to other posts with other developments regarding prosthetic devices.
* A different example of FDA developments: Restricting excessive use of antibiotics on the farm (September 25, 2010).
* Development of food regulations by another agency -- the USDA: Killer chickens -- follow-up: some progress (June 7, 2010). And if you are wondering why the FDA regulates some things and the USDA regulates other things... Right, good question. There is no great logic to it. As so often in the world of government, what we have is the result of piecemeal changes, not a well thought out plan. The fragmentation of regulatory oversight is considered a major weakness of the US system.
Also see my page of Biotechnology in the News (BITN) for Cloning and stem cells. It includes an extensive list of Musings posts in the fields of stem cells and regeneration -- and, more broadly, replacement body parts.
A new approach to making large molecules, using a Vernier process
February 12, 2011
Sometimes the idea for a Musings post starts with a figure; the question is then whether we can build a good story around a figure that catches attention. Here the figure shows some chemistry -- and it is a striking figure. Further, there is a good story, partly because the authors do a good job of explaining their chemistry in a non-technical way.
This story is best told with some fairly large pictures; even the figure above gets better at full size. So the rest of this post is on a supplementary page: A new approach to making large molecules, using a Vernier process.
A post about a related chemical, from the same lab: Hückel at 40 -- that's n = 40: the largest known aromatic ring (February 1, 2020).
Did Lucy butcher a cow?
February 11, 2011
Big controversy here. We will not provide an answer; the point here is to present the issue.
The figure at right is a photo of a fossilized bone, probably from a cow or something of that size. Near the upper left are two parallel "grooves" -- labeled "Mark A1 and A2." See them? (The arrow points directly to one; the other is just a bit to the left.) Those two marks are the subject of the controversy.
What's the question? One group claims that the marks were made by a "human" (or, rather, a pre-human: a member of our ancestral line) while killing the animal -- butchering the animal with a sharp piece of stone. Another group says, no, such marks were made by other processes, including simply trampling on the bones.
And why does anyone care? Why are these marks so controversial? Because the bone may well be about 3.2 million years old -- from about the time of the famous hominid Lucy. If indeed the marks are due to use of tools by a "human", it would be the earliest known use of tools in the human lineage -- by 800,000 years!
|
|
The readings below are extensive! That is partly because it is a double story -- two conflicting sides. In general, I do not assume that most Musings readers read the linked materials in detail. If you look over the news stories, good. And if you do want more, it's there; at least you know that there is a serious scientific publication behind the post and news stories (in most cases). This post is a good place to reiterate that. The papers are highly technical -- and the authors are in a hot dispute. If these people -- experts in the field -- don't agree on what the findings mean, how could we be expected to make a judgment? In fact, my purpose with this post is to present a controversy; good controversy is an important part of science. So, as always, I encourage you to look over the news stories. Perhaps Pat Shipman's essay (last item listed) would be a good place to start. I hope you find the question interesting, but beyond that the big message is the controversy.
The original paper
News story: Scientists discover oldest evidence of stone tool use and meat-eating among human ancestors. (PhysOrg, August 11, 2010.)
* News story accompanying the article: Palaeoanthropology: Australopithecine butchers. (D R Braun et al, Nature 466:828, August 12, 2010.)
* The article: Evidence for stone-tool-assisted consumption of animal tissues before 3.39 million years ago at Dikika, Ethiopia. (S P McPherron et al, Nature 466:857, August 12, 2010.)
The challenge
News stories:
* Anthropologist challenges Lucy's butchery tool use. (PhysOrg, November 16, 2010.)
* Battle erupts over claims for ancient butchery. (Blog, Scientific American, November 17, 2010.)
The article: Configurational approach to identifying the earliest hominin butchers. (M Dominguez-Rodrigo et al, PNAS 107:20929, December 7, 2010.)
Another article on this is an essay by Pat Shipman. It addresses the original claim, and broadly deals with some of its strengths and weaknesses. It is more philosophical than technical, dealing with the issue of how strong a case one should have before publishing. It's quite readable, provides some of the substance along with several nice pictures, and overall is balanced and non-judgmental. The cutting edge. (P Shipman, American Scientist 98:462, November, 2010. Now archived.) (Shipman's essay does not directly address the Dominguez-Rodrigo paper listed above; they were probably written at about the same time. What Shipman does is to address the general issues of the original claim and some range of criticisms that had been voiced.)
More on human ancestry:
* An interesting skull, and a re-think of ancient human variation (November 12, 2013).
* The Siberian finger: a new human species? -- A follow-up in the story of Denisovan man (January 14, 2011).
More about the history of meat-eating... Sliced meat: implications for size of human mouth and brain? (March 23, 2016).
More on stone tools: Do monkeys make stone tools? (December 18, 2016).
More about cows... Reducing asthma: Should the child have a pet, perhaps a cow? (November 28, 2015).
February 9, 2011
Caterpillars that whistle
February 8, 2011
It's actually been known for a long time that some caterpillars make sounds. How and why has not been clear. New work sheds some light on how and why one type of caterpillar sounds off.
The "how" is rather unusual. When the caterpillar is startled, its head jerks back. This compresses the air behind it, which then leaks out through holes in the body. That's the source of the sound: air being squeezed out of the body. One test of this was to cover the holes; that prevented the sound.
The "why" seems fairly straightforward. The sound can startle and scare off predators. This is shown in the second movie; see below.
There are two movies available. Movie 1 shows the response of the caterpillar to being "attacked" with forceps. Listen! (The caterpillar? That's it; the thing being attacked. Well camouflaged, isn't it?) Movie 2 shows what happens with birds. In this case, the caterpillar is not shown, but you can hear it.
News story: Blow It Out Your Sides: Caterpillars Can Whistle. (Live Science, December 10, 2010.) Movie 1 is included here (but not Movie 2).
* News story accompanying the article: Whistling Caterpillars Startle Birds. (K Knight, Journal of Experimental Biology 214:ii, January 2011.)
* The article: Whistling in caterpillars (Amorpha juglandis, Bombycoidea): sound-producing mechanism and function. (V L Bura et al, Journal of Experimental Biology 214:30, January 2011.) Both movies are available under "Supplementary material".
More about caterpillars: Studying predation around the world: What can you do with 2,879 fake caterpillars? (July 28, 2017).
What is it?
February 7, 2011
Other "What is it?" features include...
* Next: What is it? (March 8, 2011).
* Previous: What is it? (December 28, 2010).
Related... Mayhem at the center of the Milky Way (August 23, 2011).
What do you think will be the most important technology of the next 30 years?
February 7, 2011
Here's a chance for you to think about our future -- and maybe even win a prize.
Borislav sends a page announcing a contest: Which technology do you think will have the biggest impact on human life in the next 30 years? (New Scientist, in collaboration with Statoil and the Royal Academy of Engineering.) This is now an archived page.
The main purpose of noting this in Musings is to promote thinking about an interesting topic.
If you are interested in submitting an entry...
* Be sure to read the rules, both about the content and the administrative rules such as privacy.
* The contest topic is engineering, and the time span is three decades.
* Contest deadline is March 1, 2011.
* The web site says that the contest is for EU residents. It is not clear how this is enforced. It may be that anyone can submit ideas, but only EU people can officially win.
* This is about promotion as well as being a legitimate contest. By default, they will use the e-mail address you use with your submission to send you advertising. Check the boxes on the entry form to restrict this, as you wish. Read the privacy rules.
Entries are posted at the site; click on "Entries".
I won't post any discussions here unless you give me explicit permission. But just as a starter (and I do not plan to submit anything)... Think about the problems we have. How many of them would be ameliorated if the human population were, say, half of what it is now? Would it be good if a major goal were to achieve some such population reduction? How could this be done -- fairly? What about the side effects, in terms of altered age distribution of the population during the transition?
Are childhood infections bad for brain development?
February 5, 2011
Upfront... this post deals with some controversial material -- about human intelligence. I'll start by presenting what the authors suggest, then discuss the controversy towards the end.
Let's just jump in. Here is the key result (Figure 1a of the paper)...
|
The graph shows average IQ vs a measure of infectious disease for 184 countries.
The key point is that there is a good correlation between these two measures. (The correlation coefficient is r = -0.82, with p <0.0001.) More infectious disease correlates with lower IQ.
A similar result was reached within most geographical regions tested (roughly, continents).
Both data sets are publicly available, from work of others. The infection measure they use here is disability-adjusted life years lost (DALY) from a selected list of infectious diseases, as reported by the World Health Organization (WHO). We'll discuss the IQ data below.
|
Why is this interesting, and why is it controversial?
Let's explicitly address the issue of correlation vs causation. The graph above shows a correlation. For the sake of discussion, let's assume that the correlation is valid. It is an important general point that correlation does not imply causation. That is, the graph does not say that one causes the other. However, the authors do suggest that there is a causal relation: that infectious diseases cause (contribute to) low IQ.
What type of causal connection might one suggest between infection and intelligence? The development of the human brain is extremely energy intensive. Thus the authors suggest that the burden of infection, especially during early childhood when brain development is maximal, may have its greatest impact on the brain. This seems "logical". But again we must emphasize that proposing something logical does not mean it is correct. For now, this is a hypothesis, which remains to be tested.
In fact, that is a key reason why the work is interesting. It's interesting precisely because it is testable: it suggests a way to improve "intelligence" (leaving aside for now exactly what that means, and just taking it as some measure of good brain function). And that way is something we think is good: reducing infection. The results here suggest that as health in an area improves (and infection declines), we should see improvements in intelligence.
The problem? As noted earlier, much research on human intelligence raises concerns, and the meaning of IQ tests is certainly open. We can set aside the question of what test scores mean for here. But the work uses a data set of IQ for 184 nations that has aroused much concern. For example, nearly half of the values in the data set are not based on any measurement at all, but are "estimates" -- made by a questionable procedure. However, we can dismiss that concern here. In the new work, they did a separate analysis, excluding the estimated IQ values -- and got exactly the same trend (even exactly the same r value). More importantly, I think... The earlier work using this IQ data set seemed to be mainly presenting a characterization of the countries involved: smart countries and dumb countries, to put it bluntly -- and based on questionable data. The new work is not so much about reaching a conclusion as it is about making a hypothesis: an interesting and plausible hypothesis, which is testable. It's not about putting labels on people, but about suggesting an improvement. As noted, the trend observed here applies not only to the world as a whole, but to continents. Presumably it applies to regions within a country. The hypothesis suggests that improving health in a small region may lead to noticeable improvements in "intelligence".
There is another reason why the new work may raise some concern: what if infection is good for us? We have noted this possibility before. For example, the following post was about a role for our gut bacteria in the proper functioning of the immune system: Is Arthromitus a key bug in your gut? (January 16, 2010). The role of our gut microbiota is complex. What we know for sure is that we have a gut microbiota -- a complex gut microbiota. It is part of our normal biology. It is quite possible that infection has both "good" and "bad" effects. In some cases, we may be able to sort out specific organisms and specific effects, and control them. But perhaps we won't. Perhaps in some cases the same microbe will cause effects that we might consider good and bad. Such is nature -- and at this point we are just beginning to uncover the story. Stay tuned.
Overall, there is much here to think about. We need to think about the quality of their data, hence the quality of the correlation. Further -- and separately -- we think about the proposed causal relationship. It is possible, for example, that the correlation is correct, but that the proposed causation is not. An important aspect of this is that the proposal is testable. Thus we do not need to accept or reject this work, but rather to test it further. And of course, whatever is going on here, we need to consider it within the broader topic of the complete story of development of the human organism, including its resident microbiota.
Two news stories:
* Study links low national average IQs with infectious diseases. (Medical Xpress, July 1, 2010.)
* Infection plagues IQ. (R P Grant, The Scientist, November 2010, p 22.)
The article, which is freely available: Parasite prevalence and the worldwide distribution of cognitive ability. (C Eppig et al, Proc. R. Soc. B 277:3801, December 22, 2010.)
Also see:
* Are girls too clean? (February 26, 2011).
* Gut bacteria affect the brain (March 18, 2011).
* The smartest chimpanzee? (September 29, 2012).
Is Alzheimer's disease transmissible?
February 4, 2011
Don't panic. The practical answer, for the real world, is "probably not". But the full story is more complex, and quite interesting.
Consider a couple of diseases. One is Alzheimer's disease (AD). It is a neurodegenerative disease, progressing slowly and inexorably. The other is the type of disease we call prion diseases; bovine spongiform encephalopathy (BSE) or its human form, variant Creutzfeldt-Jakob disease (vCJD) are perhaps the best known prion diseases. Prion diseases are neurodegenerative diseases, progressing slowly and inexorably.
In introducing these two diseases I described them with similar terms. Is it possible that they have further similarities? Not long ago, the common view would have been "no"; they certainly seemed quite distinct -- based on knowing very little about either one. One reason for considering them as distinct is that prion diseases are transmissible. The classic prion disease of sheep, scrapie, spreads though flocks. BSE spreads through herds of cattle by using material from infected cows as food for the next generation. And eating BSE-infected beef is how humans get vCJD. In contrast, there has been no evidence that AD is transmissible.
In recent years, we have come to understand that each disease acts through a toxic protein. That is the amyloid-β peptide, derived from the amyloid precursor protein, for AD, and the prion protein for the prion diseases. In either case, the protein, whose normal function is not clear, goes awry and causes neurodegeneration. Much is murky about the details, but the protein starts to aggregate, and it is likely that some such aggregated form is the disease-active form.
We have also learned that not all prion diseases are acquired by infection. Prion diseases occur spontaneously, and their frequency can be enhanced by mutations -- just as for AD.
Thus over time, scientists have begun to recognize similarities between AD and the prion diseases. And they began to wonder once again if AD might be transmissible. After all, part of the prion story is that the disease-protein enhances its own production, and that seems to hold for AD, too. Before looking at the new work on the transmissibility of AD, we need to make one more point about prion diseases. We normally think of them being transmitted orally, as in the examples above. However, oral transmission is extremely inefficient. (There were hundreds of thousands of cows with BSE, but only a couple hundred cases of vCJD derived from it.) For lab work, prion transmission is done by intra-cerebral inoculation -- injecting the protein directly into the brain.
Readers can probably guess where this is going, so let's get to the -- first -- point: scientists injected AD protein into the brains of mice, and showed that it enhanced AD. That is, at least under these special conditions, AD can be shown to be transmissible. In fact, this was done a few years ago. The new work extends this, and shows that intraperitoneal injection (into the abdominal cavity) of the toxic AD protein can lead to enhanced disease.
So what does this all mean? That's not entirely clear. No one is suggesting that AD and prion diseases are the same disease, or even closely related. But they may share more features than we had realized. People working on these diseases now share their ideas and models. Further, the story is about more than just AD and prion diseases. There are also Parkinson's disease and Huntington's disease. Each of these is a neurodegenerative disease, progressing slowly and inexorably. Each seems to involve a particular protein that has gone awry, and tends to aggregate. A broad conclusion that may be emerging is that the protein that is toxic when produced endogenously can also be toxic if it is taken in -- if it gets to the right place in the body. How this might work can be understood vaguely, since the protein enhances its own aggregation, but beyond that it is quite unclear. In some ways, the result makes sense, given the emerging understanding of the disease process.
Given the title -- and the finding, some may wonder whether this means that AD might be transmissible (contagious) in humans. This seems unlikely, though we should be careful to not exclude the possibility. We should also note that a low level of transmission could be hard to detect -- but also of low consequence. One key argument against transmission of AD is simply that there is no evidence that it occurs. Second, the prion experience suggests that transmission is inefficient. The only known examples of substantial prion transmission to humans involved special situations where a positive feedback loop had been introduced. In both cases, further transmission was stopped simply by eliminating that feedback loop. The overall picture would seem to be that transmission of AD is unlikely, except possibly under special conditions; if such conditions occurred and were recognized, transmission would be stopped by changing the relevant conditions.
News story: Peripheral Induction of Alzheimer's-Like Brain Pathology in Mice. (Science Daily, October 21, 2010.) (October 30, 2011: The story that was originally listed is no longer available.)
* News story accompanying the article: Medicine: Prion-Like Behavior of Amyloid-β. (J Kim & D M Holtzman, Science 330:918, November 12, 2010.)
* The article: Peripherally Applied Aβ-Containing Inoculates Induce Cerebral β-Amyloidosis. (Y S Eisele et al, Science 330:980, November 12, 2010.)
More on this...
* Transmissibility of Alzheimer's disease? (June 1, 2016). Overview.
* Transmission of Alzheimer's disease in humans? (September 27, 2015).
More about Alzheimer's disease:
* Alzheimer's disease may be delayed in people who are actively bilingual (March 1, 2011).
* The Alzheimer's disease peptide: Why does it accumulate? (January 22, 2011).
* My page for Biotechnology in the News (BITN) -- Other topics includes a section on Alzheimer's disease. It includes a list of related Musings posts.
More about prions:
* Prion diseases -- a new concern? (March 19, 2012). New concerns about the transmissibility of prions from one species to another.
* The prion disease BSE/vCJD was briefly noted in the post: Killer chickens - follow-up (December 9, 2009).
* For more about prions, see my page Biotechnology in the News (BITN) - Prions (BSE, CJD, etc).
Also see:
* Possible role of gut bacteria in Parkinson's disease? (March 17, 2017).
* Huntington's disease: Is it an amino acid deficiency? (October 4, 2014).
February 2, 2011
Mammoth hemoglobin
February 1, 2011
Woolly mammoths lived in the arctic cold. Their hemoglobin was well adapted to the climate. That is the conclusion of a recent paper which is perhaps fascinating for the approach more than for the conclusion.
The genome sequence of the mammoth was determined some time ago. What they did here was to make a synthetic copy of the mammoth gene for hemoglobin, and put that gene into the common lab bacterium Escherichia coli. Voila... E coli now makes mammoth hemoglobin. It is something like the Jurassic Park scenario -- though for a single protein, not a whole organism, a protein from an organism that has been gone for 20,000 years or so (not 65 million years). Nevertheless, it is an achievement that makes one smile.
Once they have the mammoth hemoglobin, they can measure its properties -- and compare them with the hemoglobin from other organisms. In particular they compare the hemoglobin from the extinct mammoth with the hemoglobin of its closest living relative, the elephant. The measured properties suggest that the mammoth hemoglobin is better suited for life in the cold. Does that mean it holds oxygen better in the cold? Actually, just the opposite. Hemoglobin carries oxygen around. It must hold the oxygen, but it must also let go. Elephant hemoglobin isn't so good at letting go; mammoth hemoglobin is, and thus would seem better suited for life in the cold. They note that a similarly cold-adapted hemoglobin is found in modern arctic mammals, such as reindeer.
You're wondering why this matters for a warm-blooded mammal? "Warm-blooded" does not mean that the entire animal is at the nominal body temperature. That nominal temperature, is the "core" temperature -- 37° C for humans. Our skin temperature is well below that. Measurements on reindeer have shown that the extremities are quite cold.
News story: Resurrected Mammoth Blood Very Cool. (Science Daily, May 3, 2010.)
The article: Substitutions in woolly mammoth hemoglobin confer biochemical properties adaptive for cold tolerance. (K L Campbell et al, Nature Genetics 42:536, June 2010.) There is a copy of the paper freely available at the author web site: Author's pdf copy.
Other arctic posts include:
* Why does Santa Claus prefer the North Pole? (December 22, 2016).
* The Northwest Passage is open -- to whales (October 3, 2011).
* What's a dia? Bumblebees and reindeer don't agree. (December 6, 2010).
* Inuk, a 4000 year old Saqqaq from Qeqertasussuk (March 1, 2010).
More on ancient proteins:
* Dinosaur proteins (July 6, 2009).
* The Iceman's blood (May 14, 2012).
For more on mammoths...
* Early American art: a 13,000 year old drawing of a mammoth (July 18, 2011).
* A mammoth story (December 1, 2008).
More about warm-bloodedness: Do animal bones have something like annual growth rings? (August 7, 2012).
Other posts on hemoglobin include...
* A treatment for carbon monoxide poisoning? (January 13, 2017).
* Sickle cell disease: a step toward treatment by activation of fetal hemoglobin (October 29, 2011).
Commercializing the output of academic research
January 31, 2011
This post is not about a particular scientific discovery, but about how advances in scientific knowledge get translated into something useful in the real world.
In the United States, the process of commercializing discoveries from government-funded research at universities has been governed by the Bayh-Dole Act, passed in 1980. Briefly, this allowed the universities to claim ownership of discoveries. As a result, the many universities in the country now have an incentive to be key players in the translation of academic discoveries to commercial products.
Has Bayh-Dole worked? Well, that is complex. People point to good and bad effects. Of course, part of the answer must be "compared to what?". That is, the question is not simply yes/no on Bayh-Dole, but how one might improve on it.
The immediate impetus for this post is a commentary article in Nature. The specific question posed is whether another country (specifically here, India, but the issue is general) should adopt Bayh-Dole. Those interested in this broad issue of technology transfer may find this short article worth reading. The point is not to accept this author's analysis as "the answer", but to begin to see the complexity of the problem. Thus the article should be of interest to those in the US, where Bayh-Dole is the law, as well as to those elsewhere, who may have or be considering different laws.
The article: Lessons from Bayh-Dole. (B N Sampat, Nature 468:755, December 9, 2010.) The lead-in: "Developing countries wanting to boost commercialization of their academic research should learn from the mistakes of US patenting legislation."
For an overview of Bayh-Dole, see: Wikipedia: Bayh-Dole Act.
A previous Musings post was on the Myriad case: Can genes be patented? The Myriad case (April 2, 2010). The legal issues there have nothing specifically to do with Bayh-Dole. However, as background, the Myriad case did involve the patenting and licensing of a result of university research; some feel that the terms of licensing were so obnoxious as to force the challenge of the patent itself.
Another case: CRISPR: the legal battles begin (February 1, 2015).
Is the hormone of love also the hormone of discrimination?
January 29, 2011
Oxytocin is a fascinating hormone. In rats, it stimulates mothers to nurse their pups. In prairie voles, it promotes monogamy. In humans, it promotes trust and love.
Is oxytocin the magic road to world peace and brotherhood? Not so fast! As work on oxytocin progresses, we find that the story is more complex -- as so often in biology. It now seems that oxytocin works within our own group, but does not promote good feelings to "outsiders". It is a common feature of humans populations that we have some natural preference "for our own kind"; it is easy to imagine how that could promote survival.
A new paper reports several psychological tests showing that oxytocin promotes "ethnocentrism" -- that preference for our own kind. Further, they try to analyze the effect, and see whether it is due to a positive effect, an attraction for the "in-group", or due to a negative effect, a negative response to an "out-group". The results support the role of a positive effect, and are quite mixed for the negative effect.
Here is an example of what they did. The test here is a standard psychological test, the Moral Choice Dilemma Task. "A famous example is that of a trolley running toward five people, who will be killed if nothing is done. Hitting a switch will divert the trolley to another track, where it will kill only one person." [p 3 of the pdf, under "Experiments 4 and 5".] That is, the choice is whether or not to throw the switch -- and kill one person, but save five. In this use of the test, the one person who would be sacrificed is a member of the in-group or an out-group. The subjects being tested were under the influence of either oxytocin or a placebo.
|
The graph shows the results from one such test. (This is Figure 3A of the paper.)
Look at the right side, labeled "placebo". The two bars are about the same height, indicating little or no preference for sacrificing a member of the in-group or out-group. Now look at the left side, labeled "oxytocin". The in-group bar is now lower than the out-group bar. That is, the participants with oxytocin were less likely to sacrifice an in-group member than an out-group member.
Now compare the two in-group bars: the one for oxytocin is lower. That is, with oxytocin the participants were less likely to sacrifice a member of their own group. In contrast, the two out-group bars are about the same height, suggesting that there was little or no effect of oxytocin on how the participants reacted to the out-group members.
|
There are big cautions associated with this work. It is important that the work be extended, with various kinds of tests and various populations. At some point, we need to know something about dose-related effects, and what the endogenous hormone level is for the people being tested. A particular concern relates to the testing here for a negative effect. Some experiments show a small negative effect: that oxytocin seems to cause a negative response to the out-groups. Some of the news reports have hyped this, suggesting that oxytocin may promote, e.g., racial discrimination. The authors emphasize that the negative effect they see is small and mixed, and needs to be tested further. In any case, we should presume that oxytocin is only one part of the story -- regardless of what the details of the story turn out to be. That is, oxytocin is one factor that affects our feelings.
News story: Research finds the hormone of trust has limits. (Medical Xpress (was Phys.Org), January 12, 2011.)
The article: Oxytocin promotes human ethnocentrism. (C K W De Dreu et al, PNAS 108:1262, January 25, 2011.)
More about oxytocin: Role of oxytocin in monogamy in prairie voles (May 22, 2023).
Another primate with big eyes... Monogamy (January 30, 2013).
Also see: Prejudice against outsiders -- in monkeys (May 10, 2011).
Do young chimpanzees play with dolls?
January 28, 2011
Scientists studying chimpanzees in the wild noticed that they sometimes carried sticks -- in a manner reminiscent of how a mother carries a child. To characterize this behavior further, they made some systematic observations. The following graph summarizes the results. (It is Figure 1 from the paper.)
For simplicity, think of the graph as frequency of stick-carrying vs age. (Both axes are actually more complex than that, but I don't think it matters for an overview of the work.) Also, one can imagine a human life span along the x-axis; the chimps proceed through life just a bit faster than we do. (They suggest ages 8-14 as "adolescent".) The solid line is for the data for females; the dashed line is for males.
Key observations...
* Stick-carrying occurs with young chimps, not with older ones.
* Females do more stick-carrying than males.
|
|
So, what does it mean? First, the authors suggest that the behavior is something like playing with dolls, and reflects caring for (or playing with?) a baby. It is hard to comment on that even after reading their descriptions of the behavior; the information is rather limited. It's presumably an idea worth keeping in mind. But regardless of what it reflects, it still may be an interesting behavior. Why do they do it? It is not genetic; it is not observed in other chimp groups. It is not based on directly mimicking Mom -- at least Mom carrying sticks; they never observed an adult female that had given birth carrying out this activity. What they suggest is that the young chimps learn it from the other young chimps. That is, it is culturally transmitted -- in this case, among the juveniles.
Animal behavior is a fun topic. It is interesting to watch what animals do. I think we -- science as a whole -- is open to what other animals might do. However, it is easy to get too anthropomorphic -- even with chimps. So, it is important to take the suggestions as just that; it will take further work to sort out what it means.
News story: Wild Chimps, Stick Dolls: What's At Play Here? (NPR, December 21, 2010.)
The article, via abstract at PubMed: Sex differences in chimpanzees' use of sticks as play objects resemble those of children. (S M Kahlenberg & R W Wrangham, Current Biology 20:R1067, December 21, 2010.) It's a short paper (two pages), with a lot of general information; give it a try.
For more about play: The turtle that plays basketball (November 12, 2010).
For more on chimpanzees...
What makes us human? A new approach (April 25, 2011).
January 26, 2011
Paleobioboron
January 26, 2011
The chemical element boron has a rather enigmatic role in biology. It is required for optimal growth of plants, but very few specific B-containing biochemicals are known -- and for the most part they were discovered only in the last decade or so. The discovery of a boron-containing signaling molecule in bacteria came as quite a surprise.
Now we have a story of bio-boron from long long ago -- from the Jurassic era. The picture above shows a 150-million year old fossil of a red alga; the new work claims that the redness of this fossil is due to a class of boron-containing chemicals (which they call borolithochromes). This is a novel class of biochemical! Nothing like it is known from modern organisms.
|
The proposed structure of one of the compounds. The heart of the structure is a B atom esterified to two large groups. The large groups are incompletely characterized, but likely to be aromatic and phenolic.
|
There are two types of concern about this work. The first is whether the proposed structure is correct. This is straightforward: further work will clarify the structure. But the other concern is more interesting and more difficult. Did this chemical exist in the original alga, or was it somehow made during all the intervening time (e.g., during fossilization)? For example, it is conceivable that aromatic compounds and other borates, both from the original organism, reacted to form these compounds during fossilization. The authors offer some circumstantial evidence that the compounds are indeed biological, but they recognize that the case is incomplete. Fossils are not the real organism, and it is difficult to sort out how the fossil developed.
Perhaps the most important follow-up of this work should be to look for these boron compounds in modern organisms similar to the fossil organisms. No such compounds are currently known from modern organisms, but the red algae are not the best-studied organisms. If such compounds are found in modern organisms, it will support the idea that the compounds found in the fossil may indeed be biological. Further, and perhaps even more important, the compounds will become bio-markers that may be useful in classifying organisms. If no such compounds are found in modern organisms, there is no clear conclusion. Regardless, the fossils are pretty, and these novel boron compounds are the reason why.
News story: Shade of Red Preserved in Jurassic Fossils. (Wired, October 26, 2010.)
The article: Boron-containing organic pigments from a Jurassic red alga. (K Wolkenstein et al, PNAS 107:19374, November 9, 2010.) The figures above are Figures 1A and 3 from this paper.
More about boron: An unusual hydrogen bond, involving boron (March 26, 2016).
Other posts featuring pictures of fossils include:
* Death-grip scars from zombie ants, 48 million years ago (November 9, 2010).
* The oldest known plants (November 2, 2010).
Science: highlights of the decade
January 25, 2011
Science magazine has long ended the year by highlighting some of the major scientific discoveries of the year, in a feature section they now call Breakthrough of the Year. As 2010 ended, they went one step further, with an overview of the decade, which they called Insights of the Decade. A decade allows for a broader view, and more depth, so this was really quite a delightful section. Highly recommended!
Both features are freely available at the Science web site, though free registration may be needed.
* Insights of the Decade: Stepping Away From the Trees For a Look at the Forest. (Science 330:1612, December 17, 2010.)
* Breakthrough of the Year (and related items): The First Quantum Machine. (Science 330:1604, December 17, 2010.)
Musings posts in 2010 about topics Science discusses in those reports include:
* Do you need some new brain cells? (March 22, 2010).
* Sushi, seaweed, and the bacteria in the gut of the Japanese (April 20, 2010).
* The Siberian finger: a new human species? (April 27, 2010).
* The first truly habitable exoplanet? (October 12, 2010).
For the previous year's Breakthrough feature: Science: breakthrough of the year (January 4, 2010).
The political leapfrog
January 24, 2011
Yeah, this is about politics. It is about an issue that gets attention in American politics. It is also an issue in state politics here in California. The article caught my attention partly because of a recent discussion with a reader, also a Californian, about some of the implications of last fall's election, both at the state and national levels. With luck, the discussion here is not particularly partisan; the basic points are symmetrical across the political spectrum. (I'd be curious to hear whether those in other places find any of this fits with their experiences.)
As some basic background... Elections for state and national legislators are held in two phases. Procedures vary some by state, but this is typical... In the first round ("primary" election), each party chooses its candidates; that is, the voters in a party choose among the possible candidates of that party. In the second round ("general" election), all the voters choose among candidates from all the parties, and the winner is elected. The US political system is dominated by two political parties... The Republican party ("R") is to the "right" of the political spectrum, as conservative; the Democratic party ("D") is to the left, as liberal. (There are other parties, and they may influence the political debate. However, it is rare for them to elect any candidates.)
The observation that underlies the paper is that it seems that politics is becoming increasingly polarized. For example, the legislative bodies (US Congress and California state legislature) tend to have members with relatively extreme positions -- on one side or the other. Why? Is this because these extreme positions are dominant in the population? Or is there something about the electoral system that tends to lead to the election of candidates with extreme views?
The current paper explores this by polling the electorate and comparing their views with how their members of Congress actually voted. They do this over a period when the Congress switched from being controlled by the Republicans to being controlled by the Democrats. Their results suggest that the Republican Congress was more conservative than the electorate -- even more conservative than the Republicans in the electorate. Further, the Democratic Congress was more liberal than the electorate -- even more conservative than the Democrats in the electorate. That is, the overall position of the Congress leapfrogged the position of the electorate.
Why does this happen? The argument is that it may follow from the nature of our two-stage election procedure outlined above. It is commonly considered that the people with the more extreme positions are more active politically, both in giving time and money. Thus the primary elections, within each party, may be biased toward the more extreme candidates.
Is there anything we can do? In fact, California took an interesting step last year. The voters passed a ballot proposition that revamped the two stage election system with the intent to reduce the influence of the political extremes. In the new system, the primary election will include all candidates from all parties; the top two will go on to the second round -- regardless of party. The idea is that candidates will have to appeal more to the middle of the political spectrum in order to win the first round. (Not surprisingly, the major political parties strongly opposed this proposition, which was openly intended to reduce their power.) The 2012 elections will be the first with this new system. It will be interesting to see what effect it has.
News story, now archived at: Political Leapfrog Hops Over Most Americans. (Miller-McCune (now Pacific Standard), October 30, 2010.)
The article: Leapfrog Representation and Extremism: A Study of American Voters and Their Members in Congress. (J Bafumi & M C Herron, American Political Science Review 104:519, August 2010.)
Those who want a picture can go look on their own. You might want an elephant, the symbol of the Republican party; a donkey, the symbol of the Democratic party; or an elephant-donkey hybrid as a symbol of the emerging spirit of bipartisanship. Or perhaps you would want a picture of Arnold Schwarzenegger.
A previous post on politics: Do your genes affect your politics? (December 5, 2010).
More: Scientific curiosity -- and politics (May 22, 2017).
A previous post on frogs: Eating frog legs -- and why the hind legs taste better (July 16, 2009).
The Alzheimer's disease peptide: Why does it accumulate?
January 22, 2011
A key molecular feature of Alzheimer's disease (AD) is the small protein (peptide) called Aβ42. (Aβ stands for "amyloid beta"; the 42 denotes the length of the peptide chain, in amino acids.) Aβ42 is cut out from a longer protein called amyloid precursor protein (APP). How Aβ42 is cut out is partially understood; how it relates to the disease is poorly understood, though it seems likely that some aggregated form is important in the disease process.
So, what causes the disease? That is, what happens to start the disease process? Or, why do some people get it and others do not? Well, in some cases AD is caused by mutations -- and analysis so far has shown that the mutations increase the production of Aβ42. But what happens in the more common forms of AD, where no genetic cause has been shown. A new paper addresses this, by measuring the rate of production of Aβ42 and also its rate of clearance (disappearance). That may seem simple in principle, but it is technically challenging; in fact, their key step was the development of a method to do it.
|
Production (left, A) and clearance (right, B) of the AD protein Aβ42.
Red triangles are for people with AD; blue circles are for controls. In each part, measurements are taken at one hour intervals.
|
Graph A shows that the rate of production of Aβ42 is the same in AD and control individuals. However, graph B shows that the rate of clearance is lower in the AD patients. (The paper shows statistical analysis to support this. Also, the same basic results were found for the related peptide Aβ40. Don't try to compare the A and B graphs; they are very different scales. All you want to do is to compare the two curves within each part: AD patients vs controls.)
Let's imagine a simple model, in which the level of Aβ42 is a balance between production and clearance. In fact, for the control patients, those two rates are about the same, according to their measurements. In some genetic forms of AD, mutations upset the balance by increasing the rate of production, thus leading to higher level of Aβ42. The new work shows that in the common non-genetic form of AD, the balance is upset by clearance being impaired. The effect may be the same (higher level of Aβ42), but the reason is different. Of course, the next question might well be: why is clearance impaired in AD patients?
News story: Beta-amyloid Removal Problems May Underlie Alzheimer's disease. (Neuroscience News, December 9, 2010.)
The article: Decreased Clearance of CNS β-Amyloid in Alzheimer's disease. (K G Mawuenyega, Science 330:1774, December 24, 2010.) The figure above is part of Figure 1 of this paper.
Also see...
* Reversing Alzheimer's disease (March 4, 2011).
* Is Alzheimer's disease transmissible? (February 4, 2011).
* GSAP -- a clue to treating Alzheimer's disease? (October 2, 2010).
* My page for Biotechnology in the News (BITN) -- Other topics includes a section on Alzheimer's disease. It includes a list of related Musings posts.
The good and bad of the immune system -- a sheep story
January 21, 2011
The immune system protects us from disease. Hm, obviously, it doesn't always work. Maybe we should have more -- a "stronger" immune system. But there is a downside to having too strong an immune system: in humans, we commonly see that downside as autoimmune diseases. We don't fully understand how this all works; the immune system -- or, better, the immune systems -- are quote complex, and only partially understood.
Now we have a report on the immune system of a wild animal population. The work seems to, once again, show that the immune system has both good and bad effects.
They studied a population of sheep on a remote island off the coast of Scotland. They measured a marker of how strong the immune system was; that leads to the first key observation... the animals varied. Some animals had a stronger immune system than others, just as one would expect for any natural population.
What were the consequences? Well, females with stronger immune systems survived harsh winters better. (They suspect that the harsh winters were accompanied by increased threat of infection.) However, animals with stronger immune systems had fewer offspring. (They don't know why.) Thus overall, it seems that under mild conditions animals with weaker immune systems fared best (had more offspring), whereas under harsh conditions animals with strong immune systems did best. Thus a mixed population is maintained over the long run. This is likely a common situation.
Recall Why African-Americans have a high rate of kidney disease: another gene that is both good and bad (August 17, 2010).
|
Here is an example of their results. This is from Figure 2B of the paper.
The bars show the survival (of females) over the winter, under various conditions. ANA- and ANA+ distinguish animals with low and high levels, respectively, of an immune system marker; the cutoff is somewhat arbitrary, but the idea is fine.
Red bars show the results for several mild winters; survival is high, and the ANA- sheep do a bit better. Blue bars show the results for several harsh winters; survival is much lower, but the ANA+ sheep, with stronger immune system, do better.
|
The paper is both interesting and frustrating. It is interesting because it deals with the "real world" -- a natural population of animals in the wild. A key point -- that the population is heterogeneous -- is something that is often not seen in lab experiments; in fact, one often goes to great lengths to avoid heterogeneous populations. The heterogeneity of natural populations is important. We sometimes casually say that organisms are optimized for their environment. However the environment is variable, so the whole idea of being optimized for the environment is a simplification. Having variability within the population is one way that the population is optimized; different animals within the population have an advantage under different conditions. This is true for humans, too. An example we often hear about is the ability to use food efficiently. It's a great trait when food is scarce -- yet leads to obesity when food is plentiful. What's frustrating about the work with natural populations? The ability to do experiments. What is reported here is rather limited.
News story: Wild Scottish Sheep Could Help Explain Differences in Immunity. (Science Daily, October 29, 2010.)
* News story accompanying the article: Immunology: Infection Protection and Natural Selection. (L B Martin & C A C Coon, Science 330:602, October 29, 2010.)
* The article: Fitness Correlates of HeritableVariation in Antibody Responsiveness in a Wild Mammal. (A L Graham et al, Science 330:662, October 29, 2010.)
Among other posts on the complexity of the immune system...
Dengue fever -- Two strikes and you're out (August 10, 2010).
More about sheep: What can we learn from reading (the DNA from) old parchments? (January 30, 2015).
January 19, 2011
Why is there an advantage in being left-handed -- if you are a snail?
January 18, 2011
|
That's why.
The figure shows part of the skull of a snake. You can see that there are more teeth on one side than on the other. These snakes are specialized for eating right-handed snails; that is due to the feeding behavior, and the asymmetric sets of teeth are part of that.
You're wondering how one tells whether a snail is right handed? It has to do with direction of the coiling of the shell. Common snails have shells that are right-handed coils, but for many snail species, it is also possible to get individuals with left-handed shells.
The scale bar is 1 cm. The figure is reduced from Figure 1b in the paper.
|
Of particular note with this paper are a couple of movies. One shows a snake attacking a right-handed snail; the other shows it trying to attack a left-handed snail, and failing. The movies are not entirely clear; you may want to play each one at least twice before claiming you see what is going on. (They are short!) The movies are available both with the news story and the article's web site listed below.
News story: Snails with shells coiling to the left survive snake attacks (w/ Video). (Phys.Org, December 10, 2010.) Good overview, and includes the movies.
The article, which is freely available: A speciation gene for left-right reversal in snails results in anti-predator adaptation. (M Hoso et al, Nature Communications 1:133, December 7, 2010.) Click on Supplementary information for the movies.
This is an incomplete story. The immediate story here is that this snake is specialized for eating right-handed snails, but has trouble with left-handed snails. The movies show that -- and are the main reason for posting this. But beyond that... what is the big picture? Why haven't all snails become left-handed? Why can't there be snakes that are specialized for eating left-handed snails? Good questions, and there is some discussion of them in the paper. But I consider them beyond the topic for now. Enjoy the movies!
* More about snails: Armor (February 5, 2010).
* More about snakes: Heart health and python blood (December 28, 2011).
A person without fear -- due to a brain lesion
January 18, 2011
Evidence has been accumulating that the region of the brain known as the amygdala is key in the emotion we call fear. Now, study of an accident of nature provides some important support for this view -- and it is an interesting story.
The work involves a patient, coded as SM, who has lesions in both sides of her amygdala. Part of the study involves testing SM for her reactions to standardized stimuli, generally accepted as promoting fear. SM shows little or no fear with these stimuli, though she reacts normally to stimuli for other emotions. Further, an extensive analysis of SM's life shows a consistent pattern of absence of fear, despite incidents that most of us would consider harrowing.
They discuss some cautions in interpreting this work. Importantly, SM's lesions are not precisely confined to the amygdala. The new work is not proof of the role of the amygdala in sensing fear, but it is one more piece of evidence. An important merit of the work is that it is a real human.
Fear is a natural emotion, and very primitive. It is a good survival instinct: if in doubt, run.
News story: When the Brain Knows No Fear: Fear Discovery Could Lead to New Interventions for PTSD. (Science Daily, December 16, 2010.)
The article, via abstract at PubMed: The Human Amygdala and the Induction and Experience of Fear. (J S Feinstein et al, Current Biology 21:34, January 11, 2011.)
Thanks to Thien for alerting me to this story.
A 2008 paper provided evidence that veterans with certain types of damage to the amygdala were less susceptible to post-traumatic stress disorder (PTSD). This is reference 35 of the new paper. It is an example of how the understanding of fear and amygdala might be useful. PTSD may, in some ways, be thought of as a condition of excessive fear. Is it possible that it could be treated by somehow inhibiting the amygdala?
* News story: Study suggests some brain injuries reduce the likelihood of post-traumatic stress disorder. (EurekAlert, December 23, 2007.)
* The article, via abstract at PubMed: Focal brain damage protects against post-traumatic stress disorder in combat veterans. (M Koenigs et al, Nature Neuroscience 11:232, February 2008.) The paper is freely available from an author's web site: Author copy of pdf file.
For another aspect of fear and related emotions, see the post Racial stereotyping reduced with Williams syndrome (May 10, 2010).
For more about PTSD: Post-traumatic stress disorder (PTSD): a clue to its biochemistry (April 15, 2011).
Targeting cancers
January 15, 2011
An essay, something of a personal view of cancer drugs. Cancer is not a single disease; even "lung cancer" is not a single disease. One type of progress in treating cancer has been the development of drugs targeted to cancers with a specific molecular defect. In some ways, these work well -- but they have a more limited market. Is this the right trade-off? Are there ways to develop cancer drugs of wider usefulness? A thoughtful essay; worth a look. Freely available: Zeroing in on cancer. (C F Amabile-Cuevas, American Scientist 98:366, September 2010. Now archived.)
Other posts on cancer include:
* Does radiation treatment of cancer cause new cancers? (April 8, 2011).
* Cancer in the ancient world (November 1, 2010).
* A cancer drug with a switch: it acts only in a cancer cell (September 26, 2010).
My page for Biotechnology in the News (BITN) -- Other topics includes a section on Cancer. It includes a list of related posts.
The Siberian finger: a new human species? -- A follow-up in the story of Denisovan man
January 14, 2011
Original post: The Siberian finger: a new human species? (April 27, 2010). Briefly, scientists found an ancient finger bone in a cave, called Denisova, in Siberia. They were able to extract DNA, and sequence it. In this first report, they reported the sequence of the mitochondrial genome, which was recognizably human, but distinct from either modern or Neandertal humans. The evidence suggested that the finger represented a new type of human, possibly a new species. Regardless of the details, the story was fascinating simply because it opened up a new chapter in the story of the human race starting from a single finger.
Now, less than a year later, the same group reports the nuclear genome from the finger of this "Denisova man" (actually a woman). Instead of just having 16 thousand bases of information -- about the rather special, maternally inherited mitochondrial genome -- we have about 3 billion bases of information from its main genome. The big story is that the novelty of Denisova man is confirmed; the nuclear genome, too, is distinct from both modern and Neandertal humans. Beyond that, there are some differences in detail, and some fascinating new points.
The key difference is how they see the Denisova sequence relating to the others. From the mitochondrial sequence, they proposed that the Denisova sequence was older, as if Denisovans were ancestral to both modern and Neandertal humans. This is reflected in the figure in the earlier Musings post. Now, based on the nuclear genome, they propose that Denisovans were a sister group to the Neandertals. They do not know the reason for the discrepancy, though they do discuss some possibilities. In general, nuclear genome information is more likely to reflect the true history of the organism. However, two points to emphasize... First. both mitochondrial and nuclear genomes point to the Denisovans being a novel ancient group of humans. Second, the evidence is still limited. The authors are quite clear when interpreting their data that they are offering hypotheses based on the data so far, and indicating how these data suggest lines of further work. Unfortunately, the news coverage is not always so clear.
A new point that comes up is that some segments of Denisovan genome sequence are found in modern humans -- but only in Melanesians (Papua New Guinea, and nearby south Pacific islands). This implies some interbreeding between the Denisovans and the Melanesians -- and raises an obvious question given that the only known Denisovans so far are from Siberia. This leads to a hypothesis about the distribution of Denisovans; hopefully this will be tested with more data.
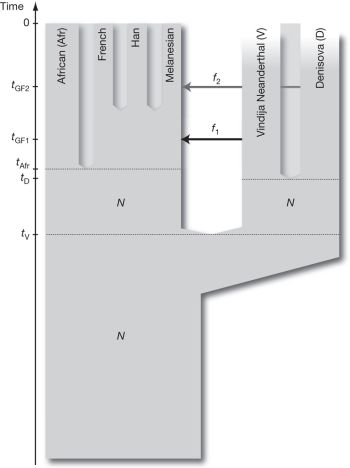
|
The figure summarizes their current views; this is Figure 3 from the paper.
The first main point in the figure is to see how the human lineage has split. Start at the bottom, with a single ancestral population. At some point, moving upward, the population splits into two. (This is labeled tv on the y-axis.) The right-hand branch further splits in two, giving the Denisovans and Neandertals -- both now extinct. The left-hand branch splits -- eventually into four groups shown here, all modern humans from various geographical regions. ("French" and "Han" are taken as representative of European and Chinese, respectively.)
The second main point is to see two instances of gene flow (transfer) from one of the now-extinct groups to modern humans; see the two arrows, labeled f1 and f2, between these two groups. These gene flows point to inter-breeding between the populations. One of these is the transfer of genes from Neandertals to modern humans -- all but the Africans, who had already split off; this was introduced in their earlier work on the Neandertal genome. The second gene transfer is from the Denisovans to the Melanesians; this is introduced in the new paper.
Remember that this is presented as the best fit to the data so far. And there is limited data, especially on the right-hand side (the extinct groups). More data leads to better understanding; available data allows the development of hypotheses that can be tested. The story of Denisovan man is very much a new and preliminary story. The development and testing of hypotheses is the most important part of the story.
|
With the earlier work there was talk of whether the Denisovans should be considered a distinct human species. With the current work, and the repositioning of the Denisovans, they prefer to just avoid that term. It is hard to know where to draw to line between one species and another. Maybe it is a species, maybe just a population (tribe?). What's important now is to follow the leads and learn more about the nature and distribution of the Denisovans.
Finally, they discuss one more Denisovan fossil: a tooth. The tooth, like the genome, is neither modern nor Neandertal. This is the first evidence about the morphology of the Denisovans. Again, more would be welcomed!
News story: Siberian Fossils Were Neanderthals' Eastern Cousins, DNA Reveals. (New York Times, December 22, 2010.)
* News story #1 accompanying the article: Palaeoanthropology: Fossil genome reveals ancestral link -- A distant cousin raises questions about human origins. (E Callaway, Nature 468:1012, December 23, 2010.)
* News story #2 accompanying the article: Human Origins: Shadows of early migrations. (C D Bustamante & B M Henn, Nature 468:1044, December 23, 2010.)
* The article: Genetic history of an archaic hominin group from Denisova Cave in Siberia. (D Reich et al, Nature 468:1053, December 23, 2010.)
For more about human ancestors:
* An interesting skull, and a re-think of ancient human variation (November 12, 2013).
* Did Lucy butcher a cow? (February 11, 2011).
A general discussion of the species question, motivated in part by the findings for Denisovan man: Human origins, and the species question (March 28, 2011).
For more on the use of genome sequences to determine relatedness of organisms: Capsaspora owczarzaki and you
or
Where did animals come from?
(April 10, 2011).
Also see: Archaic human genomes: update (September 2, 2011).
Also see: Life at age 34,000? (October 8, 2011). Is it possible to find microbes that have been alive for tens of thousands of years?
For more about Denisovan DNA in modern humans: What is Denisovan man telling us about Asian-Pacific man? (October 25, 2011).
Also see: The Iceman's blood (May 14, 2012).
Another example of using nuclear genome vs mitochondrial genome for understanding ancestry... A polar bear update (June 3, 2012).
More on ancient DNA... How long does DNA survive? (October 23, 2012).
Also see: Using DNA for data storage (March 5, 2013). That's storage of computer data.
There is more about genomes on my page Biotechnology in the News (BITN) - DNA and the genome.
January 12, 2011
The traveling bumblebee problem
January 11, 2011
A salesman wants to visit four clients. To save on travel expenses (fuel), he chooses the route with the shortest total distance.
A bumblebee wants to visit four flowers. To save on travel expenses (fuel), he chooses the route with the shortest total distance.
It's the same problem, yes? In fact, in math it is called the "traveling salesman problem". Interestingly, there is no simple solution to the general form of the problem; for a large number of clients (or flowers), it requires considerable computer time to work out. Now we learn that bumblebees are pretty good at solving this problem -- at least for four flowers.
|
Here is an example of the results, from Figure 3 of the paper listed below. This example involves three groups of flowers.
The layout shows the key places. N is the nest (where the bees start). The numbers above show where the flowers are -- and the order the bees were introduced to them. The dots are flowers. (There are two dots at site 1; that seems to not matter.) The arrows show the actual paths preferred by each bee. The number below each pattern shows the number of bees that preferred that pattern.
|
The left pattern shows that 6 bees traveled through the flowers in a circular route, counterclockwise. Skip one pattern, and you will see that one bee also visited the flowers in a circular sequence, but clockwise. Thus 7 of the 11 bees tested used one of the circular routes -- the shortest routes. Three of the bees visited the flowers in numerical order -- the order they learned about the flowers. (It would be interesting to know what these bees would do with more experience.) At the right, we see that one bee followed an "odd" route. Is he confused? Is he an explorer?
It's interesting biology to learn that the bees can optimize their path (thus saving energy of flying). It would be interesting to know how they do this. However, some of the media reports that the bees out-perform computers in solving the problem are just hype; the bees have not been tested with more than four flowers (stops).
News story, from one of the funding agencies: Bees capable of solving complex mathematical problem. (Wellcome Trust, October 39, 2010. Now archived.)
The article: Travel Optimization by Foraging Bumblebees through Readjustments of Traplines after Discovery of New Feeding Locations. (M Lihoreau et al, American Naturalist 176:744, December 2010.) Check Google Scholar for a freely available copy. (The "trapline" is the preferred path followed by a foraging animal making its rounds.)
Previous bumblebee post: What's a dia? Bumblebees and reindeer don't agree. (December 6, 2010).
More bee math... Zero? Do bees understand? (July 20, 2018).
Also see: On the Evolution of Calculation Abilities (June 20, 2011).
Other posts on bees include...
* What should a plant do if it hears bees coming? (December 10, 2019).
* How bumblebees detect the electric field (October 22, 2016).
* Caffeine boosts memory -- in bees (April 12, 2013).
* How do you tell if bees are pessimistic? (August 5, 2011).
More about flying: Why don't penguins fly? (August 24, 2013).
There is more about math on my page Internet resources: Miscellaneous in the section Mathematics; statistics. It includes a listing of related Musings posts.
Antibiotics in ancient times
January 10, 2011
A fascinating story. It's long been known that some ancient human bones "glow" (actually, fluoresce) -- just as if they had the antibiotic tetracycline in them. Many suspected this was likely due to contamination of the bones with tetracycline-producing bacteria over the ages.
New work shows that the tetracycline is actually an intrinsic part of the bones. This suggests that the antibiotics were incorporated during life, rather than being later contamination. Further, the tetracycline is widespread in the bones, even with a child. This suggests that there was frequent exposure, not just an occasional event.
Ok, that is the "easy" part. Actually, it wasn't easy at all, but required some quite sophisticated chemistry to figure out. But it is easy in that it is the factual part. What does it mean? Of course, here we have little to go on, with plenty of room for speculation. And as happens from time to time, the authors are cautious in the paper, but more provocative in the news.
The particular samples here are from Sudan, around the 5th century. The society was known to do fermentation: they made beer. It is thus plausible that they also fermented other bugs -- whether they understood the details of the process or not. The big question of interest is whether they knew the golden stuff was good for their health. That is, did they actually grow up this stuff in order to use it for medical treatment? The authors emphasize that the exposure was frequent, which suggests to them it was intentional. Maybe, but it doesn't quite follow. And even if it was intentional, it doesn't follow that they did it for medical reasons. So, let's be cautious about concluding what they did and why. But let's also be open. The new work shows regular exposure to tetracycline, and that raises interesting questions. Perhaps people will bring new findings to bear on those questions.
News story: Ancient Brew Masters Tapped Antibiotic Secrets. (Science Daily, September 2, 2010.)
The article: Brief Communication: Mass Spectroscopic Characterization of Tetracycline in the Skeletal Remains of an Ancient Population From Sudanese Nubia 350-550 CE. (M L Nelson et al, American Journal of Physical Anthropology 143:151-154, September 2010.)
I wonder... If they used antibiotics regularly, did they have a problem with antibiotic resistance? Here is a Musings post on antibiotic resistance: Restricting excessive use of antibiotics on the farm (September 25, 2010).
More on antibiotics is on my page Biotechnology in the News (BITN) -- Other topics under Antibiotics.
Also see: The history of brewing yeasts (October 28, 2016).
Controlling blood pressure: a clue?
January 8, 2011
Recent work offers new insight into how blood pressure is controlled.
The basic picture of what controls blood pressure is known. However, it is often unclear what goes wrong when blood pressure becomes excessive in a particular individual. That is, what is the underlying cause? Knowing what goes wrong increases the chance of effective treatment.
Blood pressure is controlled by a small protein (peptide) called angiotensin II (Ang II), which serves to constrict blood vessels, thus raising the pressure. As with many peptide hormones, Ang II is not made directly, but rather is cut out from a large protein. The original protein, coded for in your genes, is called angiotensinogen; note that "gen", indicating this is a precursor, which generates the intended product. Angiotensinogen is cut -- twice -- to yield Ang I and then Ang II.
What controls this process? The new work reveals a new feature of the first cutting step. It turns out that the tail where the enzyme is supposed to cut is buried inside the protein structure, and unavailable. However, oxidation of the angiotensinogen makes the tail available. Thus they suggest that reactive oxygen species (ROS) may be important in controlling blood pressure. They provide some evidence that this is the case in one particular type of hypertension (high blood pressure): pre-eclampsia, which is associated with pregnancy. They show that a higher percentage of the angiotensinogen is in the oxidized form in mothers with pre-eclampsia than in mothers with normal blood pressure. If ROS is a cause of hypertension, then it follows that treatment with anti-oxidants might be worth exploring.
The following figure outlines all this. The series of blue dots is the Ang II peptide. It starts as a tail -- a hidden tail -- of angiotensinogen. It then becomes a free tail, by action of the ROS. That is the key step focused on in the new work. (Renin and ACE are the enzymes for the two cutting steps, to make Ang I and Ang II, respectively.)
News story: Protein Study Clarifies Root of Preeclampsia. (MedPage Today, October 6, 2010. Now archived.)
* News story accompanying the article: Structural biology: On stress and pressure. (C D Sigmund, Nature 468:46, November 4, 2010.) The figure above is from this story.
* The article: A redox switch in angiotensinogen modulates angiotensin release. (A Zhou et al, Nature 468:108, November 4, 2010.)
Also see: ELABELA deficiency and preeclampsia? (October 8, 2017).
What's around the corner?
January 7, 2011
The problem at hand is illustrated by the Figure at the right. Clearly, there is no direct line of sight from the camera to the person in the room. Can we, despite that, get the camera to take a picture of the person?
Now, you might suggest that we put a mirror on the door. Ok, good idea -- for the specific problem as posed here. But that is not a good general solution to the problem of seeing around corners -- as will be clear when you look at the range of proposed applications.
|
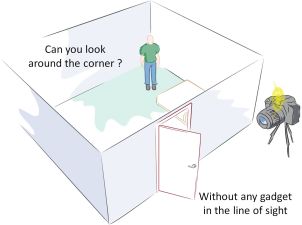
|
So, what are we to do? How about doing something like radar or echolocation, but using waves reflected off the door? Measure how long it takes for a photon to travel from the camera to the door to the person and back to the door and then to the camera. We know how fast light travels, so if we measure how long it takes for the light to return, we can calculate how far away the person is. But how do we tell where the person is? That takes more measurements, at various angles. At least in principle, take enough measurements, and the computer should be able to sort it all out.
The speed of light is 30 centimeters per nanosecond -- or about a centimeter every 30 picoseconds. (A nanosecond is a billionth of a second; a picosecond is a trillionth of a second.) To be able to judge distances to within a centimeter, they use a camera with a trillion frames per second -- and a light pulse that is much shorter than that.
Some of this is not new. They make quite a point that they are building on known technologies -- combining and stretching them to try to go a bit further. The hard part is the signal analysis. For some perspective, have a look at the following figure: "Higher Dimensional Light Transport: Popular imaging methods plotted in the Space-Angle-Time axes". It's complex, but the main point is to see the new method along with some other methods.
This figure and the one above are from the project web page listed below. Versions of these pictures appear in various articles and news stories.
Let's see if we can explain the idea of how this works. The following figure is from the lower frame of Figure 8 part b of the 2009 presentation. It is a diagram to illustrate how we can see "around the corner".
|
The camera apparatus consists of a light L and an array of sensors, denoted here by S1 and S2. The goal is to see a pattern of two objects plus a space between them, at P1, P2, and P3; the objects are conveniently considered as mirrors. The problem is that the objects are behind an "occluding wall".
Consider a light beam from L. Two such beams are shown, in red. One is a solid line, one is dashed. Let's just follow the solid line. Remember, a key point of their camera is that L is giving off short pulses of light -- each carefully aimed at a particular angle. The two beams here are separate events! The "solid" beam hits the diffuser, at D2. The diffuser is optically complex (think surface of door as an example), and various things happen to the beam. For example, parts of the beam bounce back to the sensors; see the solid blue line from D2 to S1. The sensor records the arrival of this "single-bounce" signal -- records the time of its arrival. Other parts of the (solid red) beam are reflected from D2 toward the objects at P1 and P3 (and toward the non-object at P2); see more solid blue beams. The beams that hit the objects are reflected back to the diffuser (green), and on to the sensors (yellow). These are triple-bounce signals, and the time of their arrival is a measure of the total distance traveled -- thus a measure of where the objects are.
|
If you can follow the solid beam around, good. Try to see that the sensors see single-bounce signals and triple bounce signals -- the latter involving the objects. The time it takes for each signal to arrive at a sensor depends on the total distance. A computer sorts out all the info received at the sensors, and computes where the objects are -- even though they cannot be directly seen. That's the idea.
What have they actually done? Well, they have developed the proposal, which recognizes that the devices they need, such as high-speed pulsing lasers, are available. They have begun to develop some mathematical theory and some software to implement it. And they have actually done some simple tests -- proof of principle -- in the lab. They understand that many challenges remain; they discuss some of them both on the project web page and in the paper. It's an interesting problem!
News story: Laser camera takes photos around corners. (BBC, November 18, 2010.)
Project web site: Looking Around Corners using Femto-Photography. (Camera Culture Group, MIT Media Lab.)
That project web site page links to two meeting presentations:
* A Kirmani et al, Looking Around the corner using Transient Imaging. IEEE 12th International Conference on Computer Vision (ICCV), 2009. In the published volume, it is p 159. This is listed on their page under References; choose Local copy to get a freely available pdf of the published version.
* Further down their page is an item labeled Presentation. This is a talk given in October 2010 by project leader Ramesh Raskar. The video -- of the actual talk -- is about 12 minutes; the first part of it is about this project, and the second part is about using a cell phone to measure your vision (the Netra project). The talk presents the main ideas, but without any actual demonstration of the system. It is fun, but not very deep. (The first slide says "Every photon has a story.") (For more on the cell phone as a tool in medicine... Connecting a cell phone and a microscope (September 2, 2009).)
Thanks to John for contributing this topic.
More about light: Is the speed of light really constant? (May 20, 2013).
Echolocation:
* On a similarity of bats and dolphins (September 15, 2013).
* A plant that communicates with bats (September 7, 2011).
January 5, 2011
The smallest water bottle
January 5, 2011
That's it. It holds one molecule of water.
It's based on a "buckyball" -- a soccer ball-shaped cage molecule of 60 carbon atoms. In early work they had learned how to make an opening in the buckyball just big enough for a water molecule to get in. That gives what they call a molecule flask. In the new work, they develop a cap: the phosphate group, which they can add and remove, serves to block the opening.
It wouldn't be very practical for routine use as a water bottle. It takes 36 hours to "fill" the bottle (with its one water molecule), and 2 hours to remove the lid. But they do speculate that it could be useful for delivering a drug. And of course, further work may result in improved bottles.
The paper includes measurements of the various processes, as I noted above. It also includes some theoretical calculations. Interestingly, theory and experiment agree fairly well, which is encouraging for further development.
News story: Scientists build world's smallest 'water bottle'. (Phys.Org, November 19, 2010.) The figure above is from this story.
The article: Molecular Flasks: Switchable Open-Cage Fullerene for Water Encapsulation. (Q Zhang et al, Angewandte Chemie International Edition 49:9935, December 17, 2010.)
More molecular cages: Hydride-in-a-cage: the H25- ion (January 22, 2017).
Other posts dealing with small containers include... Making a small container that has an opening in it (September 10, 2019).
More about bottled water: Consumption of microplastics by humans: the bottled water problem (September 20, 2019).
Also see... A new form of carbon -- hard enough to scratch diamond (March 1, 2022).
Make your own buckyballs... Kit for making your own "buckyballs".
Where did our oceans come from?
January 4, 2011
Three-fourths of the Earth's surface is covered by water. Where did all this water come from? The actual amount of water is not so high -- only about 0.02% of the rocky mass of the planet.
The simple answer is that we do not know its source. The common view is that the water was largely delivered to the planet by comets and such. However, a new paper from MIT geologist Linda Elkins-Tanton suggests that it could have arisen from the water in the original minerals that came together to form the Earth.
The paper has gotten considerable attention. I guess people are intrigued by the idea that our oceans are home-grown rather than imported. But we should emphasize that this is just a model. She does calculations to show how an ocean might develop from initial minerals, under certain conditions. The results make it plausible that the model could have applied to early Earth.
Where does this leave us? With two models for the source of earthly water. Both are plausible; what is unclear is in the details -- and the numbers. I'm sure that people will try to refine the details, and will debate the merits of the competing models. Perhaps one will end up seeming more likely, perhaps not. Perhaps both processes contributed to our earthly water supply. Let's just be open to these possibilities, at least for now.
Does it matter? Well, mankind always wants to know more. So it is part of our general understanding of nature. The model applies generally to "rocky planets", so has implications beyond the Earth. The paper notes that home-grown water would allow more time for life to emerge. Ok, but that solves a non-problem, and seems to be mainly to get attention.
News story: Growing Earth's Oceans. (Science Daily, December 8, 2010.) Good overview of the background and the model.
The article, which is freely available: Formation of early water oceans on rocky planets. (L T Elkins-Tanton, Astrophysics and Space Science 332:359, April 2011.)
More on the origin of Earth's water: Were comets the source of Earth's water? (February 3, 2012).
Children with two fathers
January 3, 2011
To understand this we need to be clear exactly what the title means -- and why it is a problem.
At the fundamental level, sexual reproduction involves the fusion of two haploid cells to form a diploid cell. Haploid cells carry one copy of the complete set of chromosomes (genetic information); diploid cells carry two copies. In multicellular organisms, the haploid cells that fuse are typically specialized cells called gametes (sex cells, or germ cells, such as eggs and sperm). The basics of such sexual reproduction are widespread in eukaryotic organisms of all the major groups, including animals. plants and fungi. For example, the simple yeast Saccharomyces cerevisiae (baker's or brewer yeast) has a sexual system that fits this description, and serves as a major model system for studying sexual reproduction. The process of making the haploid cells, called meiosis, is quite similar in all these organisms. Of course, the way these fundamental processes are carried out in the life cycle of the organisms varies. The point is that, fundamentally, sexual reproduction is about how genes are assorted.
The goal of the current work is to create offspring whose two genetic parents are both males (fathers): the two haploid cells that fuse are to carry the chromosomes of two males. That is, the goal is about the genetics, not about the behavior of the organisms. If you peek at the figure below, you will see that we start with two males (two blue boxes at the top) -- and produce offspring that, genetically, contain one chromosome set from each of those males.
What's the problem? Again, this is not about the behavior of organisms. Noting that two males can't do that is irrelevant. Those familiar with modern advances in reproductive technology might suggest something along the following line: Take an egg cell, remove the genetic material, and then add back the genetic material from the two desired parents (the two males). There are technical issues, but that is a logical proposal. The problem is that, in mammals, chromosomes are "marked" -- we say imprinted -- to show that they come from mother or father; proper development of a fertilized egg requires one set from each. The imprinting of the chromosomes, using chemical marks known as methyl groups (CH3-), determines how the chromosomes function. Proper development depends on some functions being provided by maternal chromosomes, and some by paternal chromosomes. [This has nothing to do with sex chromosomes (X and Y). A male's gametes (sperm) may have an X chromosome or a Y chromosome, but they are all marked as being paternal.]
So the real problem is how to get the male to make a set of chromosomes that is marked "mom". The approach is to make a female from one of the males: a female that is genetically equivalent to the male. Modern stem cell technologies offer the clues.
|
The figure is a flow chart of how they get a child from two fathers. It is Figure 1 of the paper.
The two fathers are shown at the top. Of course, having one father is no problem, so nothing special happens to Father #2. But Father #1 goes though a series of steps (down and to the right). The result is to make a female that is genetically equivalent to Father #1; this female can make oocytes (egg cells) that are genetically like Father #1 -- but now marked as maternal. The final step is an ordinary mating of a male and a female, the two boxes at the right -- with an X between them symbolizing a cross (mating). Note that blue and red boxes are for males and females, respectively. Clearly, a key step is where a blue box becomes a red box: a male "becomes" a female.
|
There are three main steps involved:
* First, cells from Father #1 are used to make induced pluripotent stem cells (iPSC). This is the emerging technology that allows us to make undifferentiated cells, similar to embryonic stem cells, from any body cell, even from an adult. Making iPSC causes loss of the imprinting. This step is shown in the figure above with the downward arrow labeled "reprogram".
* The iPSC are still male, carrying the typical male sex chromosomes XY. For reasons that are not understood, the Y chromosome is occasionally lost in iPSC cultures. This leaves the cells as XO, where the O means that there is no second sex chromosome. Normal females are XX, but it turns out that XO also leads to females. (The simple story is that the Y chromosome leads to maleness.) In mice, XO females are fertile (though that is not so in humans). Thus we now have female cells that are (otherwise) genetically identical to the original male Father #1. This step is shown in the figure above where we go from a blue box to a pink box -- from male to female.
* Finally, they use those cells to make a whole animal. The way they do it here involves making a chimera, but the details don't matter. The point is that this step leads to a female animal that is (otherwise) genetically identical to the original male Father #1. This female can now make oocytes (egg cells) that are imprinted as maternal, and of course it can mate as a female. (Note that this step could not occur with humans, since XO females are not ferule.) Mating this derived Mother-from-Father-#1 with Father #2 leads to the desired result: offspring that have -- genetically -- two fathers.
Note that a particular animal does not change from male to female (though that can happen with some animals). What happens is making a female that is genetically equivalent to one of the male parents.
News story: Reproductive scientists create mice from 2 fathers. (e! Science News, December 8, 2010. Now archived.)
The article: Generation of viable male and female mice from two fathers. (J M Deng et al, Biology of Reproduction 84:613, March 2011.)
* More imprinting: Unequal allele expression (April 18, 2023).
* A step toward children with three parents: Tri-parental embryos for preventing mitochondrial diseases (September 23, 2016).
* More about meiosis: The rotifers that lack sexual reproduction: what do we learn from the genome? (October 4, 2013).
* For more about Saccharomyces cerevisiae... St Patrick's Day (March 17, 2012).
* For more about chimeras... The first chimeric monkeys (February 5, 2012).
* A post on making disease-specific iPSC: Using stem cells to study a heart condition (April 19, 2011).
* A recent post on reproductive technologies: In vitro fertilization: an improvement and a Nobel prize (October 15, 2010).
* A post on stem cells, including some discussion of iPSC: Do you need some new brain cells? (March 22, 2010).
Top of page
The main page for current items is Musings.
The first archive page is Musings Archive.
E-mail announcements -- information and sign-up: e-mail announcements. The list is being used only occasionally.
Contact information
Site home page
Last update: April 24, 2026