Home
> Musings: Main
> Archive
> Archive for May-August 2011 (this page)
| Introduction
| e-mail announcements
| Contact
Musings: May-August 2011 (archive)
Musings is an informal newsletter mainly highlighting recent science. It is intended as both fun and instructive. Items are posted a few times each week. See the Introduction, listed below, for more information.
If you got here from a search engine... Do a simple text search of this page to find your topic. Searches for a single word (or root) are most likely to work.
Introduction (separate page).
This page:
2011 (May-August)
August 31
August 24
August 17
August 10
August 3
July 27
July 20
July 13
July 6
June 29
June 22
June 15
June 8
June 1
May 25
May 18
May 11
May 4
Also see the complete listing of Musings pages, immediately below.
All pages:
Most recent posts
2026
2025
2024
2023:
January-April
May-December
2022:
January-April
May-August
September-December
2021:
January-April
May-August
September-December
2020:
January-April
May-August
September-December
2019:
January-April
May-August
September-December
2018:
January-April
May-August
September-December
2017:
January-April
May-August
September-December
2016:
January-April
May-August
September-December
2015:
January-April
May-August
September-December
2014:
January-April
May-August
September-December
2013:
January-April
May-August
September-December
2012:
January-April
May-August
September-December
2011:
January-April
May-August: this page, see detail above
September-December
2010:
January-June
July-December
2009
2008
Links to external sites will open in a new window.
Archive items may be edited, to condense them a bit or to update links. Some links may require a subscription for full access, but I try to provide at least one useful open source for most items.
Please let me know of any broken links you find -- on my Musings pages or any of my regular web pages. Personal reports are often the first way I find out about such a problem.
August 31, 2011
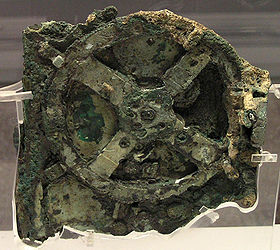
The Antikythera device: a 2000-year-old computer
August 31, 2011
It's among the oldest known geared devices -- of a complexity unknown for many centuries.
The object shown above was pulled from the sea in 1900. It's from a shipwreck that occurred 2000 years earlier -- a shipwreck encountered by accident by divers looking for sponge. The stories of what this device does and how that was learned are fascinating.
It's known as the Antikythera device, from the Greek island near its discovery. It has been examined by various techniques over the years, including increasingly sophisticated forms of X-ray analysis as they were developed. Over time, a picture has emerged. It consists of a system of gears that carries out various astronomical calculations and displays the results on dials. It is, therefore, a calculator -- perhaps even a computer. (What's the difference? It's not very clear -- and not very important here. It's just a teaser: This 2000-year-old device might reasonably be considered a computer. Those who read the book will get one man's opinion, but it does not help much.)
It's not news that such astronomy was known, and considered important to the ancients. What is historic here is that this is a very old geared device. When discovered, it was the oldest known geared device -- a thousand years older than the previous record holder. It is still one of the oldest known such devices. It is plausible -- though uncertain due to the sparse record available so far -- that this is a forerunner of modern geared devices, including clocks. A forerunner, perhaps -- but it is also more complex than any such devices known so far up to at least the 14th century. Further, the nature of the device is an insight into ancient Greek technology: quite small and intricate, requiring high precision manufacturing.
The fossil record of machines has much analogy to that of organisms. Fragments. A sparse record. Understanding each individual device/fossil is a challenge. And the story of how various fossils are related is tentative, subject to more information becoming available. This device revolutionizes our views of the history of geared machines. A plausible history begins to emerge, but it is very incomplete. We need more fossil clocks and computers!
The story of the Antikythera device has peaked in recent years, though study continues. The story has been told in various scientific papers. Usefully, it has been told in a general-interest science book by Jo Marchant. I have noted this book on my page of Book suggestions: Marchant, Decoding the Heavens. The journal Nature has published various articles, both technical and news, on the device. I encourage you to check out their video, listed below, as a good introduction.
Videos. Here is a two-part video produced by Nature, in conjunction with a paper on the device in 2008. Each part is about 10 minutes. Together, they are a good introduction and overview.
* Part 1
* Part 2
A search on Antikythera videos will turn up more, including one on a model made with Lego blocks. (Watch dates. The story of the Antikythera device is a developing story. You may find older videos -- or readings -- with information that is no longer current.)
An article. This one discusses the interpretation of the inscriptions. Reflections on the antikythera mechanism inscriptions. (M K Papathanassiou, Advances in Space Research 46:545, August 10, 2010.)
Among other resources...
* Wikipedia: Antikythera mechanism. The picture above is from this page. It shows the largest piece.
* Interactive Relighting of the Antikythera Mechanism. Among the technologies used to analyze the device was one developed by HP (Hewlett Packard). It involves reflectance imaging -- detailed analysis of the surface under various lighting conditions. This page is an entry point to their work, with some examples. Click on "PTMs" for more about the method -- and a picture of an artefact a thousand years older then the Antikythera device! (Now archived.)
More about the device: Which calendar did the Antikythera device use? (July 11, 2024)
More on computing history:
* Alan Turing, computable numbers, and the Turing machine (June 23, 2012).
* Book suggestions: Swade, The Cogwheel Brain - Charles Babbage and the Quest to Build the First Computer (2000).
My page Internet resources: Miscellaneous contains a section on Science: history. It includes a list of related Musings posts.
More on gears... Quiz: What are they? (September 27, 2013).
More about shipwrecks... An ancient navigation device? (April 16, 2013).
Posts on sponges include... Bending a rigid rod (May 17, 2013).
More from the Greek seas: Underwater "lost city" explained (July 25, 2016).
More old things... Claim of oldest fossilized cells refuted (May 3, 2015).
The hydrogen economy -- in the mid-Atlantic
August 30, 2011
The ultimate energy source for most life around us is the sun. However, in the 1970s scientists began to work out the story of life at deep sea thermal vents; these are basically undersea volcanoes. There, life is based on chemical energy coming from the earth's interior. Specifically, oxidation of methane (CH4) and sulfides (such as hydrogen sulfide, H2S) drive the system. Microbes carry out these reactions, and thrive; they are the base of the ecosystem, as the primary energy collectors.
New work shows that hydrogen gas is also one of the energy sources for thermal vent life systems. In some ways this is not a surprise. It has long been known that H2 is present. Further, hydrogen metabolism is simple and yields much energy. However, use of hydrogen at thermal vents had not been established. In the new work, they show that the gill tissues from mussels near thermal vents have the key gene for metabolizing hydrogen. Under lab conditions, the tissues do in fact metabolize H2. Hydrogen metabolism can be attributed to the bacteria living in the gill tissue by genome analysis.
Here is another of their intriguing experiments...
|
What they did was to sample the environment near a vent, and measure the local hydrogen concentration and temperature (T). The graph shows the hydrogen concentration (y-axis) vs T (x-axis). They separate the data points into two groups: those in mussel beds (red), and those not (blue). The basic observation from the graph is that samples from the mussel bed have lower hydrogen level than expected for that T. Thus they infer that the mussels are consuming the hydrogen. (It is the bacteria within the mussels that actually carry out hydrogen metabolism.)
(This is Figure 3 of the paper. You can also see that the mussels like cold water.)
|
I can think of questions to ask about this, but it is a remarkable experiment. Measuring the H2 concentration is quite a technical feat. Not many people have operated a mass spectrometer at the ocean floor.
Overall, their results make it likely that this deep sea thermal vent biosystem operates, in part, on hydrogen.
News story: Researchers discover hydrogen-powered symbiotic bacteria in deep-sea hydrothermal vent mussels. (PhysOrg, August 11, 2011.) A good overview of the work, plus pictures of the mussel beds and the vent area.
* News story accompanying the article: Microbiology: Hydrogen for dinner. (V J Orphan & T M Hoehler, Nature 476:154, August 10, 2011.) For those not familiar with deep sea vent life, this is a good introduction.
* The article: Hydrogen is an energy source for hydrothermal vent symbioses. (J M Petersen et al, Nature 476:176, August 11, 2011.)
Thanks to Jitesh for alerting me to this story.
Also see:
* Was hydrogen the energy source for the origin of life? (February 1, 2022).
* Life on 10 zeptowatts (September 13, 2020).
* Is there food on Enceladus? (May 21, 2017).
* Is clam cancer contagious? (April 21, 2015).
* How does worm "fur" divide? (January 4, 2015).
* Steppenwolf: Life on a planet that does not have a sun? (July 2, 2011).
* Hydrogen fuel cell cars (June 8, 2010).
How to find the blood
August 29, 2011
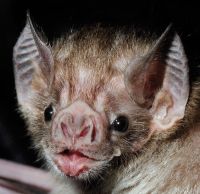
To him, blood is dinner.
Vampire bats live on blood. They sneak up on an animal in the dark, and go directly for a vein. How do they know?
Scientists have long known that the bats are able to detect heat -- as infrared (IR) radiation. They do this using a special organ, known as a pit, near the nose. But how do they detect IR radiation of this type? That is not a common trait!
|
|
|
The picture is reduced from the one featured in the Nature news story, listed below. closer view. Hm, maybe I should have chosen a picture that better shows the teeth -- barely noticeable here. I chose this one as being cute.
|
New work explores this further, and finds the heat sensor. In fact, they find the specific molecule that is sensing heat. It is an interesting story.
As background... We all have heat sensors. Just approach the hot stove, and you will know. Over recent years we have come to know that we detect the heat through a specific protein, a heat sensor. It is an ion channel in the cell membrane. When the channel protein gets hot, it changes shape, and allows specific chemicals (ions) to flow; the ions are what initiate the nervous system response.
The new work shows that the vampire bats have re-tuned this regular heat-sensing protein, which normally helps to protect us from noxious heat, so that it detects normal body temperature. They make two versions of this heat sensor; the one tuned to detect body heat of their victims is made only in the facial pit structure.
|
Here is an example of their evidence on the heat sensors. This is Figure 3b of the paper.
The basic idea of the experiment here is simple, though it is technically quite complex. They measure the current through the ion channel as a function of temperature (T). The graph shows current on the y-axis (log scale); the x-axis is related to T.
|
Even with that brief description... The two graphs each show a "kink". In one, labeled (at the top) as having the S version of the channel protein TRPV1, the kink is at about 30 °C. In the other, labeled as having the L version of the channel protein, the kink is at about 40 °C. The former, the S version, is the novel form that is specifically found in the facial pits; it is this form that is suitable for detecting the heat of a vein.
Let's look at that T scale, on the x-axis, more closely. The scale says 1000/T; that is, the graph uses the reciprocal of T, rather than T. That means that T "runs backwards" -- high T to the left. You can now see that as we raise the T (go left!), the current increases, as the channel opens. (Chemists will recognize the type of graph here as an Arrhenius plot.)
|
Overall, then, they provide good evidence that a novel form of this ion channel protein has been re-tuned so that it is sensitive to body heat. Its localization to the facial pits is consistent with that use. Thus we seem to have the molecular basis for one step in how vampire bats find their target.
Some snakes also have IR sensors to detect body heat. Some, such as the pit vipers, have an anatomical structure somewhat like that of the vampire bats. However, the molecular basis of the pit viper heat sensor is different. It seems, then, that this heat sensing trait arose independently in the two groups of animals.
News story: What Steers Vampires to Blood. (UCSF, August 3, 2011.)
* News story accompanying the article: Neuroscience: Heat-thirsty bats. (M B Fenton, Nature 476:40, August 4, 2011.) This provides a useful introduction to vampire bats, as well as to the heat sensing.
* The article: Ganglion-specific splicing of TRPV1 underlies infrared sensation in vampire bats. (E O Gracheva et al, Nature 476:88, August 4, 2011.)
More about vampire bats:
* The biological basis of sanguivory (March 2, 2018).
* What can we learn by looking at the DNA in vampire bat feces? (May 27, 2015).
Other posts on bats include...
* Don't eat the bats.
or
An ALS story: Guam and New Hampshire; food chains and biomagnification; cyanobacteria, cycad trees, and flying foxes; pond scum; and BMAA.
(October 6, 2009).
* Water: a bat's view (December 3, 2010).
* Baseball physics (July 31, 2011).
* A plant that communicates with bats (September 7, 2011).
A post about developing an artificial sense for infrared light: Can rats touch infrared light? (February 25, 2013).
Also see:
* How the teeth are sensitive to cold (June 14, 2021).
* Heart health and python blood (December 28, 2011).
* Making an artificial ion channel from DNA (January 8, 2013).
For more about lipids, see the section of my page Organic/Biochemistry Internet resources on Lipids. It includes a list of related posts.
Water at the Martian surface?
August 27, 2011
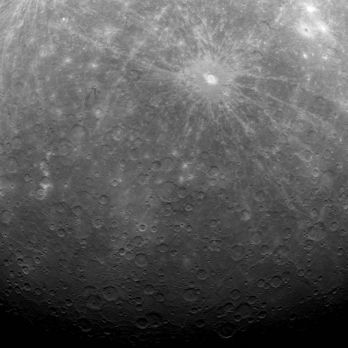
It captured the attention of the news media -- and of the public. Water on Mars. Near the surface -- perhaps on the surface. Now -- photographed by a NASA spacecraft. Liquid water is a key requirement for life "as we know it", and finding liquid water at the Martian surface certainly feeds the imagination. So, what's the story?

|
The figure at left is an example of the key evidence. It's based on a photo taken by the HiRISE camera on the Mars Reconnaissance Orbiter. Look at those dark streaks. The authors call them recurring slope lineae (RSL). They do look like water, don't they? Importantly, the streaks appear in summer, and disappear in winter. And they appear in places where it gets warm -- warm enough to melt water-ice (or, at least, brine: concentrated salt solutions). Animated sets of photos showing the seasonal recurrence of the RSL at various sites are available below.
And that about takes care of the facts. The rest is a discussion of what the RSL might be, with water (or brine) being one of the choices. An instrument that should be able to identify water showed no water signal with the RSL. There are various possible explanations for that discrepancy. For example, the water may be just under the surface, affecting its appearance. The paper is modest in its claims, but clearly the intent is to raise the possibility that surface water is part of the modern Mars story. The possibility.
This is Figure 1C of the paper, and has been used widely in news stories. The general credit for the figures is: NASA/JPL/University of Arizona.
|
If only we could send something (or someone) to where those streaks are to make a direct observation! But that is not going to happen for several years. Until then, we have some tantalizing pictures and some speculation. That's fine. Time will tell. For now, we just have "the possibility"; it is certainly premature to claim that water has been found at the surface of Mars.
News stories...
* Briny Water May be at Work in Seasonal Flows on Mars. (University of Arizona Office of University Communications, August 4, 2011.) Press release from the lead institution. Good presentation of the work, including the uncertainty of interpretation. Under "Et Cetera" (at the right), it links to the lab web page, which includes numerous animations showing the seasonal changes. (Each animation is a series of photos of the same site over time.)
* New Evidence for Flowing Water on Mars. (Universe Today, August 4, 2011.) Includes one of the animations.
The article: Seasonal Flows on Warm Martian Slopes. (A S McEwen et al, Science 333:740, August 5, 2011.) The "Supporting Online Material", linked to the article page, includes a table (Table S5) that shows what evidence is consistent or inconsistent with various interpretations of the streaks. The interpretations involving brine flow generally fare best -- other than the specific identification of water. If the flow is underground, near the surface, with the streaks reflecting changes in properties of the surrounding soil, that avoids the issue of failure to directly observe water. Bottom line... They have fascinating images of seasonal changes; what they mean is uncertain.
Thanks to those who suggested this item. It was on my list to do, but the extra votes helped to ensure it got finished.
More about Mars...
* A lake on Mars? (August 24, 2018).
* Is Mars wetter than Earth -- underground? (February 9, 2018).
* What causes gullies on Mars? (September 8, 2014). This post is from the same team of scientists.
* One way trip to Mars (September 22, 2009).
* Spirit (February 20, 2010).
* Genome from Mars (September 22, 2010).
* Mars: craters (August 11, 2012).
Update, June 13, 2018...
More recent work, from the same scientists, makes it more likely that the RSL are due to flowing sand. Key evidence is that the flows are found only at substantial slopes. In any case, RSL are still of interest. News story, which links to the article: Recurring martian streaks: flowing sand, not water? (Phys.org, November 20, 2017.)
August 24, 2011
Mayhem at the center of the Milky Way
August 23, 2011
This post is about some colorful writing. The first news story listed below starts, "The Milky Way's center houses a supermassive black hole so sleepy that it probably hasn't swallowed a decent meal for years." Now, that gets attention. I've included another news story, and the article they refer to.
The topic is some speculation about what's going on at the center of our galaxy. More specifically, it's about a burst of star formation a few million years ago. They suggest this could relate to a collision of black holes as part of a galactic collision. It's important to note that, while there are interesting ideas here, this is largely speculation. In fact, the paper listed below is a draft -- apparently posted to solicit comment. An important part of this will be for the astronomers to suggest alternatives, and then to suggest what observations might help distinguish among the proposed explanations. So, enjoy the story -- especially the first item listed below. Don't take it too seriously, at least for now.
News stories...
* Black Hole Collision May Have Set Off Fireworks in the Milky Way. (Science Now, July 27, 2011.) Check it out, for some fun science writing -- and a good presentation of the story.
* Massive Black Hole Smashed Into Milky Way 10 Million Years Ago -- Evidence is emerging that a small galaxy, with a huge central black hole, must have recently collided with the Milky Way, say astronomers. (The Physics arXiv Blog, MIT Technology Review, July 19, 2011.)
The article, which is freely available at the arXiv: Can A Satellite Galaxy Merger Explain The Active Past Of The Galactic Center? (M Lang et al, July 18, 2011.) Caution: The version posted is a draft of an article. It has not yet been submitted to a journal, and has not been peer-reviewed. The authors have posted the draft in order to solicit comments. It is possible that other versions will be posted later. (The date on the article and the date on the arXiv page are incompatible. No big deal.)
More on black holes...
* Added March 4, 2026.
An unusual neutrino, from a novel type of black hole? (March 4, 2026).
* Gravitational waves (February 16, 2016).
* How would you die if you visit a black hole? (May 6, 2013).
* Black hole: simulation (March 15, 2010).
More on galactic mergers...
* LEDA 074886 (April 2, 2012).
* What is it? (February 7, 2011).
More about the Milky Way:
* We are all Laniakeans (October 21, 2014).
* Dung beetles follow the Milky Way (February 24, 2013).
Predicting vaccine responses
August 22, 2011
People vary in their responses to a vaccine.
The figure at right illustrates this. Two flu vaccines were administered. One, labeled TIV (trivalent inactivated vaccine; blue bars), is the common injected vaccine. The other, labeled LAIV (live attenuated influenza vaccine; black bars), is administered intranasally. Each bar shows the response of one person, measured 28 days later. You can see that the responses of individuals -- the amount of antibody they make -- vary widely. This is true for both vaccines.
|
|
Why is there such variation? And could we tell before waiting for the response to develop? That is, could we predict who will and who will not develop a good antibody response to a vaccine? A new paper explores these questions, and comes up with some interesting -- and preliminary -- results. Their approach is rather brute force: they simply measure gene expression by the individuals 7 days after the vaccine, and look for differences between responders and non-responders. That is, they compare day 7 gene expression patterns with the day 28 antibody response. (They look at gene expression on both day 3 and day 7. The two days apparently give similar results. It is not clear in the paper which day's data are used.)

|
For the TIV, they found about a thousand genes whose early expression seemed correlated to the later antibody response; that is out of about 20,000 human genes. A few of these genes are shown in the figure at the left.
Now, you may well find this figure overwhelming -- or at least, amusing. But what it shows is a gene network: a group of genes that are functionally related. Further, the coloring shows how these genes responded compared to the antibody levels achieved (for the TIV). Red indicates genes whose expression was positively correlated with a good response; blue indicates genes whose expression was negatively correlated with a good response. That is, the analysis has shown a functionally related set of genes that seems to predict the ultimate response.
This is Figure 4b from the paper; it is also in the Science Daily news story.
|
|
|
We learn two things from this analysis... First, we learn that the function of certain genes does predict the antibody response. Second, we find some clusters of related genes that seem related to the antibody response; this gives us some clues about important functions involved in the antibody response. Thus, we have gained some information about the questions posed above.
Is this useful? Well, it's very preliminary -- but intriguing. The good news is that they find differences in gene expression between responders and non- responders to the vaccine. They've done this with two flu vaccines here, and in earlier work with another vaccine (yellow fever). The genes involved are mostly different in each case, but with a few genes that seem to be involved in multiple responses. That could be very interesting to follow up. For now, this is largely a research project, to help us better understand vaccine responses. It is possible that predicting which people will respond -- either shortly after vaccination or perhaps even before -- could be useful information, but that is for the future.
News story: Quick Test Can Predict Immune Responses to Flu Shots. (Science Daily, July 10, 2011.)
* News story accompanying the article: Solving vaccine mysteries: a systems biology perspective. (L Trautmann & R-P Sekaly, Nature Immunology 12:729, August 2011.)
* The article: Systems biology of vaccination for seasonal influenza in humans. (H I Nakaya et al, Nature Immunology 12:786, August 2011.)
Also see: Who gets sick from the flu? (September 20, 2011). This later post deals with the variability of infection responses between individuals. The post above deals with variability of vaccine responses between individuals. The approach is similar for the two papers. Is there any actual connection between what is being studied? Interesting question. I don't think we can tell at this point.
And more... Why vaccine effectiveness may vary: role of gut microbiome? (February 27, 2015). This is from the same lab.
More on the LAIV: The nasal spray flu vaccine: it works in the UK (April 12, 2017).
Posts on flu and flu vaccines are listed on the page Musings: Influenza (Swine flu).
Why did the HIV vaccine work for some people? (September 27, 2011). This post raises some similar issues for an HIV vaccine.
Where are the eyes?
August 19, 2011

|
The picture shows a purple sea urchin (Strongylocentrotus purpuratus). It was photographed off the Southern California coast; these purple sea urchins are common around there. The organism is responsive to light. The question for you is: Where are the eyes? Think about that before reading on.
Source: Figure is reduced from main figure at Strongylocentrotus purpuratus (Stimpson, 1857). The photo -- and the page, with more information and more beautiful photos -- is by Dave Cowles, Walla Walla University.
|
According to recent work, that's it. What you see above is the eye. That is, the organism is the eye.
Biologists have long struggled to understand vision in echinoderms (the group containing the starfish and sea urchins). Responsiveness to light is common -- though varied. Anatomical explanations have been uncertain. They don't seem to have any eyes.
The new work starts with the genome sequence for the sea urchin, published just a few years ago (2006). That genome sequence revealed not only genes for photoreceptors but for other genes that were recognizably "retina" genes. This gave them some key molecules to look for. Now, they stain animals and look for the proteins. Where are they? In the "feet" -- the hundreds of tube feet that serve as something like suction cups on the bottom of the animal. Closer examination suggests specific structures in the tube feet -- structures that would seem to be special centers for light reception, i.e., retinas.
This is an interesting application of genome analysis. But the answer described above is not what I said earlier. The genome analysis led to them finding retinas on the tube feet, but I said earlier that the organism is the eye. There is more to this story.
News story: Sea Urchin Body Is One Big Eye -- Prickly critters may use their feet as retinas, study says. (National Geographic News, May 2, 2011. Now archived.)
The article: Unique system of photoreceptors in sea urchin tube feet. (E M Ullrich-Lüter et al, PNAS 108:8367, May 17, 2011.)
A previous post with the same title: Where are the eyes? (December 16, 2009). Animal vision is a fascinating topic!
More on echinoderms: Where is the front of the circle? How a brittle star moves (July 3, 2012).
More on animal vision:
* An eye that forms an image using a mirror (February 13, 2018).
* A see-shell story (February 21, 2016).
* Color vision: The advantage of having twelve kinds of photoreceptors? (February 21, 2014).
* An old eye (November 1, 2011).
More about sea urchins: Increased CO2: effect on animals that make carbonate skeletons (January 11, 2010).
August 17, 2011
Speech: Taking turns
August 17, 2011
A recent Musings post was on the ability of chimpanzees to listen [link at the end]. The big theme was that human language requires more than just the ability to speak. Exploring these other aspects in other animals may offer insights into the development of human language. In that post, we looked at the ability to listen -- a necessary component of language. In this post, we look at the ability to "take turns" in a "conversation". In the new work, scientists examine the ability of a very talkative type of monkey to respect the taking-turns rule.

|
Here is one of their experiments. This is from Figure 2 from the paper.
The basic test is to expose a monkey to a vocal stimulus, and measure its response. They use two types of vocal stimulus, both based on recordings of actual calls. One, called "appropriate", consists of calls alternating between two speakers; this reflects normal conversation, with taking turns. The other, called "inappropriate", consists of calls that do not alternate between two speakers; this is not normal conversation, because the taking-turns rule is violated. They measure how long the animal looks toward the source of the calls; that is the "gaze response" -- the height of the vertical bars in the graph. They do the test for adult and young monkeys.
|
First, look at the left side, for "adult" monkeys. You can see that the adults show a higher gaze response to the "appropriate" signal (darker bar, to left in each pair) than to the "inappropriate" signal (lighter bar, to right in each pair). That is, the adults seem to distinguish whether what they hear is "normal conversation", and they "pay attention" more if it is.
Now look at the right side, for "young". The two bars are about the same height, and intermediate between those for adults. That is, the young do not seem to focus on a "conversation", nor do they ignore a "non-conversation". They do not seem to make any distinction.
|
In summary, then, the young do not seem to know the rule for taking turns in a conversation, but adults do. This is similar to what is found for humans. That is, "taking turns" is a rule that develops -- and it does so in this monkey and in humans.
As always, it is important to note the limitations, and to be cautious about over-interpreting the results. We do not know if the rule develops from learning, or from innate development. We do not know if it develops the same way in both monkey and human. And even with these two examples, we must not assume it occurs for all related animals. In fact, they suggest that chimps do not respect the taking-turns rule. At the end of the paper, they offer a good discussion of how one might interpret the new work, including its limitations.
The article is short and much of it is quite readable. I encourage you to have a look. It is freely available: Youngsters do not pay attention to conversational rules: is this so for nonhuman primates? (A Lemasson et al, Scientific Reports 1:22, June 23, 2011.)
Background post: Speech: Are chimps good listeners? (July 25, 2011)
Other posts on language include:
* How children acquire language skill: the role of conversation (December 3, 2018).
* Can chimpanzees learn a foreign language? (March 10, 2015).
* Mountains and human language? (June 28, 2013).
For more on monkeys...
* The first chimeric monkeys (February 5, 2012).
* Prejudice against outsiders -- in monkeys (May 10, 2011).
Central Dogma of Molecular Biology
August 16, 2011
In the late 1950s our modern understanding of genes was just beginning to emerge. Genes were made of DNA. DNA acted through an RNA intermediate, called messenger RNA (mRNA), to code for proteins. The linear sequence of bases in the DNA -- and the mRNA -- determined the linear sequence of amino acids in the proteins. It's all well understood at this point -- but it was the exciting leading edge of science around 1960.
In 1957 Francis Crick -- co-discoverer or the structure of DNA just four years earlier, and one of the great thinkers of this era of molecular biology -- proposed a bold idea to tie together how we think of the various possible transfers of information between DNA, RNA, and protein. The core of the idea was that DNA and RNA -- the two types of nucleic acid -- shared a language (bases, or nucleotides). Proteins used a different language (amino acids). Crick proposed that the transfer of information between these languages occurred only in one direction: from nucleic acid to proteins. Explicitly, he noted that sequence information cannot be directly passed from protein. This idea became known as the Central Dogma of Molecular Biology.
There are various ways to formulate the Central Dogma. The figure below, which is Figure 3 of Crick's 1970 paper, is one useful modern way.
|
The figure shows the three informational macromolecules -- those that have sequence information. There are three solid arrows, for the three major common processes: DNA → DNA (replication), DNA → RNA (transcription) and RNA → protein (translation). There are three dashed arrows. Each of these is for a process that is allowed by our understanding of molecular biology, but which is not one of the common processes. Two of these are known to occur in biology (RNA → RNA and RNA → DNA). The third (DNA → protein) can be shown in the lab under special conditions, but has not been found in nature. Importantly, three possible processes have no arrow: the three processes that start with protein. These three processes are "forbidden" -- by our understanding of biological information and how it is transferred. None of these forbidden processes has ever been found; if one is found, it would be a serious challenge to our understanding.
|
Crick first enunciated the Central Dogma in a 1957 lecture, and it was then developed further in a 1958 symposium article (which is reference #4 of the paper listed below, and seems not to be available online). At the time it was very bold -- well beyond clear knowledge at that point.
In 1970, the process of reverse transcription was discovered (in certain viruses that have RNA genomes). This involves RNA → DNA -- the reverse of the common process of how RNA is made. Some jumped on the Central Dogma, claiming it had been overthrown. Crick responded with the article listed here. Not only did he rebut the challenge, but it was a good time to re-state and develop the ideas of the Central Dogma, now using the further knowledge of the 1960s.
The challenge was based on a misunderstanding of what the Central Dogma said. It is sometimes stated as DNA → RNA → protein. That's shorthand -- easy to type, but not a complete statement of what Crick said or meant. The 1970 paper emphasizes the true central point of the Central Dogma: that sequence information cannot get out of proteins. The Central Dogma still stands, and this paper is a very readable discussion of this most basic idea of modern biology.
The article: F Crick, Central dogma of molecular biology. Nature 227:561, August 8, 1970. Here is a freely available copy: A pdf of the article as it appeared in Nature. This is part of the NIH Profiles in Science site.
Also see...
* Exploiting the bacterial immune system as a tool for genetic engineering: The Caribou approach (May 4, 2013).
* A novel type of polymer -- and its possible relevance to the origin of life (March 15, 2013).
* How an octopus adapts to the cold -- by RNA editing (March 5, 2012). A example of gene function being more complex than the basic Central Dogma would suggest.
* The original Watson-Crick paper on the structure of DNA (October 25, 2010). Another post on molecular biology history -- also involving Francis Crick.
* On the road to life? (May 18, 2009). A post on the origin of RNA notes the Central Dogma.
* Previous post of historical item:
The first report of a new planet (March 13, 2011).
* Next: Benjamin Franklin and the electrical kite (November 22, 2011).
My page Internet resources: Miscellaneous contains a section on Science: history. It includes a list of related Musings posts.
Crick's 1970 paper on the Central Dogma is noted on my page of Internet Resources for Molecular Biology, in the section Chapter 3 (Protein structure).
Quark soup
August 15, 2011
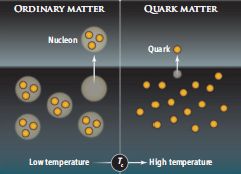
Ice crystals consist of water molecules that are held together to form a recognizable higher order structure. If you put enough energy into an ice crystal, the interaction between the water molecules is overwhelmed; the crystal loses its structure, leaving a collection of individual water molecules loosely interacting in the liquid state. We call this behavior "melting"; for water-ice, it occurs at a temperature of 273 K (0 °C).
Somewhat analogously, neutrons and protons -- the familiar particles of the atomic nucleus, and collectively called nucleons -- each consist of three quarks. Perhaps, if one put enough energy into the nucleons, the interaction between the quarks would be overwhelmed, leaving a collection of quarks, loosely interacting in a liquid-like state.
A new paper reports that this happens. What's particularly important is that theory and experiment are in good agreement on how much energy is needed. Agreement between theory and experiment suggests that physicists understand what is happening. How much energy does it take? In the language of the plasma physicists, it takes about 175 million electron-volts (MeV) to melt nucleons. They convert this energy value to the common temperature scale using the Boltzmann constant (1 eV = 11605 K); it's about 2x10¹² K -- two trillion Kelvins.
|
A cartoon showing the "melting" of nucleons (protons or neutrons). The nucleons contain quarks in threes; at high temperature, there is a "soup" of free quarks.
|
Do we care? Well, aside from it representing an advance in our basic understanding of matter, the universe presumably went through the reverse of this transition shortly after the Big Bang. Thus this paper helps with our understanding of the early universe.
We started this post with ice crystals. Adding energy (raising the temperature) broke the crystals down to their components, the water molecules. Adding more energy would break down the water molecules to their components, the atoms of hydrogen and oxygen. And so forth. The new work is about a later stage, where the individual nuclear particles (nucleons) are broken down to their components, the quarks. The Big Bang created a very hot universe; as the early universe cooled, the same kinds of processes occurred -- in reverse. It's thought that the state of the universe was something like what was achieved here for about a microsecond -- starting about 10-12 second after the Big Bang. When the universe had aged to about 10-6 second, it had cooled enough that the quarks combined to form particles such as protons and neutrons. This brief time when quarks dominated the universe is known as the quark epoch. [Wikipedia: Quark epoch.]
After reading a draft of this post, a physicist offered some other energy numbers -- in the same units -- for comparison. He notes... Separating the proton and electron of a hydrogen atom takes ~10 eV. Separating the proton and neutron of a deuterium nucleus takes about 2 MeV -- about 200,000 times more. We now see that "melting" nucleons, to make something like a liquid phase of quarks -- takes 175 MeV -- another 100 times that.
News story: When Matter Melts: Scientists Map Phase Changes in Quark-Gluon Plasma. (Science Daily, June 24, 2011.) Good overview.
* News story accompanying the article: Physics: The Limits of Ordinary Matter. (B Müller, Science 332:1513, June 24, 2011.) The figure above is from this article. This is actually a rather readable overview of some complex physics. Give it a try!
* The article: Scale for the Phase Diagram of Quantum Chromodynamics. (S Gupta et al, Science 332:1525, June 24, 2011.) The article is an interesting international collaboration between scientists in India, China, and the USA (Lawrence Berkeley). The lead author is a theoretical physicist from the Tata Institute of Fundamental Research in Mumbai. The experimental results, which were previously published, are from Brookhaven National Lab in New York state. In fact, the current paper involves interpreting the earlier experimental results in terms of the energy requirement for the nucleon → quark transition.
Also see:
* 3D printing: Make yourself a model of the universe (December 19, 2016).
* On the testability of scientific models (March 14, 2015).
* IceCube finds 28 neutrinos -- from beyond the solar system (June 8, 2014).
* The proton -- and a 40 attometer mystery (March 17, 2013).
* A galaxy far, far away: the story of MACS 1149-JD (October 12, 2012).
* Discovery of the neutron: 80th anniversary (February 27, 2012).
My page of Introductory Chemistry Internet resources includes a section on Nuclei; Isotopes; Atomic weights. It includes a list of related Musings posts.
The Hobbits: a dissent
August 15, 2011
Original post: The little people of Indonesia (May 14, 2009).
This is about some fossils of little humans -- commonly referred to as hobbits -- found in Indonesia a few years ago. They are of small stature, and the one skull is quite small. Some scientists suggest that these fossils represent a novel species of human.
Among the points noted in the original post was that the skull was deemed to be inconsistent with a known human defect called microcephaly. A new paper challenges that. Their new measurements suggest that microcephaly cannot be excluded. Importantly, they do not argue that the hobbit skull is microcephalic, only that it might be. The news stories note that the authors of the old and new studies disagree on much about the measurements.
Bottom line, the new paper changes the status of this story very little. There is still only one skull -- though there are other parts of several individuals. Prior to this paper, there was no clear conclusion about the nature of the hobbits; that is still true. It is likely that making more measurements of this one skull will not resolve the issue. What is needed is more specimens -- or some DNA. A breakthrough, as the paper notes. I note the new paper here mainly because it does challenge a fact stated in a previous post.
News story... 'Hobbit' just a deformed human? (Nature News, August 8, 2011.)
The article: Craniometric ratios of microcephaly and LB1, Homo floresiensis, using MRI and endocasts. (R C Vannucci et al, PNAS 108:14043, August 23, 2011.)
August 10, 2011
Can genes be patented? The Myriad case -- Reversal
August 10, 2011
Among the posts in this story...
* Can genes be patented? The Myriad case (April 2, 2010). Original post.
* Can genes be patented? The Myriad case: The Last Word (June 26, 2013).
Briefly, in that original post, we noted that a court had ruled invalid a set of patents on isolated genes. The current news is that an appeals court has overturned that decision. That is, the gene patents are now legal.
Please read the original post before trying to make much of this. Remember, the issues here are legal -- and there are disagreements. In fact, the new ruling was by a split vote. There are also more parts to the story than noted in my brief summary above.
News stories...
* Court of Appeals Rules that Myriad's Patents on BRCA Genes Are Valid. (GEN, July 29, 2011.) Not particularly well written, but it does give an overview of the various issues.
* Myriad Genetics Ruling That DNA Is Patent-Eligible. (Corporate Law Report, August 3, 2011. Now archived.) Links to multiple legal commentaries.
Gene therapy: Curing an animal using a ZFN
August 9, 2011
The idea of curing a genetic disease by providing a functional copy of the gene is called gene therapy. The general approach is to provide a good copy of the gene, and somehow get it to replace the bad copy -- physically or at least functionally. This may involve replacing the defective copy, fixing it, or simply adding a good copy. People have been working on gene therapy since the 1980s -- with some but limited success.
Among the approaches is to replace the bad copy with a good copy. This "should" work; the good and bad copies are homologous (very similar in DNA sequence -- except at the site of the mutation), and this homology should drive the incoming copy to the site of the defective copy, where it can then recombine into the genome. A key problem is that things are not so simple in the complex cells of higher organisms. It turns out that in higher organisms recombination is only partially driven by homology; it is also driven by breaks in the DNA. Because of that, attempts at gene therapy often lead to the new gene being inserted into the genome at a random site -- with unpredictable and sometimes bad consequences. Targeting by homology just is not sufficient with animals.
Enter the zinc finger nuclease -- or ZFN. The ZFN addresses that problem: it helps to target the incoming (good) gene to the defective gene. In the new work, they show that they can achieve a clinically useful treatment of a disease (hemophilia) in a mouse model using their ZFN system. Let's look further...
What is a ZFN, and how does it work? Well, a ZFN is an artificial construct combining a zinc finger and a nuclease -- a ZF and an N, I suppose. Zinc fingers (ZF) are small protein structures (domains) organized around a zinc ion. The original discovery of ZF in natural proteins -- ones that were known to regulate DNA function -- suggested that each such domain (or "finger") recognized a specific DNA sequence. Over time, scientists learned to make ZF "to order" to recognize specific DNA sequences of interest.
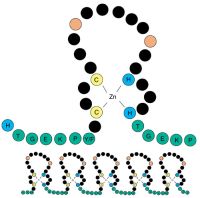
|
Cartoons showing the idea of zinc fingers in proteins.
The upper part shows a part of a protein, with a single zinc finger; each circle is one amino acid. You can see that four amino acids bond with the Zn ion. (As shown here, it is common that two of those are cysteine and two are histidine -- denoted by C and H.) The upper loop is the "finger"; its precise sequence determines what it binds to.
The lower part of the figure shows a longer protein, with five zinc fingers. Using more than one ZF increases the specificity. Natural ZF proteins typically contain several ZF, as do the designed ones used here.
This is Figure 1 of an old paper, freely available at: Identification of conserved C2H2 zinc-finger gene families in the Bilateria. (R D Knight & S M Shimeld, Genome Biology 2:16, April 24, 2001.)
|
Thus ZF are used to target something to a DNA sequence. In a ZFN, the ZF has been combined with an N -- a nuclease, to cut DNA. The ZF serves to target the nuclease. That is, a ZFN is a device to cut DNA at a selected region. What good does that do? As suggested above, the resulting break stimulates DNA recombination, thus targeting the corrected gene to the right site. Administering a ZFN along with the corrected gene should increase the efficiency of gene therapy. The idea is rather logical; as so often, the problem has been working out the details to make it work effectively in practice. The current work offers an example in vivo -- in an animal system.
|
Here are some of their results, showing that the ZFN method was effective in vivo. This is Figure 5b from the paper.
The graph shows coagulation times for blood from four sets of animals. The left hand set is for wild type (WT) mice -- normal mice. The right hand set is for the mice with hemophilia (HB). The blood from the HB mice coagulates more slowly (about 65 seconds, in this test) than the blood of the WT mice (about 35 seconds). The set labeled "ZFN + donor" is for the treated mice: HB mice that received the ZFN and the corrected (donor) DNA. Their coagulation time is near that of the normal WT control -- and much better than the HB control. The other set of data, labeled "Mock + donor", is for another control, in which the ZFN was omitted. This showed little correction of the defect. That is, including the ZFN substantially enhances the correction.
|
The gene correction is not very efficient. They measured the level of the clotting factor; it is only 2-3% of normal in the treated animals. However, that is enough to be clinically meaningful, as the clotting results above show. Overall, then, the results are encouraging, while still showing the limitations of the system. Treatment of whole animals using ZFN works, though inefficiently. In some cases, such low level gene function as they achieved here would be of clinical benefit. However, it will also be good to work to improve the system further.
News story: Genome Editing -- A Next Step in Genetic Therapy -- Corrects Hemophilia in Animals. (Science Daily, June 27, 2011.)
The article: In vivo genome editing restores haemostasis in a mouse model of haemophilia. (H Li et al, Nature 475:217, July 14, 2011.)
Other posts on gene therapy and related issues include...
* CRISPR: an overview (February 15, 2015). It includes a complete list of Musings posts on various gene-editing tools, including CRISPR, TALENs and ZFNs.
* Another application of ZFN: Down syndrome: Could we turn off the extra chromosome? (November 15, 2013).
* Exploiting the bacterial immune system as a tool for genetic engineering: The Caribou approach (May 4, 2013).
* Gene therapy: Could we now treat Queen Victoria's sons? The FIX Fix. (January 6, 2012). A clinical trial of a gene therapy treatment in humans.
* Reversing Alzheimer's disease (March 4, 2011).
* The flying vaccinator (April 13, 2010).
Other posts on zinc fingers...
* How arsenic works against a cancer (June 16, 2010).
More on the biology of zinc: The role of zinc in arthritis (July 18, 2014).
For more on gene therapy, see my page BITN: Agricultural biotechnology (GM foods) and Gene therapy.
What else are feet good for?
August 8, 2011
|
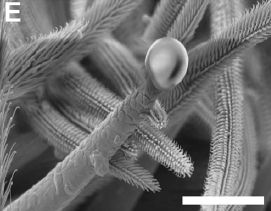
Electron micrograph (SEM) of part of a tarantula foot -- making silk. This is Figure 5E of the paper. Scale bar for this part is 20 µm.
From the figure legend: "Fig. 5. Silk-secreting spigots on tarantula spinnerets (SEM images). ... (E) Indian ornamental spigot shank with scale-like ornamentation and a silk droplet at its tip."
Spiders commonly make silk for webs or other structures; the silk is extruded from spinnerets on the abdomen. The new paper shows that tarantulas also extrude silk from their feet; the silk is used to help them hold on to vertical surfaces -- sort of like a climbing rope.
|
News story: Tarantulas Shoot Silk From Feet, Spider-Man Style -- To keep balance, spiders spin silk using foot "spigots". (National Geographic, May 16, 2011. Now archived.) Features a picture of the lead author's pet tarantula. Good overview of the work.
* News story accompanying the article: Tarantulas shoot silk from feet. (K Knight, Journal of Experimental Biology 214(1):i, June 1, 2011.)
* The article: Tarantulas cling to smooth vertical surfaces by secreting silk from their feet. (F C Rind et al, Journal of Experimental Biology 214:1874, June 1, 2011.) The paper starts with a discussion of the controversy about an earlier report that tarantulas might make silk on their feet. It ends by discussing the possibility that silk production in the feet was the primitive form in spiders, with abdominal production coming later.
More about silk: Spider silk: Can you teach an old silkworm new tricks? (October 13, 2010).
More about spiders and such:
* Why do many tarantulas have blue hair? (March 7, 2016).
* Tarantulas in the trees (November 11, 2012).
* How the spider avoids being attacked by the ants (January 10, 2012).
* How to seat a spider in front of the computer (September 28, 2010).
More about feet: A shoe (August 9, 2010).
How do you tell if bees are pessimistic?
August 5, 2011
A person who is pessimistic is likely to interpret an ambiguous stimulus more negatively than a person who is optimistic. Is this true for bees?
A group of scientists at Newcastle University have developed a way to test how bees respond to an ambiguous stimulus. Using this test, they show that how the bees respond varies with the situation. One reasonable interpretation is that their test measures pessimism in bees.
As we look at their story, it is important to first understand the factual parts: what they did, and what the results were. Interpretation follows after we understand the results.
|
Here is a key experiment. This is Figure 3 of the paper.
|
|
The general plan is that the bees are trained to associate one odor with a reward (food), and another odor with lack of reward (no food, or even something noxious). The odors used in training (and testing) are actually mixtures of two chemicals; the ratio is varied.
Here, trained bees are tested against various odors -- various combinations of the two odor chemicals. These are shown on the x-axis as the ratio of the two chemicals. The one at the left (labeled "1:9") is the mixture used during training for "reward"; the one at the right (9:1) is the one used during training for "no reward". The three mixtures in the middle are intermediate mixtures, which the bees have not encountered before; perhaps they will be "ambiguous" to the bees.
The y-axis shows the response of the bees. More specifically, it is the fraction of the bees that responded to the odor by extending their proboscis -- to accept food.
|
Observations...
* First look at the control curve (upper, open symbols). The response is higher for the "reward" stimulus (left side) than for the "no reward" stimulus (right side) -- as expected. The responses for intermediate stimuli are intermediate. These novel, intermediate stimuli are ambiguous to the bees, and the response decreases as the odor mixture moves from having more of the "reward" odor to more of the "no reward" odor. I think it is fair to suggest that this control curve is about what one might expect; it shows that the experiment is working well.
* Now look at the lower curve (closed symbols), for "shaken" bees. These bees have been agitated by shaking them, and then tested the same way. The response is similar, but fewer bees respond positively to each mixture.
|
What does all this mean? It seems fair to say that the results show that the shaken bees respond to the ambiguous stimuli more negatively ("not food"), compared to control bees. The authors describe the results by saying that the shaken bees show a "negative cognitive bias"; that is, they are pessimistic.
Some may wonder whether it is proper to try to interpret work with bees using terms we use for human behaviors or emotions. But that is precisely what makes this so fascinating. We accept that some non-human (and non-verbal) animals have emotions. If we find similar behaviors in an insect, should we not allow that the insects, too, may have emotions? The authors lay out this challenge in the final paragraph of the paper -- worth reading even if you read little more. This doesn't mean that they have proven that bees show what we might call human emotions. It means that they have opened a pathway to exploring the question. This forces us to develop clear ideas of what we mean by such terms. The authors understand that they need further work, to help distinguish alternative interpretations.
News story: Honeybees Might Have Emotions. (Wired, June 17, 2011.)
Video. It is a brief discussion of the work by the authors, and includes some clips of the experimental work. It is available at the article web site (below), labeled as a video abstract or as supplementary information. It is also at YouTube video: Pessimism in honeybees.
The article: Agitated Honeybees Exhibit Pessimistic Cognitive Biases. (M Bateson et al, Current Biology 21:1070, June 21, 2011.)
More on bee personalities: Novelty-seeking behavior (May 26, 2012).
Other posts on bees include... The traveling bumblebee problem (January 11, 2011).
For more on emotions in non-primate animals: Rats will free prisoners, and share their chocolate with them (January 18, 2012).
More on use of odor tests: What happens if you block the left nostril of a mole's nose? (April 19, 2013).
August 3, 2011
Aerospace engineers develop explosive device for supersonic delivery of vaccines
August 2, 2011
Vaccines without painful -- and expensive and hazardous -- needles. Many are working on some substitute for the traditional injection. We have noted one example before: A better way to deliver a vaccine? (July 25, 2010).
Now we have a new approach -- and it certainly is an exciting approach. The lead authors of the paper are from the Department of Aerospace Engineering at the Indian Institute of Science, Bangalore. Their basic approach is to put an explosive device on the skin (at the site of the intended injection), ignite it -- and, voila, you are injected.
How big an explosion? In terms of TNT (trinitrotoluene)... The explosions here are equivalent to 0.168 milligrams of TNT. (That's about 2x10⁻¹⁰ tonnes of TNT.) The explosion is big enough to generate supersonic shock waves -- at a very tiny area: the injection site. That's really the point. It is the energy of the shock wave that delivers the injection sample into the skin.
|
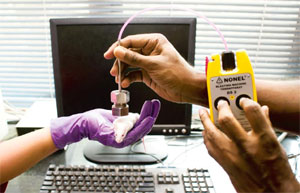
The figure at the left shows the injection device in use.
The paper claims that the injections do not seem to cause pain in the mice. They argue that this is reasonable, since the injection is not deep enough to reach sensitive nerve endings.
This figure is from the news story listed below.
|
The figure at the right is a diagram of how the device works. The "polymer tube" is lined with explosive. It's ignited at the top, and the explosion wave moves downward. Overall, firing the device leads to injection of the sample through the 300 µm hole into the "target" (a piece of gel, in this case).
This is Figure 1C from the paper.
|
|
In the paper they present data to show that vaccinating mice with this device is effective -- as effective as ordinary vaccination. (In fact, they have some evidence that the vaccination is more efficient, thus allowing use of lower doses. The greater efficiency may be a general property of vaccination in the skin per se.)
What should we make of this? They have developed a novel system for administering vaccines (or drugs, such as insulin) into the skin. Animal testing shows that the device works. They hope to start testing with humans. The news story discusses some of the economics of the device -- indicating that the authors have at least considered that important issue. Ultimately, the value of the device will depend on whether it is safe and effective -- and economical and practical -- with humans. It is a candidate for that further testing. Time will tell.
News story: IISc designs India's first needleless drug device. (Live Mint, February 22, 2011. I am unfamiliar with Mint -- or Live Mint. Mint is apparently a business-oriented newspaper in India.)
The article: Needleless Vaccine Delivery Using Micro-Shock Waves. (G Jagadeesh et al, Clinical and Vaccine Immunology 18:539, April 2011.) The Introduction notes other medical applications of shock waves.
More on shock waves...
* What happens when the cork is removed from a bottle of champagne? (October 27, 2019).
* Blast detector (December 29, 2010).
More things supersonic: Introducing Supersonus -- it stridulates at 150,000 Hz (June 16, 2014).
More on needleless delivery of vaccines: The nasal spray flu vaccine: it works in the UK (April 12, 2017).
More on vaccines is on my page Biotechnology in the News (BITN) -- Other topics under Vaccines (general).
Energy wastage: The set-top box
August 1, 2011
This is perhaps a political post, but it is about a science topic -- a topic which should be of interest. It's based on an article in the New York Times. This is generally a good source, so we'll just use their article here. That doesn't mean we take everything they say at face value; what's important here is the issues they raise, and some basic background facts.
The basic issue is simple: In the US, the "set-top boxes" for televisions are consuming about three billion dollars (3 gigabucks) of electricity per year -- with two thirds being wasted. When we say wasted, that is not a commentary on our addiction to the tube. That is the energy wasted when the box is doing nothing, yet is fully on.
The article gives an overview of the facts, and gives a range of perspectives, including comment from US industry. The US is one of the most energy-wasteful countries; American industry gets much of the blame. However, they will argue that we get what we demand. They do respond to the public -- if we express our needs either through our purchasing decisions, or through government regulation. So perhaps we are to blame. Perhaps it is time...
Anyway, I think this is an article worth reading -- and worth thinking about. Atop TV Sets, a Power Drain That Runs Nonstop. (New York Times, June 25, 2011.)
If you have conflicting information or other views, let me know.
More about energy usage by your home electronics: Impact of watching movies on global warming (September 30, 2014).
Also on energy efficiency...
* A path toward reduced global warming based primarily on improving energy efficiency? (July 24, 2018). A major discussion of energy efficiency; the set-top box is one of the specifics noted.
* The Happy Planet Index (December 27, 2011).
* Sustainable Energy - without the hot air (September 16, 2009).
There is more about energy on my page Internet Resources for Organic and Biochemistry under Energy resources. It includes a list of some related Musings posts.
Baseball physics
July 31, 2011
Bat meets ball -- the crack of the bat. A distinctive sound. The essence of the American "national pastime".
It's a simple physics problem. A collision. If the ball simply hit a solid wall, it would bounce back. But it hits a swinging bat, and the energy of the bat is transferred to the ball. Analyzing collisions is a mainstay of physics. However, there is a catch: collisions vary in how the energy is transferred. In an idealized elastic collision, the transfer of energy as kinetic energy (energy of motion) is complete. However, when one drops a mudball on a floor, the ball does not bounce back at all; this is an inelastic collision. Real collisions may have elasticity anywhere between these extremes.
So, how well is kinetic energy transferred between bat and baseball? That is, how elastic is the bat-ball collision? It depends -- on the nature of the bat and the ball. A new paper explores how the elasticity of the collision varies with certain conditions, such as the temperature and humidity of ball storage, and whether the bat is "corked".
In this work, they measure the coefficient of restitution (COR), using bats and balls with various treatments. The COR is a measure of the elasticity of the bat-ball collision. A COR of 1 would be a completely elastic collision. A COR of 0 would be a completely inelastic collision. A bat-ball collision with higher COR means that the ball will go further; a higher COR would lead to more home runs.
|
Here are two examples of their findings, shown together in Figure 4 of the paper. Both of these deal with how baseballs are stored prior to use.
In one experiment, they looked at the effect of humidity. Balls were stored at various humidities for six weeks, all at the same temperature (72 °F, which is about 22 °C). Measurements of ball weight showed that it took 1-3 weeks for the balls to equilibrate to the new humidity. Balls stored at the various humidities were then tested for their COR. These results are shown with open symbols and the dashed line; the scale for relative humidity is at the bottom.
In the other experiment, they looked at the effect of temperature (T). Balls were stored at various temperatures for 24 hours. Balls stored at the various temperatures were then tested for their COR. These results are shown with solid symbols and the dotted line; the scale for T is at the top.
|
You can see that storing the balls at higher humidity leads to a decline in COR, as you might expect. You can also see that storing the balls at higher T leads to an increase in COR. The reason for this is not entirely clear; it may be in part due to moisture changes. The big conclusion is that ball storage conditions matter.
News story: The Physics of Cheating in Baseball. (Smithsonian, June 24, 2011.)
The article: Corked bats, juiced balls, and humidors: The physics of cheating in baseball. (A M Nathan et al, American Journal of Physics 79:575, June 2011.)
One aspect of the paper bothers me. The title of the paper refers to cheating -- an aspect picked up on by many of the news stories. However, only one of the variables they study in the paper (corked bats) involves a possible cheating -- where what they study is subject to rules. In fact, the word cheating does not appear in the paper except in the title. The paper is about the physics of baseball. It is unnecessary to bring up cheating in order to discuss the paper.
The particular experiments shown above were motivated in part because one major league baseball team in fact stores baseballs at higher humidity in order to reduce home runs. The work shows that this may work as they hoped. So far as I know, there is no cheating here; there are no rules on ball storage. Perhaps there should be -- guided by work such as reported here.
Baseball fans will enjoy reading what they did with corked bats -- and will perhaps be surprised at their results.
More baseball...
* Effect of climate change on baseball games (June 10, 2023). Links to more.
* The origins of baseball -- two million years ago? (August 18, 2013).
* The Mudville story, on its 125th anniversary (June 3, 2013).
* Baseball and violins (May 15, 2012).
Other posts about sports...
* The turtle that plays basketball (November 12, 2010).
* Flow centrality: the key to a scientific analysis of the soccer game (July 11, 2010).
* Athletes: Head injuries (October 5, 2009).
There is now an extensive list of sports-related Musings posts on my page Internet resources: Miscellaneous under Sports.
More about bats: How to find the blood (August 29, 2011).
More about collisions: Sandstorms and midair collisions (September 16, 2013).
More about cheating: Are bankers fundamentally dishonest? (January 23, 2015).
Recovery of breathing following spinal cord injury
July 29, 2011
One serious consequence of some spinal cord injuries is loss of the ability to control the diaphragm, hence the loss of the ability to breathe without the aid of a machine. Problems with ventilator machines are a leading cause of death for such people.
A new paper, from a team at Case Western Reserve University led by Dr Jerry Silver, reports successful correction of the breathing problem in a model system with rats. The approach is logically straightforward, and involves a combination of two methods. One is a nerve graft, to span the injured part of the spinal cord. The other is an enzyme treatment, that removes "scar tissue" from the area. The approach is outlined in the video listed below.
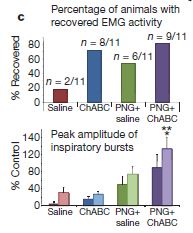
The following figure shows some of the results. This is Figure 2c from the paper.
There are four conditions tested here; they involve all possible combinations of the two methods: enzyme and nerve graft. The labeling is not very clear, so let's go through them. From left to right...
* The first (at the left) is labeled "saline"; this is a control for the enzyme. That is, the first condition is "nothing" -- no enzyme, and no nerve graft.
* The second condition is labeled ChABC; that is their shorthand for the enzyme. The second condition, then, is enzyme but no nerve graft.
* The third condition is labeled PNG + saline. PNG means "peripheral nerve graft"; saline, as noted above, means no enzyme.
* Finally, the right hand results are labeled PNG + ChABC; that is nerve graft + enzyme, the full double treatment.
That is, the left-hand bars are for a control: no treatment. The next two conditions each involve one of the two methods, and the right-hand condition involves both methods.
|
|
The upper graph shows the number of animals that regained some breathing activity. Briefly, you can see that treatments with enzyme, nerve graft or both all showed some success by this measure. That is, all were higher than the control (at left). (EMG = electromyography; it is a method for measuring muscle activity, in this case of the diaphragm.)
The lower graph shows a measure of the quality of the breathing. There are two bars for each treatment. For now, just look at the right bar of each pair -- the one with the lighter color. You can see that the right hand condition (the full PNG + ChABC double treatment) is clearly the best, coming in at a little over 100% of normal. (For each treatment they show the results for quality of breathing two ways. The left-hand bar of each pair shows the average over all of the animals; the right-hand bar shows the average over just the animals that showed benefit. The latter seems the more appropriate measure of quality of breathing obtained.)
|
These are the best results ever obtained for restoration of breathing in this model system. The "secret" is to provide conditions suitable for the nerves to make proper new connections. Somehow, the nerves do that -- if given a chance.
This paper reports a remarkable result, with implications for human health. However, we must always be cautious in our enthusiasm for reports of medical advances in model systems. The work here is in rats -- rats with injuries neatly provided by the researchers. It remains to be seen how much of the story translates to humans with real injuries. The proof of the pudding is in the breathing -- breathing of a paralyzed human.
Video: YouTube: Restoring breathing after spinal cord injury. A short video, from the university. It gives a useful overview of the work.
News story: Breathing Restored After Spinal Cord Injury in Rodent Model. (Science Daily, July 14, 2011.)
* News story accompanying the article: Regenerative medicine: Drawing breath after spinal injury. (K Zukor & Z He, Nature 475:178, July 14, 2011.) Includes a nice diagram showing what was done.
* The article: Functional regeneration of respiratory pathways after spinal cord injury. (W J Alilain et al, Nature 475:196, July 14, 2011.)
Also see:
* If lungs fail, can you breathe with your intestines? (July 16, 2021).
* How do you breathe while changing your skeleton? (October 31, 2014).
* Therapy based on embryonic stem cells: the first clinical trial (October 23, 2010). This initial trial involves treating spinal cord injury.
More about regeneration is on my page of Biotechnology in the News (BITN) for Cloning and stem cells. It includes an extensive list of related Musings posts.
July 27, 2011
Quiz: Barack Obama and polar bears -- answer
July 27, 2011
Original post: Quiz: Barack Obama and polar bears (July 20, 2011). As a reminder, the quiz simply asked... "What do Barack Obama and polar bears have in common -- in terms of their ancestry?"
The answer is now included at the end of the original post.
Berkeley Bionics: From HULC to eLEGS -- Follow-up
July 26, 2011
Original post: Berkeley Bionics: From HULC to eLEGS (October 22, 2010).
UC Berkeley professor Homayoon Kazerooni, the man behind Berkeley Bionics and its devices to assist human locomotion, gave a talk in July at the Science@Cal series. Kazerooni is head of the Berkeley Robotics and Human Engineering Laboratory at UCB, and founder of Berkeley Bionics. The talk emphasized his philosophy of developing devices to meet real needs -- and keeping them as simple as possible within that context. It included recent work, beyond what Berkeley Bionics has. Those interested in the development of robotic systems or in the issues of enhancing human locomotion may find this talk of interest.
The video of the Science@Cal talk is posted at: Exoskeleton Systems for Medical Applications. (Homayoon Kazerooni, Science@Cal, July 16, 2011.)
I have added this information both to the original post about Berkeley Bionics (above) and the post about the Science@Cal series: Astronomy talks (June 22, 2009). Again, a reminder... What started as a series of astronomy talks, celebrating the International Year of Astronomy, has morphed into a series of talks covering the breadth of the sciences. Check out the Science@Cal listings!
Next post on robots: Wings for better walking (November 5, 2011).
Berkeley Bionics is now Ekso Bionics.
Speech: Are chimps good listeners?
July 25, 2011
Speech and language are distinctive parts of being human. One part of speech is listening. Speech would not be very useful unless we could listen. Listening includes anatomical issues (ears), and neurological issues (interpreting the sounds). How did all these various aspects of speech and listening develop? We know something about the anatomical features, but much less about the neurological aspects. Is the ability to listen -- the ability to distinguish and interpret the sounds of speech -- already present in pre-speaking ancestors? Did the abilities to speak and to listen develop side by side?
A new paper was motivated by questions such as those. Briefly, they investigated the ability of a chimpanzee -- one who was well trained to understand human speech -- to understand distorted speech.
The figure below shows the key results. This is Figure 3 of the paper. In each test, the chimp was presented with a word, either with natural speech or a distorted synthetic speech. The animal tried to identify the word by choosing from among four candidate words. (Thus 25% would represent random success; this level is noted by the dashed horizontal line.) Humans were also tested; although the general intent of the tests was the same, the procedure used for humans was different.
Since this is a preliminary test, and the protocols used for chimp and human were not the same, we will look for the main effects, and not worry about small differences.
|
|
Let's start with the left block of results, for the chimp. We see that with natural speech, the chimp scored about 80% (white bar). The chimp was presented words in a type of synthetic speech called noise-vocoded (NV). The chimp scored about 55% with these distorted words (the two darker bars -- which don't really differ).
Now, look at the left-most of the two data sets for humans. This compares human results for natural and NV speech. Humans do better on both parts than the chimps; the decline from normal to NV speech is similar for chimp and human.
The remaining tests compare natural speech with another type of synthetic speech, called sine wave (SW). There are two sets of results for chimps and one for humans. Again, the big picture is that the results for chimp and human are similar.
|
The overall "big picture", then, is that the chimp -- one experienced with human speech -- tested about as well as humans on understanding two types of distorted speech. Remember that the test is measuring not just the ability to recognize the sound, but to interpret a distorted sound in terms of known words. The significance of this result is unclear; the discussion in the paper on this is quite good. I think for now, we simply note that they did this -- an interesting experiment. Hopefully, it opens the door to further work exploring how the chimp "listens".
News stories:
* Chimp recognises synthetic speech. (BBC, July 7, 2011. Now archived.) Includes a couple of pictures of the chimp, one of them "at work".
* Chimp has an ear for talk -- Language-trained ape recognizes distorted speech surprisingly well. (Science News, July 8, 2011.) Includes audio clips to show the various types of speech tested. (I suggest you try the "natural speech" one last.) [September 10, 2012... This article is no longer freely available.]
* Chimps Are Good Listeners, Too. (Science Now, July 1, 2011.)
The article: A Chimpanzee Recognizes Synthetic Speech with Significantly Reduced Acoustic Cues to Phonetic Content. (L A Heimbauer et al, Current Biology 21:1210, July 26, 2011.)
The Supplemental Information linked to the article includes two short audio files that illustrate the types of speech used here; I think you can access these regardless of whether you have access to the article itself. Each file has one word, in the three speech types tested: natural, noise-vocoded, and sine-wave. (Unfortunately, the first one is "normal", so you hear the distorted speech styles already knowing what the word is.) (One program questions the file type of these audio files, but plays them fine.)
Also see...
* Do apes say "hello"? (September 14, 2021).
* If you are talking with someone, how can you tell if they are paying attention? (May 8, 2017).
* The smartest chimpanzee? (September 29, 2012).
* Can French baboons learn to read English? (May 13, 2012).
* Are some languages spoken faster than others? (November 21, 2011).
* Speech: Taking turns (August 17, 2011). On speech -- in monkeys.
* What makes us human? A new approach (April 25, 2011). On chimpanzees.
Restoration of old sound recordings
July 23, 2011
A recent news story was about restoration of an old recording -- from 1888. It was claimed to be the oldest known commercial recording, intended for use by Thomas Alva Edison in a talking doll. The approach to restoration used here is to read the recording optically, using lasers, then process the optical scans. The method was developed locally, at the Lawrence Berkeley National Laboratory.
I already have a section on another page about historic recordings [link at the end], and I have added this item. The news story is listed below, but I encourage you to see my more complete discussion. Many of the items link to sound clips.
News story: Early Talking Doll Recording Discovered. (US National Park Service -- the Thomas Edison National Historical Park, May 2011.)
Carl Haber, one of the scientists of this project, has been awarded a MacArthur grant. Berkeley Lab Scientist Named MacArthur "Genius" Fellow for Audio Preservation Research. (Lawrence Berkeley National Laboratory, September 24, 2013.)
For more Edison:
* Poetry (July 23, 2009).
* The wisdom of Edison was invoked in a reply to a post on the nature of science: The promise of science? (November 16, 2009).
* Could a common food plant be used to make rubber? (March 27, 2015).
A post about the restoration of an old manuscript: Stanford Linear Accelerator recovers 18th century musical score (June 22, 2013).
For more on historic recordings, see my page of Internet resources - Miscellaneous: section on Art & Music: Historic recordings.
Recovery from natural disaster: can the poor benefit?
July 22, 2011
A disaster occurs. Over time, the survivors rebuild. What is the long-term result? Is it possible that the long-term result is "good" -- good for the poor or disadvantaged? If so, what conditions might promote getting a good result?
A paper on this topic appeared recently in a prestigious scientific journal. The paper is a case study of one incident. They argue that the poor did benefit, and they suggest why it worked out this way. The secret, they suggest, is to allow bottom-up control of the recovery. It's an intriguing paper.
|
Here is their data. This is Figure 1 of the paper.
They divide the population into thirds, by the amount of land they owned (a measure of economic status). The lowest third, the most land-poor, is denoted by blue bars, at the left of each set; see the key at the top of the figure for more.
The first set of data, labeled 1999, is from shortly after a hurricane. The bars show the change in land holdings compared to a 1998 baseline, before the hurricane. All three groups lost land; the poor lost the most -- on a percentage basis.
The other two data sets are for two times a few years after the hurricane. Both years show the same general effect: the poor have gained the most land -- again, on a percentage basis. (Just look at the overall bar height for now. The dark bars within the big bars of these two data sets show the amount of land gained "by claiming primary forest".)
|
That graph is the heart of their story. It leaves much unanswered, including what has happened in the near-decade since their last data. (They do note that the area survived flooding in 2008 with little effect.) In the paper, they discuss how the recovery occurred, and why they think this worked out rather well. Although one can point to many holes in the story, and question assumptions, it is an intriguing story -- worth a look with an open mind. Remember, this is a "natural experiment". They just happened to be studying this particular society when a hurricane occurred. They observed, and now they report what they saw, and provide their comments.
News story: Climate-Related Disasters May Provide Opportunities for Some Rural Poor, Study Suggests. (Science Daily, March 14, 2011.)
The article: Climate-related disaster opens a window of opportunity for rural poor in northeastern Honduras. (K McSweeney & O T Coomes, PNAS 108:5203, March 29, 2011.)
More about floods: Flooding in The Netherlands: natural or manmade? (September 19, 2015).
More about hurricanes: The effect of hurricanes on lizards (August 14, 2018).
July 20, 2011
Quiz: Barack Obama and polar bears
July 20, 2011
What do Barack Obama and polar bears have in common -- in terms of their ancestry?
This question is based (in part) on a current scientific paper. It refers to a specific point (not some general evolutionary statement that would apply to anyone). Those who have paid attention to Obama's recent travels may have an advantage.
Answer next week. [See below.]
More, July 27, 2011...
The answer... They are both part Irish.
The immediate impetus for this quiz is a new paper investigating the origin of the polar bear. The approach is to analyze the mitochondrial DNA (mtDNA) of a range of bears -- polar bears and brown bears -- and then to work out the most likely genealogy for them. (Since mtDNA is inherited only though the mother, this approach deals only with the maternal lineage.) Their conclusion is that the maternal line of polar bears originated with Irish brown bears.
We had an earlier post about polar bear ancestry, using a similar approach. [Polar bears: ABC (May 11, 2010).] How does this new paper fit in? It is along the same lines, but more extensive. It probably supersedes the earlier paper. We noted the likelihood of something like that happening in the earlier post. The new paper actually proposes three different scenarios for the possible origin of the polar bear; they have insufficient evidence to distinguish them. That is, the new paper is progress, but still gives an incomplete story.
The polar bear work:
* News story: Ancestry of Polar Bears Traced to Ireland. (Science Daily, July 8, 2011.)
* The article: Ancient Hybridization and an Irish Origin for the Modern Polar Bear Matriline. (C J Edwards et al, Current Biology 21:1251, August 9, 2011.)
The other part of this post is that Obama is also part Irish. This became news recently when he traveled to Ireland. Here is a new story on this: Obama visits family roots in Ireland. (Reuters, May 23, 2011. Now archived.)
More on the polar bear ancestry: A polar bear update (June 3, 2012).
More about Obama:
* The Obama lizard (March 20, 2013).
* Nobel Peace Prize (October 25, 2009).
Previous quiz:
* Quiz: NASA's boat (June 29, 2011).
* Next: What are they? (September 14, 2011).
Early American art: a 13,000 year old drawing of a mammoth
July 18, 2011

|
That's it. A drawing of some elephant-like animal -- probably a mammoth or mastodon. The drawing is about 3 inches long and 2 inches high (7.5 cm x 4.5 cm).
The drawing was found engraved on a fossil bone, in Florida. The bone -- and drawing -- were discovered by an amateur fossil hunter, who recognized the possible importance, and took it to university researchers.
Here is a picture showing the drawing in the context of the full bone. The bone is about 16 inches (40 cm) long. The bone [link opens in new window].
|
Finding a drawing of a mammoth made by a human means that the human knew what a mammoth looked like. Since the mammoths went extinct about 13,000 years ago, this is evidence that humans were there 13,000 years ago -- humans with the artistic talent and instinct to draw the fauna.
Some of you with roots outside the Americas may be laughing at me for posting this. 13,000 years? You call that old? Yes, I do. America was the last continent to be inhabited by humans. The time of the first arrival of humans in America is not entirely clear. It is almost certainly within the last 20,000 years; until very recently, even the 13,000 year age of this item might have seemed suspicious.
News stories. The text of the following two items is substantially the same. The former may be easier to read.
* Earliest Art in the Americas: Ice Age Image of Mammoth or Mastodon Found in Florida. (Science Daily, June 21, 2011.) The picture above is from this page.
* Bone fragment is only Ice Age artwork from America to show a "proboscidean". (Smithsonian, June 22, 2011.) The larger picture, linked above, is from this page.
The article: Earliest Art in the Americas: Incised Image of a Proboscidean on a Mineralized Extinct Animal Bone from Vero Beach, Florida. (B A Purdy et al, Journal of Archaeological Science 38:2908, November 2011.) Much of the paper is about establishing that the bone is authentic.
For more on mammoths and such...
* Did the First Americans eat gomphothere? (July 29, 2014).
* Uptake of small pieces of ancient mammoth DNA by bacteria: What are the implications? (May 13, 2014).
* If the elephant can't find its dinner, should you help by pointing to it? (October 18, 2013).
* To kill a mastodon (November 15, 2011).
* Mammoth hemoglobin (February 1, 2011).
* A mammoth story (December 1, 2008).
More about prehistoric art:
* Images from 30,000-year-old motion pictures (July 22, 2012).
* Leopard horses (December 2, 2011).
For a book on the earliest Americans, see my Book Suggestions page: Meltzer, First Peoples in a New World -- Colonizing Ice Age America (2009).
Growth of open access publishing
July 17, 2011
In traditional publishing of scientific articles, the costs are paid for largely by subscribers. In a new model, costs are paid for largely by the authors (supported by grants). In this new model, called open access (OA) publishing, the scientific papers are freely available online to the scientific community and the general public. (In both models, advertisers may also play a role.)
There are various issues involved in choosing between the two models, including "fairness". One issue is simply the economic viability of the two models.
A new paper reviews the growth of OA publishing. Those who have been following the OA story may enjoy the paper.
News stories:
* Open access comes of age. (Nature News; also published in print in Nature 474:428, June 23, 2011.) Nature is a traditional publisher, relying on subscriptions. They are now experimenting with OA.
* Ten-Fold Increase in Open Access Scientific Publishing During the Last Decade. (Science Daily, June 14, 2011.)
The article, which is itself OA: The Development of Open Access Journal Publishing from 1993 to 2009. (M Laakso et al, PLoS ONE 6(6):e20961, June 13, 2011.) The article is in a PLoS journal; PLoS is one of the major OA publishers, founded for that purpose.
Also see: Open access publication: a status report (September 14, 2010). This refers to a good news story, but it may not be freely available. The new article is more "academic", and is OA.
A human protein that can sense magnetic fields
July 15, 2011
The Musings post Magnetic field perception (June 16, 2010) noted a nice discussion of magnetic field detection by animals. Now we have a report of a human protein that seems to be able to detect magnetic fields -- when transplanted into the fruit fly Drosophila. Let's look at what they did, and then discuss the meaning of the result.
The figure below (Figure 1a from the paper) shows the key results. It's a complex figure, so let's go through it slowly. There are four experiments, each of which has two parts. The basic design is that a batch of flies is tested in a T-maze, in which one arm has a magnetic field. They measure the number of flies in the arm with the magnetic field and the number of flies in the arm without the magnetic field; the result is expressed as a "preference index" for the magnetic field. The two parts of each experiment involve flies that are "naive" (untrained) and "trained". In the training the flies learn to associate a magnetic field with a reward of food.
We'll start with the two controls, one positive and one negative. Then we'll look at the key experiment with the human protein.
|
The two bars at the left are for a positive control, with normal flies (labeled "Canton-S"). The first (left) bar is for "naive" flies; the second (right) is for "trained" flies. The y-axis shows their response to the magnetic field -- their "preference index". You can see that the naive flies show a negative response to the magnetic field (white bar goes down, to about -0.1), but the trained flies show a positive response (black bar goes up, to about +0.17). That is, naive flies tend to avoid the magnetic field, but trained flies tend to go toward the magnetic field, because they have been trained to associate it with food.
The two bars at the right are for a negative control, with flies lacking the protein being studied. These flies do not show any significant response to the magnetic field, whether naive or trained. (The figure uses asterisks to indicate which results are statistically significant. The bars at the right, for the negative control, have no asterisks.)
|
The middle two sets of bars are for flies where the gene for the protein of interest has been mutated out (like the negative control), but then added back. In one case (middle-left), they add back the fly version of the gene; in the other case (middle-right), they add back the human version of the gene. Both fly and human genes restore the responses: naive flies show a negative response and trained flies show a positive response.
|
Restoring the responses by adding back the fly gene shows that they are studying the right gene. That the human gene also works shows that -- well, that the human gene can substitute for the fly gene. This is a standard type of test, and it is common that a defect in one organism's genome can be remedied by a related protein from another species.
However, we must also recognize the limitations. It may be that the human protein can function in the fly, but this does not mean it does function that way in humans. For example, it is possible that the protein is capable of a magnetic response, but that it is not connected up to the nervous system in humans for that response. They properly conclude that their results suggest that the possibility of a magnetic response in humans, with the involvement of this protein, should be studied further.
News story: Can Humans Sense Earth's Magnetism? Human Retina Protein Can Function as Light-Sensitive Magnetic Sensor. (Science Daily, June 21, 2011.)
The article, which is freely available: Human cryptochrome exhibits light-dependent magnetosensitivity. (L E Foley et al, Nature Communications 2:356, June 21, 2011.)
More on magnetic reception in animals... The nature of a bio-compass? (June 10, 2016).
Another example of studying the senses in fruit flies: What does blue light smell like? (July 18, 2010).
For more on using Drosophila as a model system...
Making smarter flies (July 18, 2012).
More on cryptochromes... An unusual eye? (June 6, 2012).
More about magnetic fields: What if your compass pointed south? (October 24, 2014).
July 13, 2011
Discovery of Neptune: The one-year anniversary
July 12, 2011
The planet Neptune was discovered one year ago today -- on September 23, 1846. That's one Neptune-year, of course. It takes Neptune about 165 Earth-years for one revolution around the sun; it is just completing one such revolution since Earth-man discovered it.
|

|
|
At right...
Neptune -- with three of its moons.
Photographed by the Hubble Space Telescope, 2005.
Source: Wikipedia: Neptune. Click on the "Enlarge" button for this figure there for more information.
|
For perspective...
* Earth-man now has an average lifetime of around 80 years. That would be about a half-year on Neptune. No Earth-man has ever lived long enough to reach his first birthday on Neptune.
* If we put Neptune on our Western calendar system... Our current year 2011 (AD or CE) is year 13 (AD or CE) on Neptune.
Neptune may not be a place for birthday parties, but if you like monthly events, you are in luck. Neptune has 13 (known) moons; five of them revolve around the planet in less than one Neptune-day. The closest moon, Naiad, would provide about two months each day.
Neptune Completes First Orbit Since Discovery: 11th July 2011 (at 21:48 U.T.+/- 15min). (Blog by "Bob" (not me!), July 1, 2011.) A delightful blog entry. The author gives a lot of information about the discovery of Neptune; some is technical details, but much is general and interesting. For example, he notes that Galileo undoubtedly saw Neptune -- but did not realize it was a planet. Browse! He argues that the anniversary is July 11, not the more commonly stated date of July 12, which I use here. He addresses the discrepancy; unless you're into very technical astronomy issues, don't worry about it. (It is not a time zone issue; times are given in UT.)
More on planetary discovery:
* A ninth planet for the Solar System? (February 2, 2016).
* A new trick for the Kepler planet-hunters (June 25, 2012).
* The youngest (known) planet? (October 30, 2011).
* The first report of a new planet (March 13, 2011).
More from the Hubble:
* How many moons hath Pluto? (July 20, 2012).
More from Neptune -- and the new James Webb telescope: Briefly noted... Neptune and its rings (September 26, 2022).
Also see: A planet that may be only ten years old? (March 8, 2016).
The story of Vulcan follows from the prediction and discovery of Neptune. Here is a book on Vulcan: Levenson, The Hunt for Vulcan -- And how Albert Einstein destroyed a planet, discovered relativity, and deciphered the universe.
Does XMRV cause CFS? We have a verdict. Maybe.
July 11, 2011
In October 2009, a report appeared claiming an association between xenotropic murine leukemia virus-related virus (XMRV) and the mysterious human illness chronic fatigue syndrome (CFS). A few months later, a second paper appeared on the issue, claiming there was no association. Ah, a scientific dispute -- and a Musings post: A virus that is or is not associated with chronic fatigue syndrome (February 12, 2010). Scientific disputes get resolved by collecting further evidence. By mid-2010 we had two new papers -- one on each side. And we got another Musings post, a follow-up that is linked to the original. We should also note that the same virus was reported to be associated with prostate cancer, and similar confusion surrounded that claim.
This is an important issue, because CFS is poorly understood, and typically untreatable. The claim of a virus being involved is intriguing -- a possible lead, or even breakthrough. We need to emphasize that even those claiming an association between the virus and the disease have no evidence that the virus is involved in the disease process. But if this virus -- a retrovirus -- is involved in CFS, then drugs against retroviruses (such as those used against HIV) might be useful. In fact, some have administered these drugs to patients; to my knowledge, no meaningful results from controlled experiments have been reported.
Work has continued -- as has the dispute. Are both sides right -- and CFS is heterogeneous? Or is one side finding a virus that is not there? Or is the other side failing to find a virus that is there? All of these are plausible; it takes focused work to sort out the possibilities. At least to some extent, people on the two sides have cooperated to try to do definitive experiments.
Various weaknesses of the XMRV story have cropped up over the last couple of years. However, two new papers would appear to deal a death blow to the claim that XMRV is associated with CFS. Article #1 finds no evidence for the virus in a sampling of CFS patients -- using the "best possible" testing; their sampling includes several patients for whom positive results had been obtained by other labs. Further, they show that viral nucleic acid (DNA) contaminates some common lab materials; this can explain why some may find a virus that is not there. They also find that human serum inactivates the virus, making establishment of infection unlikely. Article #2 uncovers the likely origin of the virus, as a laboratory recombinant. Further, they are able to examine the original sample of a prostate cancer that had been reported to have the virus; the original sample does not have it, but after passage through mice, it does. This strongly suggests that the original finding of the virus in the tumor was an artifact of lab work.
Overall, the key points are:
* Testing does not reproducibly show the virus. This include testing of the same patients.
* One reason for that variability of testing has been found: common lab materials, including commercial reagents, may be contaminated with the virus.
* The particular virus XMRV now appears to have been made during lab work a few years ago. This point does not preclude that it might cause disease, but it could not have done so a few years ago -- since it did not exist then. Implicating this new virus in CFS (or prostate cancer) makes little sense, since the diseases existed long before this virus did.
* Various characteristics suggest that the virus is unlikely to establish infection in humans.
Both papers involve complex experiments, with complex technical issues. I have noted only some highlights. I do not intend that my brief descriptions here are sufficient to convince you of the conclusion; instead, I intend simply to give an idea of what was found. However, it is fair to state that most -- but not all -- workers in the field, looking at these new papers and the sum total of the evidence, do not think that XMRV is associated with CFS (or with prostate cancer).
News stories:
* Retraction Sought, Refused on XMRV-CFS Study. (MedPage Today, May 31, 2011.) Discusses the scientific content of both new papers, as well as a personal dispute.
* Mouse Virus Erroneously Linked to Chronic Fatigue Syndrome, Study Finds. (Science Daily, May 31, 2011.) This item is mainly about paper #1.
The articles:
1) No Evidence of Murine-Like Gammaretroviruses in CFS Patients Previously Identified as XMRV-Infected. (K Knox et al, Science 333:94, July 1, 2011.)
2) Recombinant Origin of the Retrovirus XMRV. (T Paprotka et al, Science 333:97, July 1, 2011.)
Here is a Q&A page from the National Cancer Institute summarizing the new consensus view. It includes an extensive list of references. XMRV and Human Disease Association: Questions and Answers. The page was actively maintained during the debate. The link here is to an archived version, dated May 31, 2011. It includes the new articles discussed here, and seems to be the end of the active phase for the page.
Another mouse virus... What is in the rubella virus family? (November 15, 2020).
Google Books and culturomics -- a follow-up
July 10, 2011
Original post -- with a different title: In what year was the word "slavery" most used in books? (February 23, 2011).
The original post presented a paper based on computer analysis of books that have been scanned for the Google Books project. The basic idea is that the collection of "all books" (though only partially sampled so far) is a valuable database that can be mined for information about word usage -- and thus for information about human culture. They coined the term culturomics for this kind of study.
Computer scientist Brian Hayes has written an essay on this for his regular column in American Scientist. I probably don't read much written by computer scientists, but I generally enjoy Hayes's essays, and this one is no exception. Recommended, for an enjoyable perspective on culturomics. Computing Science: Bit Lit. (B Hayes, American Scientist 99:190, May 2011.) For a freely available copy, put the title into Google Scholar.
I have added this new article to the original post. Links to other things by Hayes are there.
The problem of human birth
July 8, 2011
Human birth is difficult. The birth canal just isn't big enough. It's a well-known problem, with serious consequences. The underlying reason for the problem is understood... It stems from two developments in the human lineage: a larger head, and a smaller pelvis. The latter change correlates with the change to standing upright.
One might wonder whether, over time, humans would evolve to somehow make birth "easier" -- or safer. A new paper sheds some light on this. By genetic analysis they show that genes associated with gestation time have been changing (evolving) faster than average. (Gestation time is the time of development in the womb. Longer gestation time means a larger baby.) This would suggest that human evolution has in fact been dealing with the birth problem. Little is known about the control of birth timing; their genetic analysis offers some hints.
|
Some background (from Figure 1 D of the paper)...
The graph shows body weight at birth vs gestation time (age at birth, we might say) for various animals. Humans are shown by the circled red point. Other primates are shown in blue, and other mammals in black.
The first observation is that the (blue) curve for primates is shifted to the right: for a given birth body weight, primates have longer gestational periods compared to other mammals. Then, look at the point for humans. It is to the left of the curve for the primates. That is, humans have a shorter gestational period than expected, compared to other primates.
The log-log scale, labeled with the values of the natural logs, may make it hard to get a sense of the numbers. To guide you... On the x-axis, the ln values of 5 and 6 correspond to gestational periods of 148 and 403 days, respectively. On the y-axis, the ln values of 6 and 8 correspond to birth weights of 403 and 2981 grams, respectively. (The latter value is about 6 1/2 pounds.)
|
They also explore whether these genes with accelerated evolution affect the likelihood of premature birth. They show that variation in one of them, the gene for follicle-stimulating hormone receptor (FSHR), accounts for some of the variation in birth timing. Thus there is an immediate practical aspect to recognizing and understanding these genes. Will knowledge of why birth timing varies help us control it?
This is a complex story. The work here is rather preliminary. Emphasize the general ideas: the questions they ask, and the leads they find. The conclusions they reach are rather soft at this point -- but intriguing.
Aside from whatever the limitations of the data are at this point, it is not at all clear what the "best" solution would be. Earlier birth may make the birth process easier, but also leads to birth at an earlier stage of development -- including brain development. (If it is too early, we have premature birth -- with its own problems, as noted above.) Is evolution dealing with the size of the birth canal? The compactness of the head? (or its shape?) Would human intelligence be enhanced if we would go back to walking on "all fours" -- at least for women?
News story: Evolution Points To Genes Involved In Birth Timing. (Medical News Today, April 14, 2011.)
The article, which is freely available: An Evolutionary Genomic Approach to Identify Genes Involved in Human Birth Timing. (J Plunkett et al, PLoS Genetics 7(4):e1001365, April 14, 2011.)
Also see:
* Kangaroo mother care for premature babies: start immediately (June 27, 2021).
* Using caffeine to treat premature babies: risk of neurological effects? (April 27, 2019).
* The rising rate of caesarean section births: an intriguing correlation (April 15, 2019).
* Human birth: When to cut the cord? (December 11, 2011).
A post on maternal mortality: Maternal mortality (May 7, 2010).
More about the timing of birth: When should the eggs hatch? (June 11, 2013).
July 6, 2011
Quiz: NASA's boat -- answer
July 6, 2011
Original post: Quiz: NASA's boat (June 29, 2011). As a reminder, the quiz simply asked... "Where does NASA intend to send a boat?"
The answer is now included at the end of the original post.
Making electricity in your windows: sharing the solar spectrum
July 5, 2011
This is clever! At first glance, it might seem that capturing solar energy to make electricity and letting solar energy through -- the normal function of a window -- would be at odds. If you've seen solar panels, they are black, to absorb as much of the solar energy as possible; that's not the best color for windows.
However, the solar spectrum is complex. The only wavelengths we can see are, well, the visible wavelengths. What if we designed a window that used the non-visible solar energy to make electricity? That is exactly what is reported in a new paper. It's not a completely new idea. What they did that was new was to begin to approach a practical way of doing it. The trick is to use a different type of solar cell, based on organic "pigments" -- ones chosen to absorb only infrared light. These have advantages for sharing the solar spectrum, and for ease of fabrication into combined window-solar cell devices.
|
Here's the idea of spectrum sharing...
|
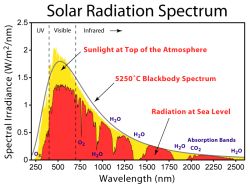
|
The red part of the graph shows the intensity of solar radiation we get, as a function of wavelength.
The vertical dotted lines bracket what we can see -- what we call visible light: between about 400 nm and 700 nm.
Comparing the solar radiation we get with what we can see... there is quite a bit of solar energy beyond what we can see. That is true on both sides: the far red that we cannot see, called the infrared (IR), and the far blue that we cannot see, called the ultraviolet (UV). That extra energy, beyond what we can see, could be used to make electricity -- without affecting what we see.
|
The figure is from Wikipedia: Sunlight.
The figure shows something else interesting about the solar radiation we receive. It varies, depending on how much atmosphere the sunlight passes through, and what is in that atmosphere. The yellow part of the figure shows the solar spectrum at the top of the atmosphere. You can see that what we get is less than that; in fact, the red part is labeled "radiation at sea level". You can also see that specific chemicals, such as water, in the atmosphere have specific effects on the solar radiation we receive down at the surface.
|
The paper reports production of combined window-solar cell devices. As windows, they are about as transparent as some ordinary windows. As solar cells, they are useful, but have somewhat low efficiency.
Is this going to become a commercial product? It's too early to tell. This is an early step from a university lab. It's a long road to make a device that is practical and economical. As typical of a pioneering research paper, these issues are not really dealt with at this point. The news story listed below is a good discussion of many of the practical issues involved. The point for now is that we have a significant step toward getting onto that road.
News story: Turning windows into powerplants -- New technology from MIT could enable a building's windows to generate power, without blocking the view. (MIT. April 15, 2011.) Good overview of the advance, and of some of the technical and economic issues involved in making progress implementing it. Recommended!
The article: Transparent, near-infrared organic photovoltaic solar cells for window and energy-scavenging applications. (R R Lunt & V Bulovic, Applied Physics Letters 98:113305, March 17, 2011.) You might check the abstract for a good summary. The first page starts with a useful introduction to the topic. After that, this paper gets to be fairly dense physics.
Other posts on solar energy include:
* Could vibration (or loud music) improve the performance of a solar cell? (December 11, 2013).
* A Christmas present: Using concentrated sunlight to split water and CO2 (February 18, 2011).
* Engineering cyanobacteria to make high-value chemicals (September 21, 2010).
More about high-tech windows... Windows: independent control of light and heat transmission (February 3, 2014).
There is more about energy on my page Internet Resources for Organic and Biochemistry under Energy resources. It includes a list of some related Musings posts.
Steppenwolf: Life on a planet that does not have a sun?
July 2, 2011
Why did I include a question mark in the title? Surely there is no doubt.
A recent paper developed an eerie proposal -- and caught attention because of its title. Eerie, but probably perfectly reasonable.
There are two key ideas underlying their proposal. Both might have seemed odd only a few decades ago; both are now mainstream. One is that there can be planets that do not orbit a star (and are not near a star). The other is that life does not need a sun. If both of those statements are true, then it follows that it might be possible to have life on a planet that is unbound to any star. Let's look at the two ideas separately, then at what the paper shows.
1) Our general understanding of planets is that they are formed along with stars. However, the dynamics of these systems are complex, and complex gravitational interactions may occur. Theory makes it clear that a planet can be ejected from its solar system -- and left to travel through space on its own. Such planets are referred to as unbound planets or rogue planets. There are claims of having detected some examples.
2) We used to think that the Sun was the primary energy source for all life on earth. This was overturned when we learned about the independent life systems near deep-ocean thermal vents. Life needs energy. Solar radiation is one good source. So is chemical or geological energy. That is, we now understand that solar energy per se is not necessary. The Jovian moon Europa is another interesting case. Some consider it the best candidate in our solar system for having life "as we know it". Its energy source is external, but not solar, and not radiation. Europa is thought to be heated by the tidal interactions with Jupiter -- heated enough that it has, we think, an ocean of liquid water below the surface.
In the new paper they ask if it would be feasible for a planet devoid of any external energy source to harbor life. They make various simplifications and assumptions. For example, they don't actually directly deal with life. They simply ask if such a planet could maintain a liquid ocean (subsurface) over long time scales. The presence of liquid water is assumed to correlate with the potential for life. What is the heat source? They assume that the planet has the same composition as earth, and thus produces heat internally from radioactive decay. Their conclusion? With their basic assumptions, calculations suggest that a planet three times the mass of Earth could maintain a liquid ocean for billions of years. Variations in the assumptions change the details of the answer, but the key point is that they suggest that a rogue planet could reasonably harbor life. An eerie thought.
Here are two news stories about this paper. Both give very readable overviews of the key ideas.
* Rogue Planets Could Harbor Life in Interstellar Space, Say Astrobiologists. (Physics arXiv Blog, MIT Technology Review, February 9, 2011.) (Scroll down to a "comment" posted on February 10, 2011 -- offering a Steppenwolf-inspired limerick.)
* Rogue Planets Could Harbor Life. (Wired, February 10, 2011.)
The article: The Steppenwolf: A proposal for a habitable planet in interstellar space. (D S Abbot & E R Switzer, Astrophysical Journal Letters 735:L27, July 10, 2011.) Check Google Scholar for a freely available copy.
The paper includes a simple verbal definition of what they mean by a Steppenwolf planet. To fully understand the meaning, however, you will need to read the book.
A post on the complexity of planetary dynamics: Collision of Earth and Mars (July 8, 2009).
Another post suggesting that the solar system is more complex than we might have thought: Cometnapping in the stellar nursery (August 4, 2010).
A post on life with solar energy: The hydrogen economy -- in the mid-Atlantic (August 30, 2011).
More on moon-tides... Titan: tides, and the possibility of a sub-surface water ocean (August 4, 2012).
More on Europa: Europa is leaking (February 10, 2014).
More on rogue planets: A planet that may be only ten years old? (March 8, 2016).
June 29, 2011
Quiz: NASA's boat
June 29, 2011
NASA has sent "trucks" (rovers) to Mars. Now, it is considering launching a boat. Where does NASA intend to send a boat? Why?
Answer next week. [See immediately below.]
Answer (posted July 6, 2011):
To Titan, of course. The big moon of Saturn. Titan has the only bodies of liquid (lakes or oceans) on its surface that we know of, beyond Earth. These are lakes of liquid hydrocarbons, such as methane -- the stuff we call natural gas here on Earth.
The proposed mission is called Titan Mare Explorer (TiME). The proposal has passed one round of competition at NASA. It is now one of three proposals being considered further, for a 2015-16 launch.
Here is some information about the proposed mission:
* NASA Selects Investigations For Future Key Planetary Mission. (NASA Press Release, May 5, 2011. Now archived.) Lists the various proposals that have been approved for further consideration.
* NASA floats Titan boat concept. (New Scientist, May 9, 2011.)
The following items are from 2009, when the proposal was being made.
* Exploring A Moon By Boat. (NPR, September 16, 2009.) Radio segment on the proposed mission. You can listen, or read a good transcript.
* Titan Mare Explorer (TiME): The First Exploration of an Extra-Terrestrial Sea. (Ellen Stofan, principal investigator, Presentation to Decadal Survey, 25 August 2009. Available at Research Gate.)
If you thought of the Jovian planet Europa, because it probably has an ocean, ok. But that ocean, which is an ocean of water, is below the surface. The question said nothing about sending a boat plus a drilling rig. Despite that additional difficulty, the possibility of sending something into Europa's ocean is certainly on NASA's wish list.
More about Titan:
* Weather forecast: Clouds will form near North Pole within two years (April 9, 2012).
* Weather report from Titan: Clouds? Puddles? Does that mean it rained? (April 6, 2011).
More on Europa: Europa is leaking (February 10, 2014).
Another proposed space trip: Planning a visit to the nearest star -- and to its "habitable" planet (February 22, 2017).
There is more about alkanes on my page Organic/Biochemistry Internet resources in the section on Alkanes.
Previous quiz: Quiz time... (June 15, 2011).
Next quiz: Quiz: Barack Obama and polar bears (July 20, 2011).
NASA has announced its choice... NASA: It's InSight, not TiME (August 22, 2012).
But then... TALISE: A better boat for Titan? (October 16, 2012). A new chapter begins?
Should the music industry use MRI scans to predict the success of new songs?
June 28, 2011
The music industry would love to be able to predict the success of a song. What if you could take an objective measurement? Stuff a teenager in an MRI machine and play the song. Measure the kid's brain activity -- and predict how the song will sell. A new paper suggests this approach might be worth considering.
|
Here are the key data. This is Figure 2b of the paper.
The y-axis shows a measure of a song's success: the number of albums sold. The x-axis shows a measure of brain activity that they found, by MRI, when teenagers listened to short clips from the song.
There seems to be a correlation between these two measurements. The correlation coefficient shown is 0.32. Remember that it is R2 that is a measure of the "importance" of the correlation. In this case, R2 is about 0.1.
Importantly, the MRI measurement was a better predictor of success than the opinions expressed by the listeners.
|
What are we to make of this? Two things strike me, at this point. One, the idea is not at all unreasonable. Two, the data here are very limited. With that perspective, it is easy enough to "judge" this work. Let's take it as a preliminary observation. It raises a question. Now they need to do good focused work to test the idea more thoroughly. Upon careful testing, the idea may fall apart completely -- or it may get better. Novel scientific papers are often that way. It's the nature of novelty: the first report may be rather rough. The real judgment comes after further work. But surely there is enough here to warrant that further testing -- and to provide summer jobs for some teenagers.
If you do read over how they did these measurements, I think a number of possible improvements will be clear.
News stories. Here are two. The first one is the one I first came across. I found it intriguing, but not very clear; it is from a general news source, not specializing in science. I looked for more information, and found the second story, from a source that generally has high quality science reporting. Particularly note that the second story is much more upfront about the limitations of the work.
* Study: Pop Songs Literally Get Stuck in Teens' Heads. (Time, June 14, 2011.)
* Teen Brain Data May Predict Pop Song Success, Study Finds. (Science Daily, June 13, 2011.)
The article: A Neural Predictor of Cultural Popularity. (G S Berns & S E Moore, Journal of Consumer Psychology 22:154, January 2012.) A draft copy is available at the Social Science Research Network: pdf copy.
The lead author is described as a neuroeconomist, and is at the Center for Neuropolicy, Emory University. The two italicized words are not in my spell checker. Or dictionary.
Other posts on MRI include:
* DNA testing -- for rejection of a transplanted heart (May 24, 2011). MRI is among other methods discussed, besides what the title suggests.
* Dog fMRI (June 8, 2012). This is from the same group as the work in this post.
Another post on cultural aspects of songs: Tracking new songs as they cross the Pacific (June 21, 2011).
There is more about music on my page Internet resources: Miscellaneous in the section Art & Music. It includes a list of related Musings posts.
More about testing consumer preferences: Is it ok to eat while standing up? (January 14, 2020).
Dinosaur proteins -- update #2
June 27, 2011
Original item: Dinosaur proteins (July 6, 2009).
The earlier work claimed to have found pieces of dinosaur protein in fossilized dinosaur bones. There has been great skepticism about the claim; most scientists consider it unlikely that proteins could survive that long -- 70-80 million years.
A new paper offers a new argument to support the claim. The pieces of dinosaur protein claimed are pieces of collagen, a major protein of connective tissue. Here, the scientists make a model of the collagen fiber, based on how collagen appears in modern animals. They then map the peptides (protein pieces) that have been found onto the model. They find that the peptides are buried deep inside the structure, and suggest that they are highly protected from degradation there.
|
The figure at the right gives the idea. This is part of Figure 4 of the paper.
|
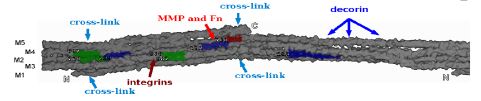
|
|
The grey structure shows part of the rope-like collagen fiber. The small colored bars on it show peptides from fossil bones of one (red, blue) or both (green) dinosaur species studied. You can see that the marked peptides are "internal", not on the surface.
|
Skeptics are not impressed. It may be logical that internal sites are protected, but there is no actual data showing any such protection. (Hm, it should be possible to get some measurements on that.) Even if there is some protection, it still stretches credulity to suggest that proteins could survive for 70 million years. That is, the argument in the new paper may make the claim that these are dinosaur proteins somewhat less implausible, but it hardly makes it likely. The story will continue. The claim is extraordinary; we should insist on nothing less than extraordinary evidence before we accept it. If this sounds negative... I intend it more as neutral than negative -- skeptical, but open. The claim is on the table. It's a fascinating and provocative claim. Let's reserve judgment until we have more evidence on the matter. The continued study may well be revealing, regardless of the outcome.
News stories:
* Twisted structure preserved dinosaur proteins -- Collagen coils might have kept Tyrannosaurus molecules safe from harm for millions of years. (Nature News, June 14, 2011.) Recommended.
* New evidence backs up claim of dinosaur soft tissue find. (PhysOrg, June 15, 2011.) This is somewhat sloppily written, but the main ideas are ok.
The article, which is freely available: Dinosaur Peptides Suggest Mechanisms of Protein Survival. (J D San Antonio et al, PLoS ONE 6(6):e20381, June 8, 2011.)
Ten Great Public Health Achievements, 2001-2010
June 26, 2011
Public health is much in the news -- successes and failures. It is easy to get lost in specific news, and lose sight of the big picture. The US Centers for Disease Control and Prevention (CDC) has recently published two articles highlighting recent achievements -- while also noting much that needs to be done. One article focuses on the US; the other takes a global view. They are written by the same person, and have a consistent format.
The writing is rather dry, and there are lots of numbers. Nevertheless, even a browse of the section headings may be interesting. Then, maybe you will stop and read an occasional section in more detail. I encourage you to have a look.
Did you know that child mortality (deaths of children less than five years old) decreased by 20%, worldwide, over the decade? That half of child mortality is in Africa (with 13% of the population)? That the measles vaccine saved 13 million deaths over that decade?
The reports were published in Morbidity and Mortality Weekly Report (MMWR), a publication of the CDC. MMWR is freely available online.
* Ten Great Public Health Achievements --- United States, 2001--2010. (R Koppaka on behalf of the Domestic Public Health Achievements Team, CDC; MMWR 60:619, May 20, 2011.)
* Ten Great Public Health Achievements --- Worldwide, 2001--2010. (R Koppaka on behalf of the Global Public Health Achievements Team, CDC; MMWR 60:814, June 24, 2011.)
Among Musings posts on big issues of public health...
* International relations: sharing flu viruses (May 28, 2011);
* Poliovirus eradication: an update, with some good news and some bad news (May 22, 2011);
* One health (November 15, 2010).
A post on one major issue of child mortality: Sudden infant death: a genetic factor affecting breathing? (April 30, 2018).
Vaccine development: Silk: Stabilizing vaccines and drugs (July 29, 2012).
How round are electrons?
June 24, 2011
Sometimes the buzz around a paper is as interesting as the paper itself. Recently there was much media attention for a new paper reporting that electrons are round (spherical). The question then becomes, so? What did you expect? And the expectation was that electrons are round -- more or less. Turns out it's an interesting story about the most fundamental levels of matter, but it takes some effort to make the story at all intelligible.
Fortunately, a physicist blogger has posted a good discussion of the work. It's well written and fun. As often with highly technical material, if you end up knowing a bit more about it than you did before, that is good. Don't worry if you don't understand it all.
A couple of points to help you get started... First, although the headlines talk about measuring the shape of the electron, what they really measure is its electric dipole moment. This is a measure of how uniform the charge is -- and is closely related to "shape". Second, the reason for being interested is that various models of the most fundamental aspects of physics make different predictions about what the electric dipole moment of the electron might be. Measuring that dipole moment helps to distinguish these models. The models themselves are well beyond what most of us understand, and in fact the current work -- the highest prevision measurement so far -- makes only limited progress in distinguishing them. However, the underlying idea is that this measurement relates to fundamental aspects of our understanding of the natural world.
The figure below gives an idea of how the new measurement that is reported relates to our understanding of physics. (Both the blog article listed below and the Physics World article it links to have larger copies of this figure. For now, we just want the general idea, and do not need all the details.)
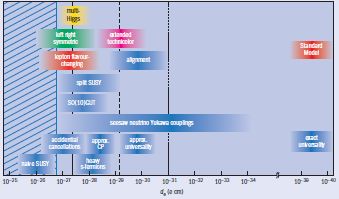
|
The x-axis shows de, the electron's electric dipole moment. Note that the scale runs "backwards", with the largest value (10-25) at the left and the smallest value (10-40) at the right.
(For comparison... A dipole moment you may be familiar with is that of the water molecule. Expressed with the same units, the electric dipole moment of a water molecule is a bit under 10-8. That would be way off the left side of this graph -- by more than the width of the whole graph.)
|
|
← high ... electron dipole moment (de) ... low →
|
Each box in the graph represents a particular physics model. The position and width of the box give an idea of what values of de are compatible with this model. Don't worry about what the names of the models are! You can see that different models make different predictions about what de should be. If only we could actually measure de, we could get some evidence to help distinguish these models. (The y-axis or the vertical position of the boxes have no meaning.)
|
Blog: What Goes Around Is Really Round: "Improved measurement of the shape of the electron". (C Orzel, May 27, 2011.) Highly recommended! He will tell you more about that figure. And it's fun -- even if some is difficult.
* News story accompanying the article: Precision measurement: A search for electrons that do the twist. (A E Leanhardt, Nature 473:459, May 26, 2011.)
* The article: Improved measurement of the shape of the electron. (J J Hudson et al, Nature 473:493, May 26, 2011.) Verrrrrry technical. Much of it is about error analysis.
Thanks to Greg for helpful comments on a draft of this post.
More about the properties of the electron:
* Are electrons "forever"? (February 9, 2016).
* The mass of an electron (March 23, 2014).
... and the anti-electron (positron) and such: What is the charge on atoms of anti-hydrogen? (July 15, 2014).
June 22, 2011
Quiz time... answer
June 22, 2011
Original post: Quiz time... (June 15, 2011). As a reminder, the quiz asked...
What is the connection between the figure at the right (look at the eyes) and the music at: music?
|
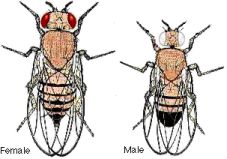
|
I have updated the original post to include the "answer". Go to the original post: Quiz time... (June 15, 2011).
Tracking new songs as they cross the Pacific
June 21, 2011
This is an item that is simply fun. It is quite a piece of work, and I have no idea what the significance is. In fact, I'm not sure the authors do, either. Sometimes that happens. We measure something because it is there; maybe later it will become part of a useful story.
Scientists from several institutions in the South Pacific, from Australia to French Polynesia, have collaborated to track songs crossing the Pacific.
I could show some data here: a chart -- a quite colorful chart -- showing the progress of several songs over the 11 year period of observations, or spectrographs analyzing aspects of the various songs. But it is the songs that are the reason for this item. It is the songs that fascinate humankind. Here is a short audio file, which samples 11 of the songs: audio sampler.
For more, including those charts and spectrographs...
News stories:
* Whale 'Pop Songs' Spread Across the Ocean. (Science Now, April 14, 2011.) The audio file above is from this story.
* Humpback Whale Songs Spread Eastward Like the Latest Pop Tune. (Science Daily, April 15, 2011.)
The article: Dynamic Horizontal Cultural Transmission of Humpback Whale Song at the Ocean Basin Scale. (E C Garland et al, Current Biology 21:687, April 26, 2011.) There are additional audio files available with the article; scroll down to the "supplemental information".
Other posts about whales include:
* If it quacks like a whale... (August 25, 2014).
* Identifying whale songs: You can help (January 4, 2012). Also see the post accompanying this one, which is about a piece of music inspired by whale songs.
* The Northwest Passage is open -- to whales (October 3, 2011).
* The effect of defecation by whales on global warming (Aug 2, 2010).
* What is the difference between a neutrino and a whale? (January 5, 2010).
More on cultural transmission:
* Pink corn or blue? How do the monkeys decide? (June 9, 2013).
* Cultural evolution: How a common folk tale takes on local characteristics (May 11, 2013).
More on music culture: Should the music industry use MRI scans to predict the success of new songs? (June 28, 2011).
More on song: Introducing Supersonus -- it stridulates at 150,000 Hz (June 16, 2014).
There is more about music on my page Internet resources: Miscellaneous in the section Art & Music.
On the Evolution of Calculation Abilities
June 20, 2011
The apparent ability to count or to do simple arithmetic is found scattered among various animals. We have noted some examples in Musings, in large part because they intrigue us. Of course, it is part of a serious effort to understand how brains work -- including the human brain. The story of counting and arithmetic in various human societies is fascinating, too. There are both innate biological aspects, as well as cultural and learned aspects.
I recently came across a nice review of this whole field; my title for this post is the article title. It's well written, and should be largely readable by the general reader. Along the way you will learn why it is sometimes best to say that 5 plus 5 is "about 10", and why the Sikuani Indians of Colombia say "aniha-kae-behe kae-taxu-behe kaetaxuwusito" to mean the number 16.
The article, which is freely available: On the Evolution of Calculation Abilities. (A Ardila, Frontiers in Evolutionary Neuroscience 2:7, June 2010.) It's fun. At least, browse.
Among posts on animals doing math -- rather complex math in this case: The traveling bumblebee problem (January 11, 2011).
For more on animal math...
* Monkey math (June 1, 2014).
* Making smarter flies (July 18, 2012).
Also see: The animal mind (July 23, 2009).
There is more about math on my page Internet resources: Miscellaneous in the section Mathematics; statistics. It includes a listing of related Musings posts.
MESSENGER spacecraft: make your own model
June 18, 2011
A recent post featured the MESSENGER spacecraft, which just went into orbit around the planet Mercury. [MESSENGER orbits Mercury, shoots Debussy (June 10, 2011).] Turns out that NASA posts instructions for making yourself a model of MESSENGER. Go to the NASA-MESSENGER page of Educational and Public Outreach For Students; scroll down to "Make a scale model of the MESSENGER spacecraft!". There are actually two models there: a simple paper model and an "advanced" model, which is more robust and more complex (listed for teachers). Try it; just reading about the models is fun! (The site is now archived.)
The sperm count problem
June 18, 2011
A strange story. It's strange not because of the scientific content, which is both interesting and important. It's strange because of how the science was done -- and reported. We have discussed various scientific controversies, but this one is quite unusual.
You may have heard... sperm counts have been declining -- for humans. It's considered a concern for two reasons. First, it could limit reproductive potential. (Hm, with over-population, isn't that good?) Second, it may reflect environmental contamination -- by chemicals known as endocrine disrupters. That is, some argue that the decline in sperm counts is due to industrial chemicals in our environment. The real question is whether it is true. The Danish report that is the basis of the common claim has been much criticized, and other studies are inconclusive.
Now there are some new results, also from Denmark. The work is generally considered high quality. The new results show no evidence of any decline over the 15 year period studied (and the values do not seem at all low). Ok, new data -- good work, and an apparent result which should be of interest. The results have been posted at the web site of the Danish National Board of Health (the funding agency), and written about in the journal Epidemiology.
So what is so strange about that? What makes this story strange is that the scientists who did the study object to the results being made public. They are not involved with the papers about their work! Why is not entirely clear. So what we have is some posted data, and some discussion of it. The work is potentially important. If there is some reason why the apparent conclusion is not appropriate, we should know. Hopefully, events will cause the authors to properly publish their work, so we know the full story. For now, we know "the answer" but not the full story.

|
The graph.
This is from the Bonde et al "Commentary" article, listed below. That article gives its original source, and discusses the unusual background of the figure, which is why it is controversial.
As you can see, there is no particular trend in sperm counts evident from this data set. (2006 was apparently a bad year for sperm.)
|
All the items below are short and readable, and deal both with the scientific issue and the publication issue. I encourage people to read at least some of these items.
News story: In Update on Sperm, Data Show No Decline. (New York Times, June 6, 2011.)
Articles in Epidemiology. Remember that the scientists who did the work are not authors of either of these items. Both articles include links to web sites that may have some useful discussion, including the views of the scientists -- but these web materials are in Danish.
* Editorial, via PubMed: On Sperm Counts and Data Responsibility. (A J Wilcox, Epidemiology 22:615, September 2011.)
* The "Commentary" article, presenting the data, via PubMed: Trends in Sperm Counts - The Saga Continues. (J P Bonde et al, Epidemiology 22:617, September 2011.)
Also see: The bisphenol A (BPA) controversy (September 19, 2010). The post introduces the controversy surrounding this chemical, but does not go into the specifics. In fact, BPA may be an endocrine disrupter -- one of those chemicals that some consider part of the problem for the current issue, sperm count decline.
I really encourage you to be very cautious about reaching conclusions, both regarding sperm counts and BPA. The important point here is to understand the scientific uncertainties; these are unresolved issues. In the light of uncertainty, it is fine to choose to be conservative in the choices you make. But that is different from claiming that the answers are known.
What the sperm does... In the beginning... It's Izumo1 + Juno (May 23, 2014).
June 15, 2011
Quiz time...
June 15, 2011
What is the connection between the figure at the right (look at the eyes) and the music at: music?
The figure is reduced from figure source -- which you are welcome to check. (Now archived.)
This is about a very real historical connection. Answer next week.
[See immediately below.]
|
|
Answer, June 22, 2011...
The music is the Star Spangled Banner, written by Francis Scott Key. The picture shows a white-eyed fruit fly -- one of the very first lab mutants found for any organism. It is well known by biologists that this was discovered by the pioneering geneticist Thomas Hunt Morgan (information that was clear if you checked the link).
The connection? Morgan was a direct descendant of Key -- his great grandson.
The two events here were separated by nearly one century. The Star Spangled Banner was written in 1814. Morgan first observed the white-eyed flies in 1910.
I did not realize the connection until I came across it recently in a book. A convenient source, with, of course, much more: Wikipedia: Thomas Hunt Morgan.
Other quizzes and related features include:
* Next: Quiz: NASA's boat (June 29, 2011).
* Previous: What is it? (May 25, 2011).
Other music posts include: Vox Balaenae (January 4, 2012).
Early detection of autism
June 14, 2011
In medicine, early detection is generally considered good. However, early detection of autism has been a challenge. Autism is defined by behavior; there is -- so far -- no biochemical test. Stretching our understanding of autism to allow diagnosis at younger ages is a challenge; a successful test would provide useful information for those studying the condition, and might be useful in allowing earlier treatment.
A group of scientists centered at the University of California San Diego now claim that routine screening of year-old babies for autism -- and for other developmental disorders or delays -- is both practical and fruitful. The test itself is not new; what is new here is setting up a system for administering it systematically and learning how to deal with the results. The test carries an intimidating name: Communication and Symbolic Behavior Scales Developmental Profile Infant-Toddler Checklist (CSBS-DP-IT-Checklist). It is a questionnaire that can be filled out by the parents in about five minutes -- and evaluated in about two minutes. They achieved widespread use of the test, with suspect children being referred to therapy earlier than would have been common. It seems to be a useful step.
News story: Five-Minute Screen Identifies Subtle Signs of Autism in One-Year-Olds. (Science Daily, April 28, 2011.) Good overview of what they did, the progress they reported, and the goals for further work.
The article, via PubMed: Detecting, Studying, and Treating Autism Early: The One-Year Well-Baby Check-Up Approach. (K Pierce et al, Journal of Pediatrics 159:458, September 2011.)
* Previous post on autism: Is the incidence of autism increasing? (November 6, 2009).
* Next: A mouse carrying a serotonin-transport gene that contributes to human autism (May 18, 2012).
More on autism is on my page Biotechnology in the News (BITN) -- Other topics under Autism.
Treating colds: Is zinc worthwhile?
June 13, 2011
Another confusing topic. However, there has been a recent analysis of all available data, and the UC Berkeley Wellness Letter has published a nice summary, aimed at the general consumer. I think we can just let this stand on its own. Enjoy, and be cautious in interpreting it; that is clearly their intent. Yes, the tone is somewhat positive, but with reservations. Remember, at best, zinc is of limited value, and it has potential negative side effects. If you are inclined to try zinc as a treatment for colds, at least read this over so you know what the limitations and side effects may be. More is not necessarily better, either for normal body chemicals or for drugs.
Is there hope for better information? The reason that zinc may be effective is unclear, though it may involve an inhibition of the viral replication. Understanding that better might be a step toward understanding why it works better in some cases than in others. Are there personal differences, too? But all this lies in the future.
News story: Zinc: Fighting the Cold War. (UC Berkeley Wellness Letter, June 2011. Now archived.)
The report: Zinc for the common cold. (S M Das, Cochrane Database of Systematic Reviews, June 2010.) (Update August 4, 2019... The Cochrane report has been withdrawn. The page given here, and the one it links to, give information about the withdrawal. They also link to further information about the subject matter -- as does the Berkeley Wellness Letter, above. In general terms, my comments in this post still hold, as far as I know.)
More on the biology of zinc: The role of zinc in arthritis (July 18, 2014).
With 24 eyes, can they see the trees?
June 11, 2011
A year ago we noted the fascinating visual system of the box jellyfish: How many eyes does it have? (March 12, 2010).
What do all these eyes do? An important point to realize at the start is that these are very simple organisms. They lack a "brain" -- a centralized structure coordinating the nervous system. They do have a simple nervous system, but it is delocalized. It may follow, then, that the eyes have special local functions, too; that is, an eye may be connected to "local" nerves, for a specific purpose. We noted this possibility in the earlier post.
The eyes with lenses are particularly intriguing; they are more complex than the eyes of most jellyfish, and are of about the same general design as our eyes. They are image-forming eyes, not just light detectors. The new work is on the upper lens eyes ("ule"; see figure in previous post). These eyes always point upwards, regardless of how the animal is oriented; this is because of a weight at the end of the stalk carrying the eyes. The scientists noted the tendency of the animals in a particular population to stay very near the edge of the canopy formed by the trees. (This was a good location for food.) So, they hypothesized that the animals can see the canopy -- can see the trees (or, at least, the forest). Here they test this hypothesis.
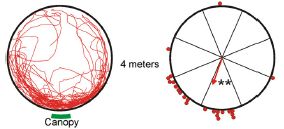
|
Here are some key results.
Consider the top frame of the figure, labeled "4 meters". They place a bunch of jellyfish inside a transparent cage about 4 meters (horizontal distance) from the canopy of trees over their lagoon. The left side of the figure shows the paths taken by individual jellyfish. That's rather messy, but you can see that there is more action on the side nearest the canopy. The right side is a "summary"; there is one point for where each jellyfish ended up. You can see that most of them ended up on the canopy side.
The bottom frame is the same idea, but now with the jellyfish about 12 meters from the canopy. The results show that they move more or less randomly; they are apparently too far away from the canopy to see it.
These two frames are parts of Fig 3 of the paper. The full figure shows more distances tested.
|
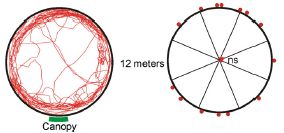
|
The summary of their observations is that the jellyfish seem to be able to see the canopy if it is within about 8 meters. Interestingly, they do some measurements on the eyes, and then estimate that the eyes should give reasonable images out to about 8 meters. Thus observation and theory seem in agreement. Further, seeing the canopy leads to a behavioral response (swimming in correct direction). The case is developing that these animals -- thought to be among the most primitive types of animals -- have image-forming eyes that are used to direct behavior. They do that despite the absence of a "brain".
News story: Box jellyfish stable-eyes vision to hunt prey. (ScienceBlogs: Neurophilosophy, posted by "MO", who identifies as a molecular and developmental neurobiologist, April 28, 2011.) Good background, as well as a discussion of the current work.
The article, via abstract at PubMed: Box Jellyfish Use Terrestrial Visual Cues for Navigation. (A Garm et al, Current Biology 21:798, May 10, 2011.)
More on jellyfish vision: Associative learning coupled to the visual system of box jellyfish. (June 27, 2024).
More about the nervous system of jellyfish: When do jellyfish sleep? (September 29, 2017).
More about jellyfish... Caltech engineer turns rat into jellyfish (September 22, 2012).
More on simple visual systems... An unusual eye? (June 6, 2012).
More on simple brains... Can memories survive if head is lost? (November 23, 2013).
More on vision:
* The limits of the human visual system: can humans detect single photons? (October 7, 2016).
* Color vision: The advantage of having twelve kinds of photoreceptors? (February 21, 2014).
MESSENGER orbits Mercury, shoots Debussy
June 10, 2011
The NASA MESSENGER spacecraft finally arrived at its destination --- Mercury -- after six years of travel. In March MESSENGER (yes, it is an acronym) went into orbit around Mercury, and returned its first image -- mankind's first image -- of Mercury from the planet's orbit. That first shot, of the Debussy Crater, is shown above (and is available from the sites listed below).
MESSENGER is the first spacecraft to go into orbit around Mercury -- and the first to visit Mercury at all since Mariner 10 more than 30 years ago. Its distinctive heat shield (sunshade) is a reminder of how close to the sun is it. Although MESSENGER has just gone into orbit, it has been doing science along the way. It has already reported findings about the liquid core of Mercury, about its (very thin) layer of exosphere (atmosphere), and even some evidence that it might have had volcanoes in the fairly recent geological past.
News story: MESSENGER's First Image from Orbit of Mercury. (Universe Today, March 29, 2011.)
For more...
The following sites, from MESSENGER's operators, have information and pictures...
* First Image Ever Obtained from Mercury Orbit. (NASA, March 29, 2011. Now archived.)
* MESSENGER. The MESSENGER home page, at the Applied Physics Lab, Johns Hopkins University. (Incidentally, this is the lab where much of the work on the DARPA prosthetic arm is being done. FDA to fast-track prosthetic arm -- Follow-up: videos (April 2, 2011).)
For an introduction to MESSENGER's science, both during its trip and now in orbit, see a recent article written for the general audience and freely available: A new look at the planet Mercury. (S C Solomon, Physics Today 64(1):50, January 2011.)
For a complete list of publications from the MESSENGER project, choose the Resources tab from the home page.
The Wikipedia page on MESSENGER has lots of information about the mission, and is actively maintained: Wikipedia: MESSENGER.
Look around the MESSENGER sites, and you will also find a picture of Bartok. If you're beginning to wonder... Craters on Mercury are named after famous artists, painters, authors, and musicians. The Debussy crater was named only in 2010: Ten New Names Approved for Mercury Craters. (USGS, March 3, 2010. Now archived.)
Thanks to Borislav for sending this post.
More from NASA:
* The Kepler Orrery (June 3, 2011).
* NASA: Life with arsenic -- follow-up (June 7, 2011).
More craters... Mars: craters (August 11, 2012).
For more on MESSENGER... MESSENGER spacecraft: make your own model (June 18, 2011).
June 8, 2011
Chemical elements 114 and 116 officially recognized
June 8, 2011
Two new chemical elements have been officially recognized: #114 and #116. The discovery (or, rather, synthesis) of these elements was reported some time ago. Over time, enough data has accumulated that the International Union of Pure and Applied Chemistry (IUPAC) is satisfied; they now declare the elements accepted.
Over coming months, official names will be proposed -- by the discoverers. The news story below hints at some names, but I would treat this as just "rumor". The proposed names will then be put out for comment, and in due course IUPAC will approve official names.
News story: New chemical elements synthesized by Russian team recognized. (RIA Novosti, June 3, 2011. Now archived.) The story also notes that they plan to work soon on trying to make element #119.
Also see:
* Four new chemical elements officially recognized (January 12, 2016).
* Chemical element #117 (April 13, 2010). A post on the original announcement of a chemical element.
* Element #112: Copernicium (July 15, 2009). A post on the official naming of an element.
My page Introductory Chemistry -- Internet resources has sections on "Names of elements" and on various of the newer elements. The section on #114 notes its original discovery, in 1999, and its confirmation, in 2009.
The naming proposal is in the post: Chemical elements 114 & 116: flerovium, livermorium (proposal) (December 5, 2011).
NASA: Life with arsenic -- follow-up
June 7, 2011
The article that was the basis of the original post has been retracted. See the Retraction note at the top of the original post for more information. Added August 28, 2025.
Original post: NASA: Life with arsenic (December 7, 2010).
In December 2010 Science magazine accepted and posted a paper claiming the isolation of bacteria whose growth was stimulated by arsenic, and which contained arsenic replacing at least some of the normal phosphorus in the cells. An interesting paper! NASA announced the paper in a much-heralded news conference, and made more extreme claims. The paper, but especially the NASA news conference, started a controversy. Now, six months later, the paper has been formally published in print; this is the paper as originally accepted in December. The paper is accompanied by several formal (peer-reviewed) "Technical comments", and a reply by the authors.
In some ways, there is little new. There are no new experiments. Instead, the comments -- originally and now formalized -- present concerns and alternative views. That's good, but there is no new information. For those who want to review the story and catch-up with the controversy... I suggest that you start by re-reading the original Musings post, linked above. That post only touched the surface of the comments, but the general tone seems to hold: an interesting paper, but it needs further work -- and NASA did not help with its outlandish claims. If you want to get into the controversy, you may find it simplest to start with the author response, listed below.
It is easy -- and proper -- to criticize various players in this story. What I think is most important is how the story has played out. The authors have presented their data and what they think; others have presented what they think. Over time, this will get worked out -- one way or the other. A single scientific paper, even when peer reviewed and published in a top-quality journal, is not a scientific truth. When we read a paper that does something new, we should be cautious, waiting for more information before accepting it all at face value. An important characteristic of science is that it is self-correcting. Some things that are not correct get published, but further work sorts out the correct story. It's a public process, a continuing process. It's not always elegant; such is human endeavor. Over the long term, it works out.
Where do I think this stands? The paper claims a bacterium whose growth is stimulated by arsenic, and which uses arsenic to at least partially replace phosphorus in basic metabolism (such as in DNA or ATP). These are interesting claims. If there is even a low level bona fide use of arsenic in basic metabolism, this is an interesting development. We await further testing of the claims.
News story: The Discovery of Arsenic-Based Twitter -- How #arseniclife changed science. (C Zimmer, Slate, May 27, 2011.) A useful overview of the story of the paper, the news conference, the controversy, and the current publication. It notes some key aspects of the science.
* The article: A Bacterium That Can Grow by Using Arsenic Instead of Phosphorus. (F Wolfe-Simon et al, Science 332:1163, June 3, 2011.) A pdf file of Supporting Online Material is also there, freely available; it contains considerably more information. This is the article that was accepted and made available last December; it was referred to in the original post.
* The main web page for this article also lists all the comments and the author response; these are listed at the left as "Related content", and also towards the bottom of the page. There are a lot of little files. A good place to start is with the author response, since that also gives the flavor of the comments. Author response to comments: Response to Comments on "A Bacterium That Can Grow Using Arsenic Instead of Phosphorus". (F Wolfe-Simon et al, Science 332:1149, June 3, 2011.)
For a good independent overview of the relevant arsenic chemistry and biochemistry... Life and death with arsenic. (B P Rosen et al, BioEssays 33:350, May 2011.)
More follow-up, as "rebuttal" papers appear: NASA: Life with arsenic -- Follow-up #2 (August 20, 2012).
More from Twitter: Comparing how true and false news stories spread (June 5, 2018).
The devil has cancer -- and it is contagious
June 6, 2011
Borislav noted the following news story, which is a nice overview of a fascinating topic: Drumming up support for Tasmania's unsexy beast. (Los Angeles Times, March 27, 2011.)
There are several issues here, at various levels of biology.
First, we have an animal that is not well known. In most of the world, marsupials are unfamiliar, known to us largely through zoos and occasional cultural icons. Only the opossum is common outside of Australia. The kangaroo, of course, is our familiar marsupial, but it is no more typical of marsupials than "rat" is typical of eutherian (placental) mammals. The Tasmanian devil is a carnivorous marsupial now restricted to the Australian island-state of Tasmania.
The Tasmanian devil is now an endangered species. Why? Because it has cancer. It? Yes, the species has cancer -- a cancer that is rapidly spreading through the population, and which is inevitably fatal. Why is it spreading? Because the cancer is itself transmissible; the cancer is infectious. Genetic analysis of the tumors from various individuals has shown that the tumors are closely related to each other -- and not to their host animal.
Caution: The figure linked here is not for dinnertime viewing. Here is a picture of a devil with the cancer [link opens in new window]. The figure is from a web page, now archived, of the Australian Wildlife Health Network. Scroll down to "Save the Tasmanian Devil (STTD) Program".
Transmissible cancers are uncommon. In fact, there are only a couple of well-characterized transmissible cancers. But why? A cancer is a growth that has become rather independent of the host. We know it can spread within the host, a process known as metastasis. In the lab, it is common to transplant human tumors to mice. But there is an important catch: this works well only with special mice lacking an immune response (so-called nude mice, which also lack hair). In fact, tumors are normally recognized as foreign upon transfer to a new host, and are rejected as any foreign tissue would be. Similarly, tissues transplanted from one human to another are typically recognized as foreign, and rejected. Somehow, the tumor is not rejected, and spreads easily around the population. This lack of rejection upon transfer is really the unusual feature. The reason for the lack of rejection is not entirely clear, but must somehow reflect the immunological nature of the cancer and the immune system of the devils. One part of this is apparently that the devils are very closely related, and share key immunological features.
Does that story leave you a little uneasy about whether some cancers might be transmissible among humans? It should. It's not well understood what is going on. The immunology of cancer is a messy story, and transmissible cancers are rather new on the scene. The story of the Devil facial tumor disease (DFTD), which threatens an interesting creature, is getting attention from a small but growing band of researchers. Time will tell how this plays out -- for the Tasmanian Devil, and for our understanding of cancer.
More on the DFTD:
* Immunization of devils: a treatment for a transmissible cancer? (April 24, 2017).
* Tasmanian devils: Are they developing resistance to the contagious cancer? (September 6, 2016).
* Why the facial tumor of the Tasmanian devil is transmissible: a new clue (April 5, 2013).
Another transmissible cancer? ... Is clam cancer contagious? (April 21, 2015).
Previous post on marsupials: The kangaroo family tree: the American ancestry of kangaroos (August 13, 2010).
Previous post on cancer: Does radiation treatment of cancer cause new cancers? (April 8, 2011).
My page for Biotechnology in the News (BITN) -- Other topics includes a section on Cancer.
Cooking pork
June 4, 2011
Musings has discussed various aspects of food safety, including regulatory issues. Attention was largely on the chicken problem.
But what about the pork problem? When I was young, the rule was: cook pork well done, because of the trichinella worm. However, the trichinella worm is no longer a significant issue.
The post Killer chickens (December 2, 2009) introduced the chicken problem. It links to several other posts on food safety. The December 9 follow-up introduces the pork-trichinella problem, with data on recent incidence of trichinellosis.
Regulatory agencies lag behind the facts, on the up side and the down side. They have been slow to respond to the increasingly recognized concern about chicken, and slow to respond to the reduced concern about pork. However, we now have progress on the pork front. New recommendations from the USDA-FSIS now classify all the non-bird meats the same. (USDA-FSIS? That is the United States Department of Agriculture - Food Safety and Inspection Service.) Cook whole meat to 145 °F (internal temperature; that's about 63 °C) -- whether it be beef or pork. (Ground meat needs a higher temperature, because the surface is a special problem. Poultry also needs a higher temperature.)
The general message is that the rules -- whether formal regulations or recommendations -- for food safety change from time to time, in the light of new information. This example shows that a food safety problem can be solved; let's hope that some progress is also made with our #1 food safety problem: contaminated chicken.
Announcement: https://www.fsis.usda.gov/wps/portal/fsis/newsroom/news-releases-statements-and-transcripts/news-release-archives-by-year/news-release-archives-by-year-2011/%21ut/p/a0/04_Sj9CPykssy0xPLMnMz0vMAfGjzOINAg3MDC2dDbwMDIHQ08842MTDy8_YwNtMvyDbUREAzbjixQ%21%21/?1dmy¤t=true&urile=wcm%3Apath%3A/fsis-archives-content/internet/main/newsroom/news-releases-statements-and-transcripts/news-release-archives-by-year/archives/ct_index919. USDA Revises Recommended Cooking Temperature for All Whole Cuts of Meat, Including Pork, to 145 °F. (USDA, May 24, 2011.) A simple statement of the new recommendations, with little explanation. No longer available.
News stories:
* Cooking Temperature for Pork Is Lowered. (New York Times, May 24, 2011.)
* Cooking pork safely: the science -- Authoritative advice on cooking pork safely from the chefs' bible, Modernist Cuisine. (Guardian, May 26, 2011.) This consists of excerpts from a book for cooks. Now, chefs do not always have the science straight. But the information here seems generally good, and well written. In fact, it is the most helpful of the various pages presented here.
More about eating pig: Why you should not eat larb: A story of trichinellosis -- locally (March 11, 2018).
And ... What can we learn by looking at the DNA in vampire bat feces? (May 27, 2015).
For more about pigs -- having nothing to do with eating them...
* Teaching pigs to use a mirror (December 1, 2009).
* Pigs as organ donors for humans (February 16, 2010).
More about meat... Red meat and heart disease: carnitine, your gut bacteria, and TMAO (May 21, 2013).
The Kepler Orrery
June 3, 2011
It's perfectly ok to skip down and check out the video listed below. It's fun. You can come back and read the explanation later.
An orrery is a model of the solar system -- a working model, showing how the planets orbit around the sun. The solar system? Maybe that should say our solar system (and our sun). Of course, our solar system was the only solar system known until recently. The first planets outside our solar system were discovered in 1995; we now know there are other solar systems out there.
Musings has noted these extrasolar planets (or "exoplanets"; links below). However, we are now in a new era of extrasolar planets. The spacecraft Kepler, launched in 2009, has the primary goal of searching a region of the sky for planets -- and solar systems. Kepler's basic approach is simple: it looks for the reduction in light from a star as a planet crosses in front. Its strength is the sensitivity of its detection system, partly because it is in space, free of the earth's atmosphere. In February 2011 NASA announced the first big batch of Kepler discoveries. This data set, based on observations over the first four months of operation, offered us more candidate extrasolar planets than obtained by all previous searches combined.
The Kepler orrery shows all the solar systems in this new batch that have at least two planets characterized so far. It's cute, but it is also a profound symbol of the new era of extrasolar planets.
The video -- just over one minute -- is at YouTube: Kepler Orrery. (Do a web search on Kepler Orrery, and you will also find some later versions.)
A good news story about the February data release: Kepler Planet Hunter Finds 1,200 Possibilities. (New York Times, February 2, 2011. Link is now to Internet Archive.) It's worth it for the first sentence!
For general information about the Kepler mission:
* Kepler Overview -- Kepler: NASA's first mission capable of finding Earth-size and smaller planets around other stars. (NASA) See their menu at the left for more.
* Kepler (spacecraft). (Wikipedia)
More from Kepler:
* How many exoplanets are known? Three (four?) fewer than we thought (May 31, 2022). A re-evaluation.
* A new trick for the Kepler planet-hunters (June 25, 2012).
Musings posts from the pre-Kepler era of extrasolar planets:
* The first truly habitable exoplanet? (October 12, 2010).
* Extrasolar planets (December 8, 2009).
Planet discovery -- in olden times: The first report of a new planet (March 13, 2011).
More on planetary discovery:
* Habitable planets very close to a star (June 19, 2016).
* The youngest (known) planet? (October 30, 2011).
A post about Kepler himself... Book review: Kepler (February 3, 2010). Kepler's Astronomia Nova (New Astronomy), from 1609.
More from NASA: MESSENGER orbits Mercury, shoots Debussy (June 10, 2011).
And more... Exoplanet Travel Bureau (February 21, 2015).
June 1, 2011
What is it? Follow-up
June 1, 2011
Original post: What is it? (May 25, 2011). As a reminder...
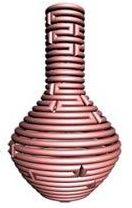
|
If it's rather obvious what it is, then...
How big is it?
and
What is it made of?
Of course, the figure at the left is a diagram. Perhaps you would like to see an actual photo of one.
|
I have updated the original post to include the "answer", with source information. Go to the original post: What is it? (May 25, 2011).
Ant sociality: supercolonies -- a video of a talk
May 31, 2011
The post Ant mega-colony takes over world (July 16, 2009) discussed the relatedness of Argentine ant populations around the world. UC Berkeley professor Neil Tsutsui, who works in this field, recently gave a talk here on the broader topic of ant sociality. The lecture was part of the Science@Cal series; it was an excellent talk, and is now available as an online video.
Here is a link to a video of the talk: Extreme Sociality: Supercolonies of the Invasive Argentine Ant. (Neil Tsutsui, Science@Cal, May 2011.)
Tsutsui lab web page. (Tsutsui was not part of the work referred to in the earlier post. However, he was acknowledged in the paper for contributing California ants to the study.)
For general information about the Science@Cal series, which started as a series of astronomy talks for the International Year of Astronomy: Astronomy talks (June 22, 2009).
Other Musings posts on ants include: How to survive flooding by making a waterproof raft (May 27, 2011).
Your desire for caffeine: It may be in your genes.
May 31, 2011
Caffeine. The drug of choice. The most commonly consumed psychoactive drug. Why? Probably for the usual reason: it feels good.
A new paper makes a small but interesting contribution to our understanding of caffeine. The work shows two genes that affect our consumption of caffeine. Interestingly, both involve caffeine metabolism. They are not entirely clear here, but it is likely that those people who metabolize caffeine faster need to consume more to satisfy their body. That is a general type of effect, and is relevant to dosing of medicinal drugs, too; unfortunately, it is often ignored, because we do not know how an individual will respond.
The effect shown here is fairy small: less than one cup of coffee per day. The claim is simply that these genes are part of what affects caffeine consumption. Further, the reason for these genes having an effect makes sense.
News story: Coffee Drinking in Your Genes? Genetic Variants in Two Genes Linked With Caffeine Intake. (Science Daily, April 6, 2011.)
The article, which is open access: Genome-Wide Meta-Analysis Identifies Regions on 7p21 (AHR ) and 15q24 (CYP1A2 ) As Determinants of Habitual Caffeine Consumption. (M C Cornelis et al, PLoS Genetics 7(4):e1002033, April 7, 2011.) The introductory parts of the paper may be of interest, but the main content is fairly technical genetic analysis.
Caffeine is structurally related to adenine, hence to adenosine. The paper listed here makes the connection between the biological effects of these two compounds. That connection was also briefly noted in the post: How acupuncture works: another clue (September 2, 2010).
For more on caffeine:
* Good news on the coffee front: Coffee is good for you (March 15, 2016).
* How caffeine interferes with sleep (December 11, 2015).
* Caffeine boosts memory -- in bees (April 12, 2013).
* Chocolate: 1200 years old (February 18, 2013).
More about coffee... Robot uses coffee as a picker-upper (December 17, 2010).
International relations: sharing flu viruses
May 28, 2011
Health is global. Viruses know nothing of national boundaries, and they now travel by airplane. Public health is an international matter.
A specific issue is that new strains of a pathogen need to be shared with the major labs studying the disease. A few years ago, a "developing country" refused to do so. Their reason was that they felt they were being exploited. They were concerned that the developed countries would use their virus to make profitable drugs or vaccines, and that the developing country would not share the profit or the benefit.
The WHO (World Health Organization) has just negotiated an agreement that tries to strike a reasonable balance between the various concerns. The news stories listed below outline the dispute and the agreement. As you read these, most important is to recognize the valid concerns of both sides. The details of the agreement are perhaps less important; time will tell how well it works.
News stories:
* WHO Resolves Impasse Over Sharing Of Flu Viruses, Access To Vaccines. (NPR, April 18, 2011.)
* Infectious diseases: 'Breakthrough' Deal on Flu Strains Has Modest Provisions. (M Enserink, Science 332:525, April 29, 2011.)
Another such dispute... A new SARS-related virus seems to be emerging -- and an "ethics" story (February 4, 2013).
Many posts on various flu issues are listed on the supplementary page: Musings: Influenza.
The "one health" idea emphasizes the flow of diseases among various organisms. The current post is about the flow of diseases among countries. Of course, those are related issues. One health (November 15, 2010).
For a broad overview of public health... Ten Great Public Health Achievements, 2001-2010 (June 26, 2011).
More about WHO: The role of WHO: the view of its director (December 1, 2015).
My page for Biotechnology in the News (BITN) -- Other topics includes a section on Ethical and social issues.
How to survive flooding by making a waterproof raft
May 27, 2011
You want to float -- not sink. To do this, you want to assemble a structure with a density less than that of the water. You do this, according to Georgia Tech engineers, by getting together with your neighbors, holding each other tightly -- and trapping air between you. If you can trap enough air, the density of the overall structure will be low enough that it will float. The natural water-repellency helps with trapping the air -- and also allows those inside the structure to breathe; a bit of soap disrupts the raft.
The neighbors hold each other by interlinking their legs, and also by mouth-leg connections. The authors note (Figure 1 legend), "... the mandibular grip requires particular care to minimize pain to the recipient of the bite."
The basic phenomenon of raft formation has been known. What the new work does is to analyze how it occurs. Here is a nice video of the rafting -- in the wild: Ants create a lifeboat in the Amazon jungle. (BBC wildlife, 2007.)
News story: Fire ants assemble as a 'super-organism' (w/ video). (PhysOrg, April 25, 2011.)
The article: Fire ants self-assemble into waterproof rafts to survive floods. (N J Mlot et al, PNAS 108:7669, May 10, 2011.) There are five video files associated with the paper, as Supporting Information.
First author Nathan Mlot's web site has many pictures and videos of this and related work -- on how engineers think about ants and fluids. (What do they drink in that lab?) You might start with the page Mlot: The ant raft. Look around his various pages, and you'll come across the full size version of the picture at the right.
Other Musings posts on ants include:
* School of Ants -- you can help (October 16, 2011).
* Ant sociality: supercolonies -- a video of a talk (May 31, 2011).
* Death-grip scars from zombie ants, 48 million years ago (November 9, 2010).
Another post on surviving flooding:
* What to do if you are about to drown (September 23, 2009).
More about floods:
* Atmospheric rivers and wind (May 9, 2017).
* Flooding in The Netherlands: natural or manmade? (September 19, 2015).
More about collective behavior:
* Quiz: What are they? And are they a threat to you? (October 20, 2014).
More about rafting:
* What if a fishing dock fell into the ocean off the east coast of Japan? (October 29, 2017).
|

|
May 25, 2011
What is it?
May 25, 2011
|
|
If it's rather obvious what it is, then...
How big is it?
and
What is it made of?
Of course, the figure at the left is a diagram. Perhaps you would like to see an actual photo of one.
|
I'll post an answer, with proper source information, next week
[see immediately below].
Answer (posted June 1, 2011):
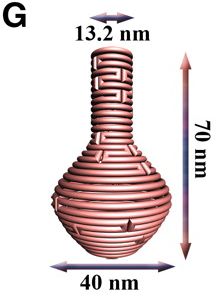
|
The figure at left is similar to the one in the original post (immediately above), but now with dimensions shown. Clearly, it is something of a "nanoflask". The "actual photo" of it, linked above, is also a clue; some of you probably recognized that as an electron micrograph.
What is it made of? DNA. It is an example of how the base pairing properties of DNA can be used to make complex structures.
How big is it? Well, we could estimate that at various levels. Simplest is to ask what size "box" it would fit in. That is, just look at the overall size and shape. For this purpose, it is a cylinder with diameter 40 nanometers (nm) and height 70 nm. Thus, we can calculate the size of a cylindrical box for this flask: the volume is about 90,000 cubic nanometers. That is 9x10-20 liters, or 90 zeptoliters (zL). Of course, the flask itself is somewhat smaller, and the inside volume is smaller yet. (If the prefix zepto is unfamiliar, see my page Metric Prefixes - from yotta to yocto. The page includes examples to give a sense of scale for most of the prefixes. For example, at the other end of the volume scale, the volume of the earth is about 1 yottaliter.)
|
News story: DNA Nanoforms: Miniature Architectural Forms -- Some No Larger Than Viruses -- Constructed Through DNA Origami. (Science Daily, April 14, 2011.)
The article: DNA Origami with Complex Curvatures in Three-Dimensional Space. (D Han et al, Science 332:342, April 15, 2011.) The figures in this post are parts of Figure 3 of this paper.
Other posts on "DNA technologies":
* The nano-alphabet (June 29, 2012).
* Nanorobots: Getting DNA to walk and to carry cargo (August 7, 2010).
Other "What is it?" features, and other quizzes, include...
* What are they? (September 14, 2011).
* Quiz time... (June 15, 2011).
* What is it?
(March 8, 2011).
Other posts dealing with small containers include... Making a small container that has an opening in it (September 10, 2019).
DNA testing -- for rejection of a transplanted heart
May 24, 2011
Recipients of organ transplants must be carefully monitored for signs of rejection. It's not easy, and there is little margin for error. For heart transplants, the patient undergoes regular biopsies (tissue sampling) of the heart. This is invasive and expensive, and it sacrifices valuable heart tissue.
It is now clear that cellular debris circulates in a person's blood. Organ rejection involves cell killing. Some of the debris from the killed cells, including DNA, ends up in the patient's blood. If there is a rejection incident, the amount of donor DNA in the recipient's blood increases. If only we could measure it.
In fact, there has been some work to show that Y chromosome DNA may be in a female's blood -- for the special case of a male heart being transplanted into a female recipient. This work begins to establish the idea, but is limited. The new work seeks to establish a general method for detecting donor DNA in the recipient's blood. After all, we are all different genetically; it is just a matter of finding specific differences between the specific people involved, and then doing the analysis. The time is ripe: the revolution in DNA sequencing in recent years makes the analysis practical.
Figure 1 of the paper is a nice outline of the approach. It's big, so is linked here: Figure 1: General scheme for this study. The figure is largely self-explanatory, if you simply note that green represents DNA that is distinctively donor DNA.
Here is the full figure legend, from the paper: Fig. 1.
General scheme for this study. Cell-free DNA collected in plasma contains a majority of molecules from the recipient (in gray) but may also include some from the transplanted organ (green). Due to increased cell death in the organ during a rejection episode, more donor molecules are expected to be present in the blood at these times. Shotgun sequencing of the purified DNA allows for counting recipient versus donor molecules by looking at single nucleotide polymorphisms (SNPs) that vary between donor and recipient. Very high levels of donor DNA, particularly changes from past measurements, will indicate the onset of rejection.
|
Here is an example of their results, for two patients. This is from Figure 4 of the paper.
The purple (upper) curve is their measurement of the amount of donor DNA in the recipient's blood, at various times. The green (lower) curve is a background number, which serves as a baseline. (More about it below.)
For both patients shown here, the background (green curve) is a little less than 1%. Actual measurements of donor DNA (purple curve) are often very near that. At certain points, with high DNA values, the figure notes that the accompanying biopsy showed a rejection incident. (It's not entirely clear, but I think that all other points were accompanied by "normal" or near-normal biopsies.) The curves may show some increase in donor DNA prior to the incident; this is interesting, and will need to be clarified in further work.
What about that green, background curve? What are they measuring? For this curve, they are measuring the apparent amount of non-recipient DNA -- at sites where the donor and recipient have the same sequence. That is, the green curve is measuring differences where there are none. Basically, it reflects sequencing errors. Now, the value of near 1% might seem high, but that is the nature of sequencing. They could bring this background down, by doing more sequencing -- at greater cost. What's interesting is that even with the current background rate, the results seem promising.
|
The results are encouraging. A high level of donor DNA in the recipient blood correlates with a rejection incident; it may also anticipate the incident. They plan to proceed with clinical testing, to see how this test should be integrated into the post-transplant regimen.
We should note that similar testing is under development for measuring fetal DNA in mother's blood. The purpose is to look for genetic defects.
News story: To Better Detect Heart Transplant Rejections, Scientists Test for Traces of Donor's Genome. (Science Daily, March 29, 2011.)
The article, which is freely available: Universal noninvasive detection of solid organ transplant rejection. (T M Snyder et al, PNAS 108:6229, April 12, 2011.)
A post on the advances in DNA sequencing: The $1000 genome: Are we there yet? (March 14, 2011).
A post on transplantation: Pigs as organ donors for humans (February 16, 2010).
A post on heart disease: Using stem cells to study a heart condition (April 19, 2011).
There is more about genomes and sequencing on my page Biotechnology in the News (BITN) - DNA and the genome.
There is more about replacement body parts, including transplantation, on my page Biotechnology in the News (BITN) for Cloning and stem cells. It includes an extensive list of related Musings posts.
Doug notes that a variety of other "less-invasive" tests are in various stages of development. Just to note a couple briefly...
Gene expression. This involves measuring the expression of certain genes in the blood. A version of this test has received FDA approval, though it actually provides limited information. See a good news story about the clinical trial that led to its approval: Assessing rejection risk for heart transplant patients. (Time, April 22, 2010.) The Snyder paper (above) notes this work.
Magnetic resonance imaging (MRI). This is broadly useful in examining heart function. The extension to detecting early signs of transplant rejection is logical, but technically demanding.
Here are two articles on the use of MRI in studying heart transplant patients. The first is a freely available review, from 2009. The second is a current paper, an example of work using MRI to study heart function in long-term transplant recipients. Caution: neither of these articles is easy reading. Both are linked here via PubMed abstracts.
* Cardiovascular magnetic resonance in the diagnosis of acute heart transplant rejection: a review. (C R Butler et al, Journal of Cardiovascular Magnetic Resonance 11:7, March 2009.)
* Allograft morphology and function in heart transplant recipients surviving more than 15 years by magnetic resonance imaging and dual-source computed tomography. (S Mastrobuoni et al, European Journal of Cardio-thoracic Surgery 40:e62, July 2011.)
It is good to see a variety of approaches being developed. They measure different things. They will inevitably be useful for research work. Over time, who knows what their clinical impact will be. One paper even suggests that perhaps there is too much testing to anticipate rejection -- that nothing is lost by just waiting for the patient to show clinical signs of rejection.
More on MRI: Should the music industry use MRI scans to predict the success of new songs? (June 28, 2011).
A simpler bicycle
May 23, 2011
Bicycles are complicated. It is not well understood how they work. In an effort to better understand how a bicycle works, Dutch engineers have designed and tested a simpler bicycle.
The new bicycle is shown at the right. (This is Figure 2A of the paper.)
|
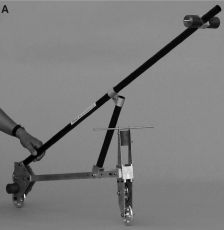
|
You might find it useful to compare this with a standard bicycle. The linked figure (Figure 1) shows a diagram of a standard bicycle along with a diagram of a theoretical model of the new, simpler bicycle. (The model shown in this figure uses skates rather than wheels. The bike they made -- shown above -- uses wheels.)
You're wondering??? You might want to jump ahead and see this simple bicycle in action. There is a nice video with the Popular Science news story listed below; that same video is #1 with the paper. You should also remind yourself that the word bicycle refers to the device having two wheels. The name does not specify that it must have a seat, or other parts you may be wondering about.
Why did they do this? As noted above, it is not clear how a bicycle works. One useful feature of a bicycle is that it tends to stay upright. Riders learn how to assist, but a riderless bike will tend to do it "all by itself". Why? There are some ideas, but no general agreement. So, the purpose of the test bicycle is to test how a bike stays upright. The test bike is simpler, and two key aspects that many thought were critical to the self-righting ability of a bicycle have been changed. These are the gyroscopic action and the position of the wheels. The positioning of the front wheels make them much like the front casters on a shopping cart at the grocery store, and could well lead to self-righting.
The results? Look at the video, if you haven't already. The simplified bike, lacking two suspected self-righting features, rights itself just fine.
Their conclusions are cautious. They do not claim that they have disproven that the proposed features lead to self-righting. Instead, they claim that those features are not essential for self-righting. That is, they claim that there may be various ways to promote self-righting. They also suggest that the optimum bicycle may not yet have been designed.
Think about that next time you fall off a bicycle. (By the way, putting a large mass on the frame (e.g., on the seat) is likely to make the bicycle less stable.)
News stories:
* A Bicycle Built for None: Riderless Bike Helps Researchers Learn How Balance Rolls Along. (Science Daily, April 15, 2011.)
* Video: Scientists Build a Riderless Bike That Stays Up On Its Own. (Popular Science, April 19, 2011. Now archived.) Includes a video; this is movie #1 with the paper.
The article: A Bicycle Can Be Self-Stable Without Gyroscopic or Caster Effects. (J D G Kooijman et al, Science 332:339, April 15, 2011.) Click on "Supporting Online Material" (SOM) for some movies. They are listed on the SOM page, with descriptions, and then linked there. Of these, #1 is perhaps most useful; it simply shows the new bicycle in operation. The description of this movie is quite amusing. Note that #1 is also included with PopSci news story, above. The others show some details; they are narrated in Dutch.
Here is the legend for movie 1, from the SOM... Movie s1.
The Experiment. The video Video1BasicExperiment.mp4 shows a typical experimental run. In order to effectively capture the experiment on film many different camera positions were tried. The main objective was to show that the bicycle once released follows a straight line. When it is perturbed, it stabilizes and then continues on a straight line in a new direction. The difficulty was finding a viewing position from where clearly can be seen that the bicycle actually goes through these three stages. Multiple fixed positions were tried, with both zoom and panning motions, however the most effective camera position turned out to be mobile, on a skateboard that closely followed the bicycle. One person carried out the experiment with the bicycle, the cameraman stood on the skateboard and only concentrated on filming the bicycle while a the third person pushed the cameraman forward and ensured that the distance between the bicycle and camera stayed roughly constant.
Previous post on bicycles: MIT invents a better bicycle wheel (April 24, 2010).
More gyroscopes:
* Gyroscopic seeds (June 15, 2018).
* Dolphins, bulls, and gyroscopes (September 10, 2010).
More about pedaling: Renewable energy for the school bus: let the kids pedal (April 24, 2012).
Poliovirus eradication: an update, with some good news and some bad news
May 22, 2011
There have been setbacks in the program to eradicate polio, so it is nice to see a report that has good news as well as bad. Importantly, polio incidence in two of the "big 4" countries with endemic polio was down by about 95% in 2010. These good news countries are Nigeria and India. Both made major efforts to stem the tide of polio. Nigeria is doubly important, since much of the polio in neighboring countries was probably spill-over. India has had two pockets of endemic polio. It is encouraging that there have been zero new cases in the last two quarters in either of them. Does this mean that polio is near eradication in that large country? Other good news included declines in some of the countries that had seen recent outbreaks.
Clarification... One case of polio was reported in India in January 2011 -- in a different state. That seems to be the only case of polio reported for India in 2011.
Polio moves fast, and the situation is fragile. 95% reduction is good news -- but only if it is maintained. Only 100% reduction -- sustained over time -- really counts. Polio eradication has taken much longer than anticipated. The current goal is to achieve zero polio worldwide by the end of 2012; that would be a stretch given the current situation, but is not impossible. Perhaps we are witnessing the final throes of one of mankind's dreaded diseases.
The polio statistics are typically reported by country. Is that fair? Yes and no. Polio incidence is not uniform within a country; generally it is particular regions that suffer from polio. Further, ratings by country do not consider the country size. On the other hand, there is a big political component to this story. Each country with polio infection must act (though national or "state" governments). Thus the country is a significant player in the story. There is no simple resolution, no simple correct way to report the data. All we can do is to understand what it means. The goal is zero cases of polio, year after year -- classified however we want.
The article: Progress Toward Interruption of Wild Poliovirus Transmission --- Worldwide, January 2010--March 2011. (I U Ogbuanu, on behalf of the Polio Eradication Department, World Health Organization; Morbidity and Mortality Weekly Report (MMWR) 60:582, May 13, 2011.) MMWR is published by the US Centers for Disease Control, and is freely available online. The article goes through the countries individually, and raises the key issues. The first paragraph is a good overview. If what follows is too statistical for you, skip down to the "Editorial Note" for a plain English discussion. A table at the bottom of the page gives numbers by country, for the countries with endemic polio as well as the various countries with outbreaks.
Also see:
* Polio: Another country may be getting close to eradication (December 8, 2014).
* Polio eradication: And then there were three (March 27, 2012). A polio milestone for India.
* Polio: progress toward eradication (November 5, 2010). This discusses the three types of polio viruses (PV), and the merits of using vaccines that lack Type 2 PV. You will see reference in the article above to monovalent and bivalent polio vaccines; this post will help you understand what those mean.
* Another disease has been eradicated. GREP. (February 2, 2010). This post is about the eradication of the cattle disease rinderpest -- mankind's second successful eradication of a disease. It also includes some general information about disease eradication programs, and an introduction to the polio problem.
For a broad overview of public health... Ten Great Public Health Achievements, 2001-2010 (June 26, 2011).
My page for Biotechnology in the News (BITN) -- Other topics includes a section on Polio.
Development of a new species of lizard in the lab
May 20, 2011
Scientists at the University of Kansas have created a new type of lizard. They used methods that would seem to be entirely natural, and the resulting lizard should probably be considered a new species.
As background... lizards have some unusual biology. They are vertebrates, and generally reproduce sexually as we might expect. However, they have an unusual ability to form hybrids. Many of the hybrids are sterile, so are dead-ends. However, there are numerous lizard species with the unusual ability to reproduce parthogenetically: that is, the female is the sole parent. (She lays eggs, which hatch and develop normally; the key point is that fertilization is not needed.) There has been suspicion that parthenogenetic lizards may have arisen via hybridization.
In the new work, the scientists allowed two lizards, from different species, to mate. (The particular species were chosen as follow-up to some earlier work, which had been suggestive but incomplete.) Offspring were obtained. Among them were four females that were not only viable, but capable of reproducing -- all by themselves (i.e., parthogenetically). They have now followed these offspring through four generations, and the new species seems stable.
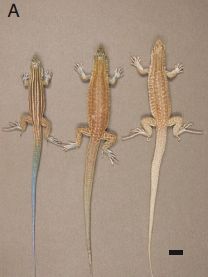
|
The two parents (left and right), and the offspring (center).
The tails are distinctively different between the two parent species and the offspring.
This is Figure 1A from the paper. (It is also widely reproduced, including in both news stories listed below.) The scale bar (lower right) is 1 centimeter.
|
It's important to emphasize that the new species was formed entirely naturally. No genetic engineering, or other "unnatural" manipulation, was involved. In fact, their intent was to mimic what they thought was going on in nature.
Is it proper to consider this the formation of a new species? Using common guidelines, it would seem so. The resulting lizards are now reproductively isolated from the parent species. Since they reproduce parthogenetically, i.e., by cloning, that is easy to show.
Unfortunately, there is no general agreement on how species are defined, especially for organisms without sexual reproduction. So it is hard to give a definitive answer; there may well be some discussion of this point among biologists. However, if the new lizard had been found in nature, it is likely that it would have been called a new species. If you'd rather leave the species question open for now, think about this work producing a new "type" of lizard, probably by a pathway already used in nature. We should note that this is not a common way to make new species in nature.
Above we noted that the four females discussed here were "among" the offspring. What else did they get? Two more animals, which they think are males. About those they only say, "The reproductive status of the presumed males is still under investigation and will be reported in due course."
News stories:
* All-Female Lizard Species Created in Lab. (Wired, May 3, 2011.)
* New species of lizard created in lab that reproduces by cloning itself. (PhysOrg, May 6, 2011.)
The article: Laboratory synthesis of an independently reproducing vertebrate species. (A A Lutes et al, PNAS 108:9910, June 14, 2011.)
For more on lizards...
* Twenty percent of the females are genetic males (October 6, 2015).
* An advanced placenta -- in Trachylepis ivensi (October 18, 2011).
Another new species: Making a new species in the lab (July 26, 2015).
More on hybrids... Hybrid formation between organisms that diverged 60 million years ago (May 8, 2015).
May 18, 2011
Genome sequencing to diagnose child with mystery syndrome -- follow-up
May 17, 2011
Original post: Genome sequencing to diagnose child with mystery syndrome (April 5, 2010). This is about a desperately sick child whose genome was sequenced -- because the doctors had been unable to give a diagnosis. (Actually, his exome was sequenced. The exome consists of the exons: the protein-coding regions of genes.) Information was limited at that time; the post is based on a newspaper article, and only a meeting report was available. We noted it as the first case where a "whole" genome sequence was done for the purpose of diagnosis.
A year later there is much more information available on this case. The newspaper that published the original story we noted followed up with a major series of reports -- and won a Pulitzer prize for that work. A scientific paper has been published. We note those here for those who might like to follow-up. The newspaper series, of course, has a strong emphasis on the human side of the story. Bottom line... The genome information did lead to diagnostic information, to treatment, and to improvement. However, the follow-up story is complex and incomplete.
News story: Journal Sentinel wins Pulitzer Prize for 'One in a Billion' DNA series. (Milwaukee Journal Sentinel, April 18, 2011.) This is the paper's article announcing their Pulitzer. It links to the three articles of the series, and to an "update"; see "Related coverage" and "The series" (on their left-side menu).
* Commentary accompanying the article, via abstract at PubMed: A timely arrival for genomic medicine. (A N Mayer et al, Genetics in Medicine 13:195, March 2011.) This is a commentary by the authors of the paper, so it is not an independent view. In the commentary the authors discuss some of the considerations in doing this pioneering study, including the ethical issues. It's short and readable -- worth a look for general interest.
* The article, via abstract at PubMed: Making a definitive diagnosis: Successful clinical application of whole exome sequencing in a child with intractable inflammatory bowel disease. (E A Worthey et al, Genetics in Medicine 13:255, March 2011.)
Glossary entry: Exome.
Musings presents historic papers from time to time. It is possible -- even likely -- that the paper listed above will turn out to be a paper of historic note. Think about that as you look over some of the materials here. The paper itself has some parts that may be too technical for most readers. Nevertheless, I encourage you to read over the discussion section of the paper. Even if you gloss over the details, I think you will get a sense of the historic importance of the work.
Studying cancer development by analyzing the genomes of individual cancer cells
May 16, 2011
Cancer is complex. There is a broad view that cancer develops as multiple mutations affect the growth properties of the cancerous tissue, allowing it to grow without the host's usual growth constraints. People talk of a cancer evolving -- changing over time by random mutations, with natural selection determining what thrives. (Some people even suggest that a cancer might be considered as a distinct species. If nothing else, this is an interesting and provocative view.) With the modern tools of genome sequencing, people are now trying to analyze what these genetic changes are, by sequencing the genomes from numerous cancers. Such studies suffer from the basic fact that any such analysis yields a vast zoo of mutations, most of which probably have nothing at all to do with the cancer. As an example of cancer genome analysis... The post Finding cancer genes (September 19, 2010) discussed an analysis of the genomes of some ovarian cancers; mutations in a particular gene were found in a substantial fraction of the cases, and seem likely to be relevant to the cancer.
New work has added an interesting aspect to the study of cancer mutations. Instead of just analyzing the genome from the cancer, they analyzed the genome of individual cells from the cancer.
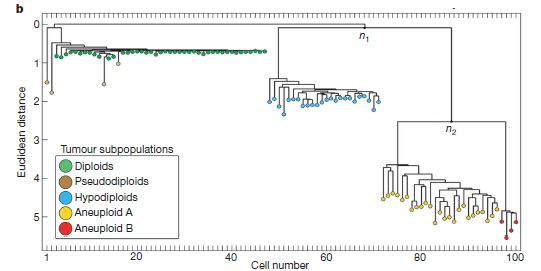
|
An example, from Figure 2b of the paper.
They analyzed the genome of 100 cells from a particular tumor. From that genome information, they assembled a chart showing the relatedness -- the family tree -- of those 100 cells.
It is very much like a common genealogy chart, except that this one is based on observed genome differences, not on knowing who derived from whom. That is, we infer who derived from whom by looking at the genomes.
|
The chart offers an unprecedented view of what is happening in the tumor.
The chart is analogous to a "tree of life" chart showing how different organisms are related. In fact, comparing genomes is now a key tool in making such tree-of-life charts.
The paper is quite complex, and some of the discussion seems excessive. After all, they have now done this for a total of two tumors; making broad generalizations seems unwarranted. The reason for posting this item is simply to note the technological development -- that they can now do this at all.
News story: With New Method, Researchers Can Infer How Tumors Evolve and Spread. (Science Daily, March 14, 2011).)
The article: Tumour evolution inferred by single-cell sequencing. (N Navin et al, Nature 472:90, April 7, 2011.)
One of the requirements for making this work practical is low cost sequencing, a development discussed in the post: The $1000 genome: Are we there yet? (March 14, 2011).
There is more about genomes on my page Biotechnology in the News (BITN) - DNA and the genome.
Leprosy: the armadillo connection
May 14, 2011
Leprosy (Hansen's disease) is an uncommon disease in the United States. Fewer than 200 new cases are reported each year. The source? Common wisdom is that leprosy is acquired only from an infected human. However, some of the new cases seem to have had no contact with infected humans -- either during foreign travel or locally.
A new paper suggests a source for these cases of leprosy, and it is an interesting story.
Leprosy is caused by a bacterium called Mycobacterium leprae. M. leprae is a difficult bug to deal with. It seems to be an obligate intracellular parasite, with a highly degenerate genome; it has never been grown outside cells. Further, it has been grown in only one animal other than humans, and that is the nine-banded armadillo -- which for simplicity we'll just refer to as armadillo. Armadillos are used as a model for studying leprosy infection -- the only model that is available. Further, armadillos can be infected with leprosy in nature; it is likely that they originally acquired the disease from humans, though it is now largely transmitted between armadillos. In some parts of the southern US, 20% of the armadillos may have leprosy.
Is it possible that these infected armadillos are a source of infection for humans? There has been some suggestion of that. But the new work makes a genetic connection. Genetic analysis shows that the M. leprae in many of the armadillos is a rather distinct strain, and that it is the strain found in some of those humans for whom we could not identify a likely source of leprosy infection.
We should be clear what the new work shows. It shows that the strain found in armadillos is almost identical to that found in some humans. There is nothing in the paper per se about transmission; the genetic similarity does not show who transmitted to whom. It is an inference from the whole picture, including this new genetic data, that it is likely that transmission is occurring from armadillo to human. It's a strong enough case that they suggest that people in the areas where there are infected armadillos try to minimize contact with them (including eating them).
News stories:
* Armadillos pass leprosy to humans, study finds. (Los Angeles Times, April 27, 2011.)
* Indigenous Cases of Leprosy Found in the Southern United States: Human Contamination Through Contact With Armadillos. (Science Daily, April 28, 2011.)
The article: Probable Zoonotic Leprosy in the Southern United States. (R W Truman et al, New England Journal of Medicine 364:17, April 28, 2011.)
Also see:
* Leprosy leads to rejuvenation in armadillo livers (November 29, 2022).
* An armadillo the size of a beetle (April 8, 2016). More about armadillos.
* A new approach for testing a Llullaillaco mummy for lung infection (August 17, 2012). More mycobacteria.
* Rats, bananas, and tuberculosis (March 11, 2011). The bacteria that cause tuberculosis and leprosy are related: both are from the genus Mycobacterium.
* The answer is cereblon (March 16, 2010). This post is about the drug thalidomide, which is used to treat leprosy.
* Twins (April 30, 2009). A bit about armadillo siblings.
How to fold a bag
May 13, 2011
Consider an ordinary paper grocery bag. You've emptied it. Wouldn't it be nice to fold it flat, for storage. Try it. I bet you can't do it -- at least while following the rules.
You may realize you knew that. Think about cardboard boxes. When cardboard boxes are folded flat, one opens the bottom (as well as the top). If your grocery bag were made of cardboard -- or of steel -- you really wouldn't be able to fold it flat. You get by with a bit of cheating with the paper bag, but that would not work with a rigid bag.
So what are the rules? What is this cheating we accuse you of? Again, if you haven't done it yet, go try it with an ordinary paper bag: try to fold the bag flat.
The basic rule is that you are supposed to fold it along the creases. That's all you are allowed to do. With a rigid material, such as the cardboard box, that's all you can do. With paper, we cheat a bit, and flex the paper itself.
What now? Engineers at Oxford University have figured out how to make a bag that will fold flat. A rigid bag: a steel bag. It's not an easy problem; much of the work is computer simulation -- and trial and error.
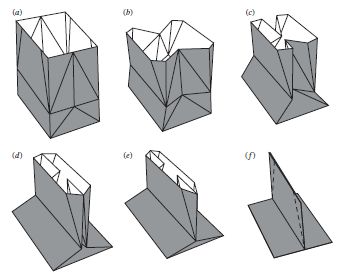
|
A bag that can be folded flat -- a computer simulation. (One more step is needed beyond what is shown, but that is easy enough.)
The basic shape of the bag (frame a) is "normal". What's novel is the pattern of creases, where folds occur.
This is Figure 4 of the paper.
After doing the simulation, and finding out what should work, they made such a bag. Figure 5 of the paper shows that a real bag, made as the simulation suggests, does fold flat. You can see Figure 5 in the paper, and parts of it are in some of the news stories.
|
This is fun. Is it useful? Folding boxes is a big deal; it's often done by robots. The news reports say that the authors are in contact with manufacturers of cartons regarding their proposed better box.
News stories:
* Paper, Plastic, or Steel? (Science Now, March 30, 2011.)
* Origami solution found for folding steel shopping bags. (PhysOrg, March 31, 2011.)
The article: A solution for folding rigid tall shopping bags. (W Wu & Z You, Proc. R. Soc. A 467:2561, September 2011.) Some may enjoy a look at Appendix A, to see how one makes a mathematical model of a grocery bag.
Previous folding story: Folding towels (April 10, 2010).
And more...
* A robot that can fold itself up (December 9, 2014).
* A box that will fold up upon command -- heat- or light-actuated switches (September 3, 2011).
More bags:
* Should bags be made from torrefied paper? (May 14, 2023).
* Doggy bags and the food waste problem (January 4, 2017).
May 11, 2011
Petri dish art
May 11, 2011
The 2008 Nobel Prize for Chemistry was awarded to three scientists for their discovery and development of fluorescent proteins (FP) that have become workhorses of modern biology. The founding member of the FP group was the green fluorescent protein (GFP), isolated from a jellyfish. More have been discovered, and -- importantly -- more have been made in the lab by redesign of the natural proteins. One of the prize co-winners was Roger Tsien of the University of California San Diego; he was responsible for much of the work on the design of a palette of fluorescent proteins.
The figure above, from the Tsien lab, shows off their achievements. Bacteria carrying genes for various members of the FP family were grown on a Petri dish. The dish was then irradiated with UV light, causing each FP to fluoresce. The resulting fluorescence image may even reflect the view out the window of the Tsien lab.
Musings noted the Nobel prize for GFP at the time of its announcement: Nobel prizes (October 8, 2008). That post links to the Nobel site, and also to a site for the GFP protein. (Yes, some proteins, too, have their own web site.) The post also discusses the "biology" prize, for work on the viruses HPV (human papilloma virus) and HIV (human immunodeficiency virus).
For a Musings post about the use of GFP: Regenerating a leg (September 1, 2009).
For more...
* Wikipedia: Figure source. Includes larger version.
* Tsien lab web site. Explore. The Images page includes the picture shown above.
There is more about art on my page Internet resources: Miscellaneous in the section Art & Music.
Thanks to Doug for sending this item.
Prejudice against outsiders -- in monkeys
May 10, 2011
Updated February 12, 2014...
The article that was the basis of this post has been retracted.
The authors requested retraction when they found they could not reproduce key results.
Notice: Journal site: abstract now includes retraction notice. The retraction was posted by the journal in January 2014.
There is a good discussion of the retraction at: Doing the right thing: Yale psychology lab retracts monkey papers for inaccurate coding. (Retraction Watch, December 24, 2013.) The page includes numerous comments by their readers; taken as a whole, this page is a good discussion of the subject of retractions of scientific articles, and of some of the quality control issues behind such articles.
Comments...
First, the authors deserve kudos for initiating the retraction when they found there was a problem with the article. This is also a reminder that there are various reasons for retractions; be careful about reading anything into them -- beyond the simple idea that the article no long stands.
The retraction inevitably raises the question... Does that mean the idea was wrong? No, it means that the data used to support it is being withdrawn. For now, it would seem that the question raised remains, and is subject to proper testing.
In fact, the situation with this article is more complex. The retraction notice, as discussed on the Retraction Watch page listed above, indicates that certain results from the original article seem incorrect, while others seem ok. (Some of this analysis was done by going back and re-examining the raw data. Thus it is possible to conclude that certain data were (or were not) analyzed incorrectly in the original article.) The specific experiment presented in the Musings post, below, is considered ok. The authors say they will resubmit that as a separate publication. It is a common procedure that a retraction involves an entire article. That removes it from the official record, but, as this paragraph makes clear, does not mean that everything in it is wrong. A good cautious response is to just pretend the article didn't happen. It's just as wrong to say the conclusions are wrong as it is to accept the article.
It can be hard to learn about retractions. I found this one accidentally. During a routine link check, the link for the news story was dead. Tracking this down led me to the retraction notice. It would have been nice if the news site had kept the link and noted the retraction.
Musings noted retracted papers in the post Does XMRV cause CFS? Wrap-up. (December 10, 2011). In that case, the retractions did not require any change in what Musings had posted. Instead, the retractions helped to wrap up a controversy that had been discussed in multiple posts.
There is another post with a retraction notice, at: Golden rice as a source of vitamin A: a clinical trial and a controversy (November 2, 2012).
The post, below, remains as it was originally, except for updating links.
It's us vs them. Much of what goes on in human society seems to have this undertone. Whether we call it prejudice or discrimination or racism or nationalism or tribalism, conflicts between groups are common. There is hardly a feature of humans that is not the basis for such behavior. Broadly, we can refer to such behavior as "in-group vs out-group", or, in shorthand, "us-vs-them".
We can even understand why such behavior may be beneficial. Imagine a sparsely populated earth, with family groups scattered around. It is, perhaps, reasonable to be suspicious of an "outsider". However, in our modern, densely packed world (think "globalization"), we now have some ideal against such discrimination by group membership. Is the us-vs-them bias biologically encoded in us? Is our modern cultural egalitarianism up against our innate biology? In asking these questions, I am not presuming an answer. The point is to ask the questions, and see what we can learn about our innate biological nature. A recent Musings post explored whether the hormone oxytocin might be involved in such responses: Is the hormone of love also the hormone of discrimination? (January 29, 2011).
Is us-vs-them bias unique to humans? I'm sure we could imagine why it might be one way or the other, but can we actually tell? Now, a group at Yale University has modified a standard psychological test that is used to study such biases in humans to do similar tests with rhesus monkeys. It is interesting how they do the test. And the answer? The monkeys, too, show bias against outsiders.
Here is one of their experiments... It takes a bit to describe it, but the basic idea is fairly simple, and used in a variety of psychological tests. (In fact, the same basic test was one of those used in the paper noted above.) The underlying idea is that the monkeys will look at something "strange" longer than they look at something "ordinary". So, they offer the test monkeys some pictures, and measure how long they look. In this experiment, each test is with a pair of pictures. One part of the pair is a monkey -- either an insider or an outsider. The other part of the pair is another object they know the monkeys consider good (a fruit) or bad (a spider).
The results are summarized in the following figure. Look first at the left side, for males. The two curves are different. What is behind these two curves? They are labeled "consistent" (dark symbols) and "inconsistent" (light symbols). "Consistent" means that a picture of an insider was paired with a good object (such as fruit), or that an outsider was paired with a bad object (such as a spider). That is, "consistent" means that both objects were good or both were bad. In contrast, "inconsistent" means there was one good object plus one bad object, such as an insider and a spider.
The pattern is clear. The males quickly adapted to the "consistent" pictures, and spent little time looking at them. However, they kept looking at the "inconsistent" pictures for several seconds, with no trend toward accepting them over repeated tests. Interestingly, the females adapted similarly to consistent and inconsistent pairs. See the right side of the figure.
Be cautious about interpreting this work, especially its possible relevance to human behavior. The key point here is that they have introduced a new method to allow study of the monkeys. They have some interesting -- but preliminary -- results. These need to be validated and extended. Even then, it is a big jump to understand the significance of the results for humans. (What is the significance of the sex difference shown above in the monkeys?) Understanding the behavior in monkeys may give us useful clues to explore. Further, it may be good to see how other animals, especially other primates, respond to such tests.
News story: Human Prejudice Has Ancient Evolutionary Roots. (ScienceDaily, March 18, 2011.) Beware of hype in the title. The article itself is generally good. Remember that titles and headlines are often written by someone other than the author, and are intended to attract attention. [This was originally at http://www.sciencedaily.com/releases/2011/03/110317102552.htm. It was removed when the article was retracted, If you really want to see it, check the Internet Archive.]
The article, via abstract at PubMed: The Evolution of Intergroup Bias: Perceptions and Attitudes in Rhesus Macaques. (N Mahajan et al, Journal of Personality and Social Psychology 100:387, March 2011.) Check Google Scholar and you may find a freely available copy.
For more on monkeys...
* Pink corn or blue? How do the monkeys decide? (June 9, 2013).
* The first chimeric monkeys (February 5, 2012).
* Speech: Taking turns (August 17, 2011).
Nature's "Top 50" institutions for scientific research
May 9, 2011
A year ago we noted that Nature magazine had started a focus on "Asian" science (loosely, for their purposes here, India and east, plus the South Pacific): Science in Asia-Pacific region -- as ranked by Nature (April 13, 2010).
In their update for 2010, they also include a list of the Top 50 institutions for the entire world -- based on publication in the Nature family of journals. Ranking is by authorship, with multi-author papers being allocated proportionally to the various institutions of the authors. Their purpose is to put the Asian results in a worldwide perspective. Our purpose here is simply the fun of seeing the listing.
Here are selected entries from their Top 50 list. They are in order; the indentation is for my convenience in the discussion that follows.
1. Harvard
2. CNRS
3. Max Planck Institutes
4. Stanford
9. Caltech
11. University of California San Diego
12. University of California San Francisco
17. University of California Berkeley
19. University of California Los Angeles
20. University of Washington
30. University of California Santa Barbara
39. Lawrence Berkeley National Laboratory
41. University of California Davis
Here is what the indentation pattern means...
The top three -- just for general reference. Note that they are from three different countries: USA, France, Germany. (Other countries with at least one institution in the Nature Top 50, in order of "first appearance" on the list: Japan, UK, Switzerland, Canada, China.)
University of California. (6 of the 10 UC campuses.)
Other institutions from California. (3 -- one of which is closely associated with UC Berkeley.)
One additional institution from the US west coast.
Overall, 10 of the top 50 institutions are from the US west coast (California, Oregon, Washington).
As another tidbit... Making the list of Asia-Pacific nations contributing to Nature journals in 2010 was one of the smallest countries. However, the paper from Tonga (population about 100,000) was, rather literally, of earth-shaking importance -- and made Musings: item from Tonga (September 12, 2010).
Caution...
Be careful with any such list attempting to rank institutions. It is not an objective undertaking. Any such list has assumptions and even idiosyncrasies. What is likely is that the 50 institutions listed by Nature are very good.
One example of a limitation that they note... Nature journals publish more in some fields of science than in others. Thus the list is biased in favoring those fields.
Another issue is that the listings are by "institution". But what is an institution? #3 on the list (see above) is the "Max Planck Institutes", a collection of institutes scattered around Germany. On the other hand, each campus of the University of California is considered separately. I do not know how they decide when to lump and when not. (If the ten campus University of California system were considered as a whole, it would be #1 on the list -- by far.) But this leads to a more general point: simply, size. Bigger places have an advantage in this system. As an example, my undergraduate school (Caltech) and my graduate school (Berkeley) are both listed (above). But Caltech is about 1/10 the size of Berkeley. It rates a bit above Berkeley on the Nature list, but would rate far above if the ratings were normalized to size. It would be nice to see a version of this list where size is taken into account. What is the proper measure of size? That would be another open question, once again showing that such lists are not entirely objective.
Updated January 30, 2016... Original source: Nature Publishing Index -- Global Top 50, at http://www.natureasia.com/en/publishing-index/global/. My list above is based on their list for calendar 2010. That page is no longer available, but has been superseded by: Nature Index.
A gene for obesity
May 7, 2011
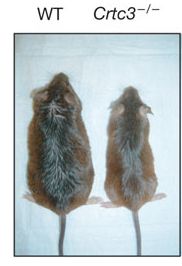
|
Mice lacking both copies of the Crtc3 gene (Crtc3-/-) are less fat than wild type (WT) mice, under conditions chosen to promote obesity.
This is Figure 1 part F of the article.
|
The article title may get a yawn. Another paper dealing with the details of energy balance -- in mice. However, towards the end of the article they make a connection to humans. They show that a mutation leading to increased activity of this protein correlates with increased obesity in Mexican Americans. That's consistent with the effect seen with mice. The effect is small, but statistically significant -- and confirmed by an independent analysis of a second population.
Interestingly, the mutation was not associated with greater obesity in non-Hispanic whites. There are a couple of possibilities for this finding. One is that the whole effect is a mistake -- an artifact of the particular analysis. The other possibility is that indeed the mutation is giving different effects in different populations, due to some combination of differences in genetic background or lifestyle (such as diet). It will take a while to sort this out.
For now, the work is a tantalizing hint. Regulation of energy balance is complex; the basic subject of the paper deals with the complexity. What is the relevance? Well, maybe it is relevant -- along with other things. Humans are complex, and we vary.
News story: Feast, Famine and the Genetics of Obesity: You Can't Have It Both Ways. (Science Daily, December 16, 2010.)
The article: CRTC3 links catecholamine signalling to energy balance. (Y Song et al, Nature 468:933, December 16, 2010.)
Among other posts that probe aspects of obesity...
* An obesity gene: control of brown fat (October 2, 2015).
* The junk food issue is global (April 7, 2012).
* Fructose; soft drinks vs fruit juices (November 7, 2010).
* A virus associated with obesity? (October 4, 2010).
For more about obesity, see the section of my page Organic/Biochemistry Internet resources on Lipids. The list of Musings posts there includes more on obesity and related issues.
The placebo: What is it?
May 6, 2011
The placebo is an important part of testing drugs. We give a pill to some patients, and compare the outcome to those who did not receive the drug. The drug worked. But, hold on. Maybe the people who got the drug just felt better because they knew they had gotten a drug; it can happen. To protect against this problem, everyone gets a pill: some get a pill that contains the drug, and some get a pill that does not: the placebo.
Did you ever wonder what is actually in a placebo pill? A group of researchers at the University of California San Diego wondered. So they looked at 150 recent reports of drug trials in top medical journals to see what was in the placebos used. The answer? They don't know. Most papers -- 98% of the papers involving pills -- did not say what was in their placebos!
Does it matter? Well, how would we know if it mattered if people do not say what the placebo is. It's actually a tricky question. It's an example of trying to figure out what the proper controls are for an experiment; sometimes it is not obvious. In the discussion they give some examples where the placebo issue is at least a concern.
News stories:
* Puzzle Me This. (G Stemp-Morlock, The Scientist, February 2011 page 20.) Good overview, with a range of alternative views -- including that the idea of the placebo is outdated.
* No Standard for the Placebo? (Science Daily. October 19, 2010.)
The article: What's in Placebos: Who Knows? Analysis of Randomized, Controlled Trials. (B A Golomb et al, Annals of Internal Medicine 153:532, October 19, 2010.)
More on placebos: The placebo effect: a mutation that makes some people more likely to respond (October 30, 2012).
May 4, 2011
Electric cars and pollution -- Follow-up
May 4, 2011
Original post: Electric cars and pollution (April 5, 2011).
A reader expressed concern that the post could be misinterpreted. The article is not a complete analysis of electric cars vs traditional gasoline-powered cars. It focuses on one issue: the effects of fuel usage, electricity vs gasoline, on emissions. In fact, it compares the fuels for the same vehicle: the plug-in electric hybrid (PHEV). Other analyses might, for example, also consider manufacturing and maintenance issues of electric vs gasoline engines, but these are beyond the scope of this article.
The confusion comes, in part, from the term "electric cars" in their title -- and then in mine. It would have been better to refer to use of electricity as fuel than to electric cars per se. The paper is quite clear, but the title suggests something else..
I have added this point to the original post.
The potato we call home: a study of the earth's gravity
May 3, 2011
In an earlier post we noted how measurements of local gravity from satellites in space were helping to reveal patterns of the water supply. [NASA weighs India, finds it deficient (October 2, 2009).] At the end of that post, we briefly noted that a new gravity project was starting: the Goce (Gravity Field and Steady-State Ocean Circulation Explorer) mission from ESA (the European Space Agency). We now have some results from Goce. It's preliminary -- just a simple news story, and some pictures.
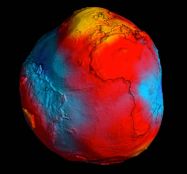
|
Earth: a gravity map -- or "geoid" .
Red is the strongest gravity; blue the weakest. The gravity is also coded into the relief (apparent elevation) in the image, greatly exaggerated of course, leading to the potato-like appearance.
This is one of many views shown in the BBC story listed below, and is greatly reduced.
|
Why does gravity vary around the earth? Well, because the earth is not uniform. For one thing, we know it is not really a sphere, but rather is a bit squashed at the poles. And we can see mountains; obviously there is more mass at a particular position if there is a tall mountain than if there is no mountain. But then there are less obvious factors that affect the gravity. The earth is made of many things, of different density; an obvious example is that water is less dense than rock. Beyond that, there are different kinds of rock, with different density. So, measuring local gravity around the earth is a clue as to what lies beneath. Changes in the or gravity map are also important. The study noted in the previous post used changes in the gravity map over short time intervals to map changes in water distributions. Studying changes in the gravity map may provide useful information about earthquakes. The current study is general, to establish a world wide base.
News story: Gravity satellite yields 'Potato Earth' view. (BBC, March 31, 2011.)
For more, including new information as it develops, see the ESA web site. The following page is their current announcement: Earth's gravity revealed in unprecedented detail. (ESA, March 31, 2011.) The page links to more information at ESA.
More about measuring gravity: How were the Gamburtsevs formed? (December 7, 2011).
Gravity and dark matter: Where is the dark matter? (May 11, 2012).
More gravity...
* Mars wobbles, too (January 24, 2021).
* A gravity sensor in a mold: a story of horizontal gene transfer? (May 16, 2018).
* Does anyone know how strong gravity is? (September 16, 2014).
* Quantum gravity: the musical version (September 25, 2013).
More about potatoes... Tracking the pathogen of the Irish potato blight (June 25, 2013).
On sharing electrons
May 3, 2011
The way we get energy is to burn our food. For example, we eat -- and burn -- sugar. This process involves removing electrons from the carbon atoms -- four electrons per C atom. Where do the electrons go? Well, for us they go to oxygen. We -- and most higher animals -- use oxygen, O2, as the electron sink; the oxygen gets the electrons and forms water, H2O. Sugar + oxygen → carbon dioxide + water; this biological process is commonly called "respiration", but overall it is chemically just like ordinary burning.
But what about organisms that grow without using O2? Where do their electrons go? There are various answers to that. Examples of other electron sinks that some organisms may use include nitrate ion, NO3-, and the iron(III) ion, Fe3+.
Sometimes things are more complicated. Some time ago, it was found that bacteria may work together to get rid of their electrons. One species might transfer its electrons to H+, making molecular hydrogen (H2), which is liberated. And then another species would use the H2, transferring the electrons to something else. This inter-species electron transfer via hydrogen helps both species grow.
More recently, it was found that some bacteria make electrical wires, and attach themselves to minerals. They get rid of their electrons through the wires; the minerals -- outside the cells -- are the electron sink.
And now? A report that these types of cells can connect up -- electrically -- with other cells. One species produces excess electrons, transfers them to the other via the electrical wires, and the second sends the electrons off to their ultimate sink. It's another demonstration of the diversity of bacteria, and of the interactions between organisms.

|
What they did was to inoculate two bacterial strains together. When growth was good, a portion was transferred to fresh medium.
The graph shows the growth of these bacterial mixtures, over time. The y-axis shows how long it took to achieve good growth at each step; that is, a high value here means slow growth. Each line is for one replicate culture. (This is Figure 1 of the paper.)
The graph shows that it initially took 30 days to achieve good growth, but over time this reduced to about 5 days. Clearly, the pair of bacterial strains had -- somehow -- adapted so they could grow better.
|
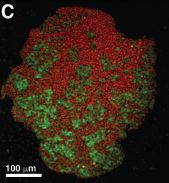
|
The enhanced growth was accompanied by the formation of aggregates, visible to the naked eye. The figure at left shows a cross section of one such aggregate, stained with a red stain for one strain and a green stain for the other. The picture shows that both strains of bacteria are within the aggregate.
The scale bar is 100 µm, or 0.1 mm. This is at about the limit of what one can see with the naked eye. Individual bacteria are on the order of 1 µm -- much too small to see. But the aggregate here is a half millimeter across, a quite visible dot.
This is Figure 2C of the paper.
|
Analysis of the bacteria showed that one of them had acquired a mutation enhancing the production of a cytochrome, a protein involved in electron transfer. The particular cytochrome is known to be involved in extracellular electron transport. Intentional addition of such a mutation re-created the effect; this kind of experiment shows that what they found is indeed relevant. In contrast, adding a mutation that interferes with hydrogen transfer had no effect. Together, these results suggest that the electron sharing in this case is due to the wires, containing a cytochrome, and not due to hydrogen transfer.
People have speculated about the possibility of direct electron transfer from one organism to another via electrically conductive wires, but this is the first time it has been shown. At this point, the process has been shown only in the lab under some special conditions. However, they suspect that it occurs in nature.
News story: Interspecies Electron Transfer: Anaerobic Bacteria Found to Cooperate. (Science Daily, December 4, 2010.)
The article: Direct Exchange of Electrons Within Aggregates of an Evolved Syntrophic Coculture of Anaerobic Bacteria. (Z M Summers et al, Science 330:1413, December 3, 2010.)
More... On sharing electrons -- II (June 9, 2013).
And...
* Better bacterial conductivity (November 3, 2020).
* A battery for bacteria: How bacteria store electrons (May 2, 2015).
More on unusual ways to energize bacteria: A living organism powered entirely by electricity? (February 22, 2013).
More cytochromes: Carbon-silicon bonds: the first from biology (January 27, 2017).
More on stretching things: Stretchable electric wires (January 22, 2013).
Top of page
The main page for current items is Musings.
The first archive page is Musings Archive.
E-mail announcements -- information and sign-up: e-mail announcements. The list is being used only occasionally.
Contact information
Site home page
Last update: March 4, 2026