Home
> Musings: Main
> Archive
> Archive for January - April 2023 (this page)
| Introduction
| e-mail announcements
| Contact
Musings: January - April 2023 (archive)
Musings is an informal newsletter mainly highlighting recent science. It is intended as both fun and instructive. Items are posted a few times each week. See the Introduction, listed below, for more information.
If you got here from a search engine... Do a simple text search of this page to find your topic. Searches for a single word (or root) are most likely to work.
Introduction (separate page).
This page:
2023 (January - April)
April 26
April 19
April 12
April 5
March 29
March 22
March 15
March 8
March 1
February 22
February 15
February 8
February 1
January 25
January 18
January 11
Also see the complete listing of Musings pages, immediately below.
All pages:
Most recent posts
2026
2025
2024
2023:
January-April: this page, see detail above
May-December
2022:
January-April
May-August
September-December
2021:
January-April
May-August
September-December
2020:
January-April
May-August
September-December
2019:
January-April
May-August
September-December
2018:
January-April
May-August
September-December
2017:
January-April
May-August
September-December
2016:
January-April
May-August
September-December
2015:
January-April
May-August
September-December
2014:
January-April
May-August
September-December
2013:
January-April
May-August
September-December
2012:
January-April
May-August
September-December
2011:
January-April
May-August
September-December
2010:
January-June
July-December
2009
2008
Links to external sites will open in a new window.
Archive items may be edited, to condense them a bit or to update links. Some links may require a subscription for full access, but I try to provide at least one useful open source for most items.
Please let me know of any broken links you find -- on my Musings pages or any of my web pages. Personal reports are often the first way I find out about such a problem.
April 26, 2023
Briefly noted... Novel Fe-O compounds in the Earth's inner core?
April 26, 2023
The solid inner core of the Earth remains quite mysterious -- and inaccessible. It is at extremely high temperature and pressure. It is, we think, composed mainly of iron, with miscellaneous things dissolved in it. Oxygen is generally thought to be uncommon. New work, using lab-scale high pressure systems, suggests that novel arrangements of Fe and O may be stable under inner-core conditions. These involve layers of Fe atoms and layers of O atoms. The familiar iron oxides are all at least 50% oxygen by atom count; the novel high-pressure structures reported here are iron-rich, more like Fe2O. The relevance to the actual inner core is open for now, but there may be more oxygen down there than we thought. In any case, the work is another example of the novelty of chemistry at ultra-high pressures.
* News story: Earth's inner core may be oxygen-rich. (Phys.org (Center for High Pressure Science & Technology Advanced Research), December 13, 2022.)
* The article, which is open access: Iron-rich Fe-O compounds at Earth's core pressures. (Jin Liu et al, The Innovation 4:100354, January 30, 2023.)
* How about Fe-He? Iron-helium compounds, which might be reservoirs of helium in the Earth core (May 21, 2025).
* More about the inner core: Briefly noted... Rotation of Earth's inner core (May 31, 2023).
* An earlier example of high-pressure chemistry: Novel forms of sodium chloride, such as NaCl3 (January 17, 2014).
Repairing corneas, using modified medical-grade pig skin collagen
April 25, 2023
The cornea is the outer layer of the eye. Musings has discussed an approach to dealing with a damaged cornea [link at the end]. A good result, but the treatment is complex.
A recent article takes a different approach. It focuses on a condition called keratoconus, which results in a highly distorted cornea. The condition not only interferes with vision, but interferes with wearing contact lenses.
The article reports a "pilot feasibility study" of the new approach in people with advanced keratoconus. The following table summarizes some bottom-line results...
|
| Pre-operative
| 24 months after operation
|
| Intolerant of contact lenses
| 20 (100%)
| 0
|
| Legally blind
| 14 (70%)
| 0
|
Those results are based on data in Table 1 of the article. I have combined the results for two cohorts, in different countries. The total number of people treated was 20.
The big picture is clear: major improvements.
The article contains much more data, including on the visual acuity achieved, but the summary above is fair. As for safety, no adverse events were reported. (The article follows the patients for only 24 months, as shown above.)
Among the other data...
* Significant improvement in measured vision in 19 of the 20 patients.
* Significant improvement in thickness of the cornea (which had been thinned by disease).
What did they do? Simple. They basically injected collagen into the cornea, with a small incision to open up a "pocket". The added collagen "took", helped flatten the cornea, and resulted in a smoother surface, which allowed for contact lenses.
Well, it is not quite that simple -- but it is close. The scientists did start with collagen. Pig collagen, which is a readily available material as a by-product from the food industry; it is approved for medical use (e. g., by the FDA in the US). They modified it to improve its properties, including mechanical properties. Most importantly, they cross-linked it. It took some experimentation to work out an appropriate modification.
Collagen is the major protein in the cornea, but the supply of human collagen is limited.
I assume that the modified collagen needs separate approval. That can follow from trials such as the ones reported here. The point of noting the FDA approval above was to indicate that the process starts with an accepted medical-grade material.
The collagen product is called BPCDX, for bioengineered porcine construct, double crosslinked.
This is a promising development. The raw material is readily available, inexpensive, and accepted in medicine. The modification is simple. The testament with the modified collagen is simple, as is the required follow-up. And the results so far, as reported in this article, suggest it is very effective and very safe.
News stories:
* Vision in Humans Restored Using Cornea Implants Bioengineered from Pig's Skin. (GEN, August 12, 2022.)
* Bioengineered cornea can restore sight to the blind and visually impaired. (Karin Söderlund Leifler, Linköping University, August 11, 2022.) The University is the lead institution for the work, along with Linkocare Life Sciences, a spin-off company involving some of the same people.
* Cornea implant made of collagen from pig's skin restores vision. (Danielle Ellis, News-Medical.net, August 23, 2022.) Interview with two of the authors of the article: Neil Lagali and Mehrdad Rafat.
The article (open access): Bioengineered corneal tissue for minimally invasive vision restoration in advanced keratoconus in two clinical cohorts. (Mehrdad Rafat et al, Nature Biotechnology 41:70, January 2023.)
Background post: Restoring sight by use of stem cells to regenerate a new cornea (July 13, 2010).
Among posts about collagen...
* Kidney regeneration in small rodents (December 14, 2021).
* Evidence for dinosaur protein extended by a hundred million years (May 12, 2017).
Features of Alzheimer's disease in dolphins?
April 24, 2023
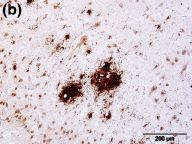
The following figure shows a brain sample tested with an antibody to amyloid-beta (Aβ), as reported in a new article...
|
It is quite positive.
The brain sample is from a dolphin, Globicephala melas, commonly known as the long-finned pilot whale.
The animal tested here was found dead, stranded on a beach. It was an old animal, though the exact age is not known.
This is Figure 1b from the article.
|
In humans, such deposits of Aβ are a hallmark of Alzheimer's disease (AD). Inevitably, we must ask: Did this dolphin have AD?
We don't know. AD is a type of dementia. We have no evidence about the mental state of this animal, much less any changes in it. The first encounter with it was after it died.
We can add a little more about what was reported here...
The work dealt entirely with dolphins found dead on beaches.
Several of the animals were found to have Aβ deposits in the brain.
Animals testing positive for Aβ were from three species of dolphin.
Further testing showed additional signs that are commonly associated with AD. They include signs of tau pathology.
Older animals were more likely to have Aβ deposits and other AD features than younger animals. This suggests development of AD features with age. Caution, the numbers are small.
The authors also note...
For all three dolphin species showing positive results for Aβ deposits, the amino acid sequence of their Aβ peptide is the same as for humans.
There is one major colony of captive dolphins; it is maintained by the United States Navy. The authors suggest that we consider monitoring that colony for AD.
It is tempting to speculate about whether AD might have contributed to the stranding of the dolphins, perhaps with younger animals following the lead of an afflicted elder.
It is an intriguing article. Be careful about over-interpreting it.
News stories:
* Dolphins show hallmarks of Alzheimer's disease, new study suggests. (Hafsa Khalil, CNN, December 21, 2022.)
* Dolphins may suffer from Alzheimer's disease, say researchers in Scotland -- Bottlenose dolphin, a long-finned pilot whale and a third species found to have markers of the degenerative disease. (Patrick Barkham, Guardian, December 19, 2022.)
* Stranded dolphins' brains show common signs of Alzheimer's disease. (Medical Xpress (University of Glasgow), December 19, 2022.)
* Commentary accompanying the article; it is open access: Of dolphins, humans, other long-lived animals and Alzheimer's disease (Commentary on Vacher et al.). (Guadalupe Pereyra & Paola Bovolenta, European Journal of Neuroscience 57:1180, April 2023.) A broad perspective on AD markers in animals other than humans. Recommended.
* The article, which is open access: Alzheimer's disease-like neuropathology in three species of oceanic dolphin. (Marissa C Vacher et al, European Journal of Neuroscience 57:1161, April 2023.)
The only previous post on AD in an animal other than humans: Do chimpanzees get Alzheimer's disease? (October 17, 2017).
My page for Biotechnology in the News (BITN) -- Other topics has a section on Alzheimer's disease. It includes a list of related Musings posts.
Posts about dolphins include: Do dolphins talk to each other? (November 19, 2016)
Graphene-based sensors for capturing your brain waves
April 22, 2023
If we could capture your brain waves, we could make use of them. Musings has noted work in this field [link at the end]. The field is described by terms such as brain-computer interface (BCI).
The best place to get the brain waves is in the brain. Indeed, some people have had electrodes implanted in the brain during surgery that was otherwise planned.
If we could capture brain waves from outside the head, the method would have wider applicability. However, it is difficult; the signal is much degraded.
A new article offers new developments in capturing brain waves outside the head.
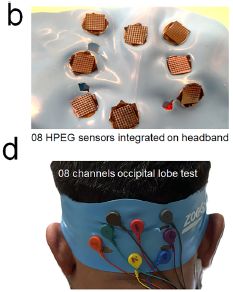
The first figure shows two views of the new system...
|
Start with part d (bottom). The person is wearing a headband, with sensors inside the headband. At this level, this is not particularly novel.
The sensors are positioned over the occipital region of the brain; the intent is to get signals based on the user's vision.
Part b (top) shows a set of sensor devices. The device is largely made of silicon, with multiple contact points. Each contact is a pillar with electrically conductive graphene at the tip. The overall device is about one centimeter across.
The person has about five millimeter-long hair at the region of the sensors. Hair is an issue in establishing good contact.
This is part of Figure 4 from the article.
|
Much of the article is about developing those graphene-tipped pillars. Current sensors typically use liquid contacts. Dry contacts would seem to have advantages, but establishing good contact, especially in scalp areas of complex curvature or in the presence of hair, is challenging.
The following table shows some data on their performance...
The test measured the sensitivity of the devices, expressed as signal-to-noise ratio (S/N). Eight individual dry-contact sensors were compared to eight traditional liquid-contact electrodes.
The traditional electrodes all gave a 30 decibel S/N ratio. The new dry-contact sensors gave results from 5 dB to 25 dB.
This is Table 2 from the article.
|
|
The authors are encouraged that their best results are close to the benchmark. They think that the variation is due to differences in the specific contacts. They hope that they can develop their system further, to get consistent good results using dry-contact sensors.
Part of the story here is using the person's brain waves to control a robot. Indeed there are some results in the article. Apparently, the robot understood the instructions correctly about 94% of the time. The robot part is fun, but the science here is learning how to get good brain waves from humans.
News stories:
* Researchers Develop Non-Invasive Graphene Sensors for Brain-Machine Interfaces. (Sci.News, March 21, 2023.)
* A graphene sensor to wirelessly control robots using only brain waves. (Nanowerk News (ACS), April 3, 2023.)
The article, which is open access: Noninvasive Sensors for Brain-Machine Interfaces Based on Micropatterned Epitaxial Graphene. (Shaikh Nayeem Faisal et al, ACS Applied Nano Materials 6:5440, April 14, 2023.)
A background post on BCI: Brain-computer interface -- without invasive electrodes (December 28, 2016). Links to more.
More about brains is on my page Biotechnology in the News (BITN) -- Other topics under Brain. It includes a list of related Musings posts.
Posts about graphene and such are listed on my page Introduction to Organic and Biochemistry -- Internet resources in the section on Aromatic compounds.
April 19, 2023
Briefly noted... Soda tax: effect on obesity rate
April 19, 2023
The idea of a "soda tax" is to reduce the consumption of sugar by raising the price of popular sugar sources that people tend to over-consume. Of course, the real goal is to improve health, e.g., by reducing obesity. Musings previously noted results following a local soda tax; the article reported a small reduction in consumption. We now have an article addressing changes in the incidence of obesity in children in the UK following such a tax. The headline conclusion is that there is a small reduction is obesity in 10-year-old girls; the reduction is most pronounced in lower income areas. No effect was seen in boys. As usual, the full story is more complicated. It is perhaps best to think of this article, too, as an early step in addressing the question.
* News stories:
- UK soft drink taxes associated with decreased obesity in girls -- Study tracking childhood obesity in England from 2014-2020 found 8% reduction in obesity among 10-11 year old girls coinciding with 2018 soft drinks industry levy. (EurekAlert! (PLOS), January 26, 2023.)
- Expert reaction to study looking at the UK sugary drinks tax and obesity in children. (Science Media Centre, January 26, 2023.) Diverse views, including some skepticism.
* The article, which is open access: Associations between trajectories of obesity prevalence in English primary school children and the UK soft drinks industry levy: An interrupted time series analysis of surveillance data. (Nina T Rogers et al, PLoS Medicine 20:e1004160, January 26, 2023.)
* Background post: The Berkeley soda tax: does a "fat tax" work? (August 30, 2016).
Unequal allele expression
April 18, 2023
We have two copies of most genes, one from each parent. (The exceptions don't matter here.) One might expect that those two copies function equally -- and thus contribute equally to our phenotype.
It need not be so. The following figure, from a recent article, is a cartoon guide to some possibilities.
Caution... The article discussed here is complicated and even confusing. It is about an odd -- and confusing -- phenomenon. The main goal here is to raise the idea that the two alleles of a gene may be expressed unequally, for reasons beyond our usual views of how genes function.
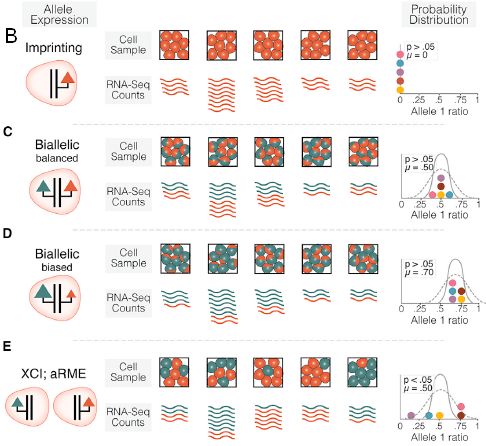
Start with part C -- the expected case. There are two alleles, and they function equally. (Note the equal arrows on the two gene lines at the left.) Biallelic balanced. Look at the wavy lines to the right. Five sets of them, reflecting five different sources (tissues) in the body. Each wavy line is for one RNA transcript. For each source, there are (approximately) equal numbers of red and green lines, indicating that the two alleles are transcribed equally. (The pictures labeled "cell sample" show this another way.) The little graph at the far right illustrates this with a probability distribution. It is centered on 0.5 (for the fraction of transcripts for one allele).
However, there are other possible results, shown in the other parts.
Part B shows the case of a gene that has been imprinted. One allele functions, one does not. All the transcripts are "red", and the probability distribution is an extreme 100% on one side.
Part D shows a case of a less complete bias, but always in the same direction. For each source, there are more green transcripts than red. The probability distribution is distinctly off to one side.
Part E shows a case where there is a variable bias. More green transcripts from some sources, more red transcripts from others.
This is part of Figure 1 from the article. For part B, there is more in the full figure; I have added the label B to the portion kept here.
|
The article is about that last case (E), where the expression of the two alleles is unequal, and the preferred allele varies. The authors call the phenomenon random allelic expression, or RAE.
The term "random" there reflects the current state of observation. The preference for one allele functioning varies, and it seems random to us at this point. It is probably best to not interpret the term further; it is quite possible that there is a good explanation for what happens, and it is not random once understood mechanistically. I prefer the term "unequal".
The random inactivation of one X-chromosome (X-chromosome inactivation = XCI) is one way to get this result. But what about genes on the other chromosomes (the autosomes)? The current article is an extensive analysis to see what happens for other genes. The main result is that about 2,000 genes show this behavior. That is about 10% of our genes.
We might say that the current article is about RAE beyond XCI. "aRME" in the figure means autosomal random monoallelic expression.
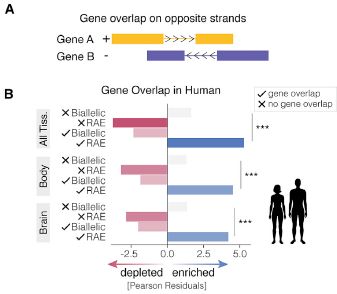
Why does that happen? The authors suggest that one way is for genes on opposite strands to interfere with each other. The interference may vary, depending, for example, on the tissue; the variable interference could lead to variable -- and seemingly random -- expression of an allele. The following figure illustrious this, and has some data...
|
Part A (top) shows the idea. Two genes, coded by opposite strands of the DNA, overlap. It may be that transcription of the two genes affects each other -- and we do not understand that. (In other cases, the two genes may be very close to each other, still with some effect.)
Part B (bottom) shows some data. Caution, it is a confusing figure, but we'll try to highlight the key point.
The top data set is for "all tissue". There are four bars. However, one is almost invisible; there is a faint (light tan?) bar in the top row, pointing to the right.
|
The first two bars are marked with an x, for "no gene overlap". The top bar (nearly invisible) goes to the right, showing that genes with normal bilallelic expression are enriched in the no-overlap set of genes. In contrast, the next bar shows that genes with RAE are depleted in the no-overlap set.
The next two bars (for all tissue) have a check mark, for "gene overlap". The results are just the opposite. For example, the lower, RAE, bar goes to the right, showing enrichment.
That is, genes that overlap are more likely to show RAE.
The other two data sets here separate the "all tissue" data into "body" and "brain". The qualitative pattern is similar. (There are some quantitative differences.)
This is part of Figure 5 from the article.
|
The figure is confusing, but the point is that it begins to show that there may be identifiable explanations for why some genes are expressed more from one allele than the other.
There seems to be some controversy about some of this work. It is difficult work. But the disagreement is probably more about details than the big idea: there are genes, perhaps many genes, whose expression from the two alleles is different. That can have implications for disease and treatment. Further attention will likely focus on improving the understanding of individual cases.
News story: Random Allelic Expression of Genes Could Complicate Disease, Diagnosis. (University of Utah, February 13, 2023.)
The article, which is open access: Random allelic expression in the adult human body. (Stephanie N Kravitz et al, Cell Reports 42:111945, January 31, 2023.)
A recent post about X-chromosome inactivation: X-chromosome inactivation in males -- in cancer (February 6, 2023).
A post about imprinting of chromosomes to indicate which parent they came from... Children with two fathers (January 3, 2011).
Can we distinguish monkey tools and human tools?
April 17, 2023
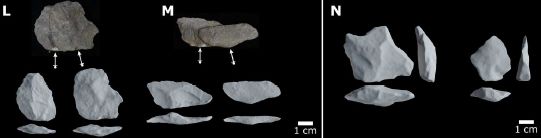
Look at the rock flakes in the following set of photos, from a new article...
Can you tell the difference -- between those to the left and right of the light vertical line (parts L and M vs part N)?
Don't spend too much time on that question. The scientists report extensive data on the nature of the flakes; the two types of flakes are -- largely -- the same.
This is part of Figure 2 from the article.
|
The flakes on the right (part N) are artifacts found with ancient hominin fossils. They are usually taken as evidence for intentional tool production by the ancients of our human lineage, dating as far back as 3.3 million years.
The flakes on the left (L & M) were made by macaque monkeys using stones to break open food sources (e.g., nuts, shellfish). The flakes formed during the stone use. The scientists observed the whole process, and also collected flakes that had accumulated in the surrounding environment.
The monkey-flakes are clearly unintentional. Doesn't that undermine the interpretation that the flakes associated with human (hominin) fossil remains reflect intentional tool production?
Be careful to distinguish tool use and tool production. The monkeys are using stone tools -- intentionally. But tool production is presumed to be more sophisticated, and to require a higher level of brain development.
That's the essence of the article. It weakens one kind of evidence for tool production by ancient humans.
There are some subtle differences between flakes from the two sources. Further work may show whether it is possible to distinguish flakes made intentionally vs unintentionally.
News stories:
* Macaques challenge the origin of tool invention. (Sukanya Charuchandra, Advanced Science News, April 4, 2023.)
* Surprising similarities in stone tools of early humans and monkeys. (Phys.org (Max Planck Society), March 10, 2023.)
Movies. There are seven movie files posted along with the article as Supplementary Material. They are provided together as a single zip file. Movie #1 shows the monkeys using stones to break open nuts (one minute; no narration, but well-labeled). The others show flakes, in various detail.
The article, which is open access: Wild macaques challenge the origin of intentional tool production. (Tomos Proffitt et al, Science Advances 9:eade8159, March 10, 2023.)
More stones:
* Do monkeys make stone tools? (December 18, 2016). Links to more.
* Sliced meat: implications for size of human mouth and brain? (March 23, 2016).
The importance of choline as a dietary nutrient
April 15, 2023
Choline is an essential nutrient. It is used to make the neurotransmitter acetylcholine; it is also a component of biological membranes. Humans can make choline, but not at sufficient levels. Choline is common in foods; perhaps as a result, we usually don't pay much attention to it.
A recent article focuses on what happens in choline deficiency. The main tool is a pair of mouse diets, one with a normal level of choline and one lacking choline. Some tests are done using ordinary mice, but some are done with a mouse strain considered a model for Alzheimer's disease (AD).
The following figure shows the growth of the two kinds of mice with and without choline...
|
The two black curves are for ordinary mice ("NonTg") with and without choline: solid line (ChN) and dotted line (Ch-), respectively.
The two red curves are for the AD-model mice, labeled "3x Tg-AD". (Tg-AD means transgenic for AD.) With and without choline, as above.
For each type of mouse, the mice are bigger with the choline deficiency (dotted line). For the Tg-AD mice, much bigger.
The solid black line (normal mice, normal diet) is taken as normal; choline deficiency leads to obesity.
This is Figure 2a from the article.
|
The next figure shows the results of a test for physical agility (motor function).
The y-axis is labeled "latency to fall". In plain English, how long can a mouse hold on (to a spinning rod) before falling? High numbers are good.
The two bars at the left are for the normal mice (nonTg), with and without choline. By any measure, the mice with normal choline (ChN) did better. (Look at the medians, the boxes, or the high tails.)
The two bars at the right are for the AD-model mice. The pattern is about the same; the overall results are a bit worse than for the normal mice.
This is Figure 1d from the article.
|
|
There is much more in the article. The big picture is that choline deficiency can have diverse and serious consequences. Aside from the consequences for normal mice, it can also make Alzheimer's disease worse. (A reminder... the AD-mice are a disease model, and sometimes not a very good one.)
This is not entirely new information. However, the importance of choline is often neglected, since it is widely found in food. Of course, that varies. The article serves to bring choline to our attention. Its relevance to AD is particularly important.
The authors note that 90% of Americans do not consume the recommended levels of choline. We also note that there is little basis for those current recommendations. And as a little bonus, excess choline may be bad for you. The choline story is quite incomplete.
News stories:
* The essential nutrient that nobody has heard of -- If you lack the nutrient choline, you may get liver disease. And your risk of getting Alzheimer's or cardiovascular diseases may increase. (Ingrid Spilde, Science Norway, January 25, 2023.) General; it notes the current article. Includes the chemical structure of choline at the top.
* Study explores effects of dietary choline deficiency on neurologic and system-wide health -- Reaching adequate dietary choline intake is critical to offset organ pathologies and may help protect the brain against Alzheimer's disease. (EurekAlert! (Arizona State University), January 17, 2023.)
The article, which is open access: Dietary choline intake is necessary to prevent systems-wide organ pathology and reduce Alzheimer's disease hallmarks. (Nikhil Dave et al, Aging Cell 22:e13775, February 2023.)
A post about one of the best known forms of choline... A bio-marker for SIDS? (June 27, 2022).
Added January 28, 2026.
More choline: Anxiety. 1. A choline connection (January 28, 2026).
An earlier post about TMA and TMAO: Red meat and heart disease: carnitine, your gut bacteria, and TMAO (May 21, 2013). These products can arise from choline, and also from carnitine, as discussed in this earlier post. (They may be the reasons why excess choline is bad for you.)
My page Internet resources: Biology - Miscellaneous contains a section on Nutrition; food and drug safety. It includes a list of related Musings posts.
My page for Biotechnology in the News (BITN) -- Other topics has a section on Alzheimer's disease. It includes a list of related Musings posts.
April 12, 2023
Briefly noted... Neurons at play
April 12, 2023
Remember Pong? A recent article reports that lab cultures of neurons can learn to play Pong, in minutes. Both mouse and human cells can do it (though the human neurons do better). It is a fascinating and complex story. The authors provocatively suggest that the cultures are sentient (see the title of the article); they go on to explain what they mean by that. Regardless of the hype, the work introduces an experimental system, DishBrain, that is likely to be useful. The key point is that an isolated system of neurons does things, gets feedback, and adapts (learns?).
* News stories:
- Watch Live Human Brain Cells in a Dish Learn To Play Pong. (SciTechDaily (Cortical Labs), October 12, 2022.)
- Human brain cells in a dish learn to play Pong in real time. (Science Daily (Cell Press), October 12, 2022.)
- Human Brain Cells in a Dish Learn to Play "Pong". (GEN, October 13, 2022.)
* The article, which is open access: In vitro neurons learn and exhibit sentience when embodied in a simulated game-world. (Brett J Kagan et al, Neuron 110:3952, December 7, 2022.) The lead institution is Cortical Labs (Melbourne, Australia).
* My page for Biotechnology in the News (BITN) -- Other topics includes a section on Brain. It includes a list of brain-related posts.
The sounds that plants make
April 10, 2023
A new article reports that plants make sounds when stressed.
How do you know a plant has made a sound? Just listen. Put your ear by the plant. Or use a microphone.
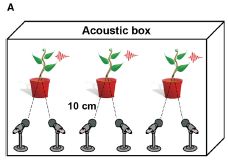
|
The basic apparatus used by the scientists in the new article.
(They were also able to record sounds in an ordinary greenhouse, with ambient noise.)
This is Figure 1A from the article.
|
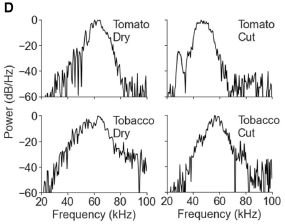
Actually, using a microphone is important. The following figure shows the frequency spectrum of sounds from two kinds of plants with two kinds of stresses...
In each case, the peak sound is at 40,000 to 60,000 Hertz (Hz).
(The highest frequency people can hear is usually taken as about 20,000 Hz. Human ears won't work well here.)
This is Figure 1D from the article.
|
|
What's the connection to stress? The plants only make the sounds when stressed. Cutting stems or stopping normal watering were the two stresses studied. They are the two stresses used in the previous figure. (There is no unstressed control shown in this figure.)
The following figure shows an example of the response to stress...
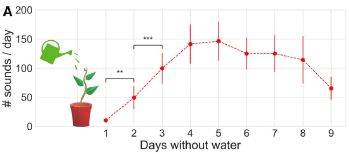
|
The figure shows number of sounds made per day (y-axis) vs days without water (x-axis).
The sounds increased steadily as water was withheld, at least for the first few days.
This is Figure 3A from the article.
|
Are these just random sounds?
Look...
The graph shows the frequency of sounds during the course of four days without water (tomato plants). That's the black curve (y-axis at left). The red curve shows the transpiration rate (y-axis at right).
Looks like there is some connection between the timing of the two activities, but it is not simple.
This is Figure 4A from the article.
|
|
Is anyone listening? A few scientists have started listening, and they are intrigued. Beyond that, this is an open question for now.
In addition to studying the natural role of plant sounds, we might also wonder about how we might make use of those sounds. For example, perhaps a farmer could improve crop watering by waiting until the plants ask for water.
It is an intriguing article, even provocative. As so often, time will tell.
News story: Stressed plants emit airborne sounds that can be detected from more than a meter away. (Phys.org (Cell Press), March 30, 2023.)
The article, which is open access: Sounds emitted by plants under stress are airborne and informative. (Itzhak Khait et al, Cell 186:1328, March 30, 2023.)
Also see:
* Electronic monitoring of plant health; it might even allow an injured plant to call a doctor (June 21, 2020).
* What should a plant do if it hears bees coming? (December 10, 2019). From the same lab.
* Inter-plant communication via the Cuscuta parasite (September 15, 2017).
* Can a plant learn to associate a cue and a reward? (March 3, 2017).
Is erythritol a toxic sweetener?
April 8, 2023
Erythritol is used as a sweetener in some food products. A new article suggests its safety should be examined more carefully.
The following figure shows the first set of evidence that got the scientists' attention. It involved looking at the medical records of a group of people already at risk of heart disease. (That is, it is not a random sample of the population. Further. the work is not a controlled trial.)
For this analysis, people were divided into four equal groups based on their blood levels of erythritol. The bottom 25% -- the first quartile -- is called Q1. The top 25% is Q4.
The graph at the left shows survival curves for people with those four levels of blood erythritol. You can see that survival is similar for people in the first three quartiles, but appears significantly worse for people in the highest quartile of erythritol blood level (Q4, red).
The graph at the right presents the same findings another way - as hazard ratios (HR). The results for the lowest quartile are set to 1; the results for each other quartile is shown as a ratio to those for Q1, with confidence limits. Again, there is no apparent effect for Q2 and Q3. However, there is an increased HR (risk) for those in Q4.
The HR are shown with and without adjustment. Adjustments were made for other known cardiovascular risk factors.
At the top of the left-hand graph is the chemical structure of erythritol. It is a sugar-alcohol, based on the sugar erythrose. (Other sugar alcohols that may be familiar are xylitol and sorbitol. The three named here differ in chain length; sugar alcohols may also differ in the configuration at individual C atoms.)
This is the top part of Figure 1 from the article.
|
The next figure explores the effect of erythritol on blood...
In this test, blood samples with and without erythritol were allowed to contact a test surface coated with collagen. After various times, the surfaces were checked to see if platelets had bound.
The left side shows the images. Green indicates platelets. The top row is for the blood with erythritol. At 2 and 3 minutes, you can see that more platelets are bound in the presence of erythritol (top row) than in its absence (bottom).
The graph at the right shows the quantitative results.
It appears that erythritol makes the platelets sticky. This could lead to excessive blood clotting.
This is Figure 4a from the article.
|
The first figure suggests a connection between high erythritol levels and heart disease. The second figure suggests a possible mechanism.
It is important to stress that the work here is suggestive but does not offer proof. The first figure shows a correlation, but is not a controlled trial. Although adjustment was made for some variables thought to be relevant, there is no assurance that proper adjustment is complete. The second figure shows what the chemical might do, but does not actually link it to disease.
What an article such as this does is to focus attention on this chemical, so that further, more definitive work can be done.
News stories:
* Zero-calorie sweetener linked to heart attack and stroke, study finds. (Sandee LaMotte, CNN, February 27, 2023.)
* Cleveland Clinic Study Finds Common Artificial Sweetener Linked to Higher Rates of Heart Attack and Stroke Research showcases the need for further safety studies. (Cleveland Clinic, February 27, 2023.)
* News story accompanying the article: Cardiovascular diseases: Non-nutritional sweeteners and cardiovascular risk -- The widely used artificial sweetener erythritol affects platelet function and is associated with major cardiovascular events - fuelling calls for a re-evaluation of the use and regulation of non-nutritive sweeteners. (Konstantinos D Rizas et al, Nature Medicine 29:539, March 2023.)
* The article: The artificial sweetener erythritol and cardiovascular event risk. (Marco Witkowski et al, Nature Medicine 29:710, March 2023.)
Previous posts on erythritol: none.
Among posts about added sweeteners:
* What should a plant do if it hears bees coming? (December 10, 2019).
* Artificial sweeteners: Saccharin and high blood sugar levels (December 7, 2014). Links to more.
More on blood clotting... Why bears don't get blood clots during hibernation (May 9, 2023).
April 5, 2023
Briefly noted... The Jerry Brown beetle
April 5, 2023
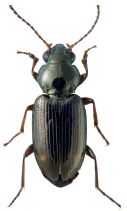
|
Bembidion brownorum (male).
This is reduced from Figure 1 of the article; the figure there is a full page. Actual length of the animal is about 5 millimeters.
Musings has noted organisms named after US Presidents. We now have one named after our former California Governor Jerry Brown. The connection between the beetle and the Governor? The re-discovery of the beetle occurred on the Governor's ranch.
|
* News story: Rare beetle, rediscovered after 55 years, named in honor of Jerry Brown. (Kara Manke, University of California - Berkeley, March 27, 2023.)
* The article, which is open access: Re-collected after 55 years: a new species of Bembidion (Coleoptera, Carabidae) from California. (David R Maddison et al, ZooKeys 1156:87, March 27, 2023.)
* Also see: Briefly noted... The Biden octopus (March 22, 2022).
|
Capturing CO2 in concrete
April 4, 2023
The production of concrete is a significant contributor to CO2 emissions.
A new article explores one approach to storing CO2 in concrete. If some such process could be shown to work, it would help to mitigate the CO2 emissions associated with making it.
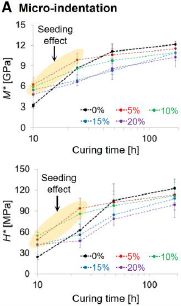
Here are some results, from lab-scale work on making concrete with variations intended to promote incorporation of CO2...
|
The figure shows two measures of the strength of the concrete, as it develops ("cures") over time (x-axis). The strength measures are shown on the y-axis, one per graph.
The test involves using various amounts of an additive.
Start with the top graph. The black line is for the control, with no additive. At early times, the additive actually leads to stronger concrete. By the end, the control concrete is the strongest -- but not by much. The results are similar for the second graph.
This is Figure 1A from the article.
|
That's the main point. The scientists have a way to make good concrete with a much reduced greenhouse gas contribution, by incorporating CO2 into it. We can quibble about the details, but if we take this as step 1, it is encouraging. The authors consider the work here a model system.
What did they do? The additive was sodium bicarbonate, a solid form of CO2. In the alkaline conditions of newly formed concrete, CaCO3 forms.
A key point is adding the CO2 (here, as bicarbonate) early; previous work had shown that adding such things to concrete that had largely cured led to loss of strength. But adding it early seems to work reasonably well. Curing is actually accelerated a bit; importantly, the quality of the final concrete is very similar to current concrete, based on the measurements so far. The article includes characterization of how the added CO2 is incorporated. The system can be developed further.
The authors refer to the process as forced carbonation. This refers to the CO2 (or bicarbonate) being added, rather than simply absorbed from, say, the air.
You'll encounter some unusual abbreviations in the article. The C-S-H in the article title means
calcium-silicate-hydrate. A key ingredient is described as C3S; that is alite: (CaO)3SiO2.
News stories:
* MIT Researchers Develop New Additives For "Green" Concrete -- Researchers at MIT are discovering new ways of making concrete that will release less carbon dioxide in the atmosphere. (Steve Hanley, CleanTechnica, March 29, 2023.) This story is largely based on the MIT press release (below), but also includes some notes about ancient Roman concrete.
* New additives could turn concrete into an effective carbon sink -- MIT engineers discover new carbonation pathways for creating more environmentally friendly concrete. (David L Chandler, MIT, March 28, 2023.)
The article, which is open access: Cementing CO2 into C-S-H: A step toward concrete carbon neutrality. (Damian Stefaniuk et al, PNAS Nexus 2:pgad052, March 2023.)
A post that alludes to the environmental costs of concrete: Building with wood: might it replace steel and concrete? (June 14, 2017)
Among other posts about concrete: Using the walls of a building as a rechargeable battery? (May 24, 2021).
Water disinfection in nanoseconds
April 3, 2023
Electricity kills.
Could one sterilize drinking water with electricity? Yes, but it is expensive.
A recent article offers a significant improvement in killing bacteria with electricity.
The following figure shows the bottom-line accomplishment. Caution... The figure has additional complexity beyond that.
The figure shows the killing achieved (y-axis) vs treatment time (x-axis; log scale) for old vs new devices (top, bottom).
Quick view... With the old device (part c, top), there is no killing detected until 200 µs, and the best killing is less than 20%, With the new device (part d, bottom), there is significant killing at the first time point, and 100% killing at the second time point. (The time scales are at least approximately the same for the two graphs; visual comparison assuming vertical alignment is fine.)
Unfortunately, there are many more bars in part d, for various conditions. To be more careful, we want a comparison under the same conditions -- except for the device. The top graph is for a single condition: electric field = 55 kV/cm. That same condition is shown with the same color bars in part d. There are only two such bars -- at the first two points. That is, the "quick view" above holds for the one condition shown here for both devices.
Beyond that, part d shows that other conditions, including lower electric fields, work.
The compassion between the 200 ms result at the top and the 200 ns result at the bottom leads to the claim that the required treatment time is reduced by more than a million-fold.
The electric field 55 kV/cm was achieved by applying 138 V across a 25 µm electrode gap. Because of the nanostructure, the effective electric field was estimated to be about 8 times higher, or about 400 kV/cm.
This is part of Figure 2 from the article.
|
The main point is that the new device allows complete killing with treatments in the nanosecond range.
What is this new device? How did the scientists achieve this killing machine?
The key development was to use tiny gold wedges, or "fingers", on the electrode surface. Each wedge is about 200 nanometers across at the tip. The gold wedges concentrate the charge, increasing the jolt delivered to the bacteria. It's the lightning-rod effect.
Is this practical? The authors suggest they have made a technical advance, establishing an idea. They envision that this might be developed into something useful at a small scale, such as at remote locations, with limited power.
The authors refer to their development as locally enhanced electric field treatment, or LEEFT.
How does killing occur? The concentrated charges cause the bacterial membrane to burst -- as shown in this figure [link opens in new window]. This is part of Figure 4a from the article.
News story: New ultrafast water disinfection method is more environmentally friendly. (EurekAlert! (Georgia Institute of Technology), February 16, 2023.)
The article: Nanosecond bacteria inactivation realized by locally enhanced electric field treatment. (Ting Wang & Xing Xie, Nature Water 1:104, January 2023.)
Among posts about gold... Prospecting for gold -- with help from the little ones (March 1, 2013). Includes a list of gold-related posts. <
This post is listed on my page for Biotechnology in the News (BITN) -- Other topics under Antibiotics. The list of Musings posts broadly includes various ways to reduce bacteria.
Briefly noted... Extracting rare earth elements from coal fly ash: use of various supercritical solvents
April 1, 2023
Coal ashes contain lots of metals, including low levels of the rare earth elements (REE). A new article reports studies of extraction of the REE, using supercritical fluids instead of organic solvents. In one test, the scientists started with coal fly ash that contained 0.0234% total REE, and obtained a product with 6.47% REE. That is a 276-fold enrichment -- with a product that is amenable to traditional chemistry. The authors tried supercritical nitrogen and air, as well as the more common CO2; the alternatives aren't quite as good, but they do have process advantages, and may be worth exploring further.
* News story: Novel process extracts rare earth elements from waste. (Tech Xplore (Beth Miller, Washington University in St Louis), March 24, 2023.)
* The article, which is open access: Supercritical carbon dioxide/nitrogen/air extraction with multistage stripping enables selective recovery of rare earth elements from coal fly ashes. (Yaguang Zhu et al, RSC Sustainability 1:251, March 2023.)
* Background post: Coal: a new source of rare earth elements? (April 6, 2016).
* Added September 4, 2025.
Another approach to recovering REE: Using bacteria to leach valuable metals, including rare earths, from rocks -- and to capture atmospheric carbon (September 4, 2025).
* Fly ash? It is the unburned solid material that would exit with the exhaust gases. It is now collected. See Wikipedia: Fly ash.
* This post is listed on my page Introductory Chemistry Internet resources in the section Lanthanoids and actinoids.
March 29, 2023
Briefly noted... Uracil found on asteroid
March 29, 2023
Analysis of samples brought back to Earth from the asteroid Ryugu shows the presence of uracil. That RNA base has been previously detected in meteorites. The new work extends the discovery to samples of known origin (collected directly at the asteroid); that eliminates some alternative possibilities, such as that the meteorite samples were merely contaminated over time on Earth. Nicotinic acid (niacin, vitamin B3) was among the other compounds found on Ryugu.
* News stories:
- Uracil found in Ryugu samples -- Samples from the asteroid Ryugu collected by the Hayabusa2 mission contain nitrogenous organic compounds, including the nucleobase uracil, which is a part of RNA. (Hokkaido University, March 22, 2023.)
- New asteroid sample study offers further hints of space origin for the building blocks of life on Earth. (Trevor Ireland, The Conversation, March 21, 2023.) By a member of the mission team, though not a listed author of this article.
* The article, which is open access: Uracil in the carbonaceous asteroid (162173) Ryugu. (Yasuhiro Oba et al, Nature Communications 14:1292, March 21, 2023.)
Other posts about asteroids include... Asteroids as a food source for astronauts (November 6, 2024).
Recycling poly(vinyl chloride)
March 28, 2023
PVC [poly(vinyl chloride)] is a major type of plastic. It is probably the least recycled of any major plastic. (Recycling of PVC in the US is usually taken as zero.)
Why is PVC not recycled? For one thing, it tends to give off HCl during many kinds of processing.
A recent article takes a fresh look at the PVC problem. The scientists start by trying to make use of that HCl.
The following figure tells much of the story...
Part a outlines the approach. The Cl is released from the polymer and used to make chlorinated aromatic compounds (arenes). Electrochemistry at both parts of that. This is done at room temperature, thus minimizing general release of HCl.
Part b shows the main specific reaction they study, using a specific aromatic precursor (compound 1) and adding a Cl to it (to make compound 2).
At the right of part b is a chemical, DEHP, commonly found in PVC as a plasticizer. More about this as we go on.
Part c provides some data on how well the process works. Focus on the blue part, with constant current. There are six values given for the percent yield of the desired product (compound 2). Four of them are better than 70%. The right hand column is particularly good. For those tests, that plasticizer DEHP was added. [Three molecular sizes of PVC were tested; only the smallest one (bottom row) gave a good yield without the additive.]
The red side of part c shows a test with constant voltage. That voltage was chosen to be "not quite enough". Nothing happened -- until they added the DEHP. This test provides evidence for the DEHP serving as an intermediary in the redox sequence.
This is Figure 1 from the article.
|
Overall, the article shows that the Cl in PVC can be put to good use. The additive in the PVC is useful, too, in making the reaction work. (There are complications on that point.) And what's left after using the Cl is closer to being a simple hydrocarbon polymer, which is easier to deal with.
The authors do not claim that they have a practical process here. What they claim is a novel way of looking at the problem, with some promising results.
News story: U-M team recycles previously unrecyclable plastic. (Morgan Sherburne, University of Michigan, November 30, 2022.)
The article: Using waste poly(vinyl chloride) to synthesize chloroarenes by plasticizer-mediated electro(de)chlorination. (Danielle E Fagnani et al, Nature Chemistry 15:222, February 2023.)
Previous posts about PVC: none.
A general post on plastics, with links to much more: History of plastic -- by the numbers (October 23, 2017).
Sleep deprivation and vaccine effectiveness
March 27, 2023
Does your sleep status affect your response to a vaccine?
It's not obvious what the connection would be. However, both sleep and immunity are complex, so maybe we should do the test.
A new article does a meta-analysis of the multiple studies that have been published on the question. The general sense is that there seems to be an effect.
The following figure shows the summary for one subset of the results. The focus here is on studies where there was an objective measurement of sleep status (rather than just self-reporting)...
The figure shows the "effect size" for several published studies. It's a complex figure; let's start with some highlights.
The red blob at the bottom gives the summary for all the tests shown here. It shows a significant effect, with a value just below 1. The width of the blob shows the 95% confidence interval. That confidence interval does not cross zero, which leads to us considering the results as significant (at the 95% level).
Above that are two blue blobs. Each of those is the summary for the portion of the figure just above it. Both blue blobs, too, give a value just below one, and appear to be significant.
Those three colored blobs suggest there is something interesting here, so let's look more closely.
Each individual line shows the results for one test. (This meta-analysis covers tests that have been previously published.) The line summarizes the results, and gives some information about that test.
The top set is for tests that included direct observation of the extent of sleep. The bottom set is for tests that are based on each person's habitual sleep pattern, which had been measured.
It is not clear from this article alone exactly what "effect size" means. Reference is given to other articles for the statistical analysis. Remember, a meta-analysis such as this involves integrating results from separate experiments, which may have quite different protocols. The article does describe the effect as similar to the waning of antibody levels over two months following a COVID vaccination.
This is Figure 2B from the article.
|
The general picture is that there appears to be an effect of sleep on vaccine effectiveness.
That is an intriguing finding. The authors note several limitations of the work and questions raised. Issues include...
* Small number of studies, with a small number of immunogens (target viruses).
* More of an effect for men than for women. You can see hints of this by comparing lines by sex in the figure above. Further analysis showed that there was a significant effect for men, but not a significant effect for women. (Sex hormone levels were not taken into account, and probably should be.)
* It is not clear when the sleep effect is most important. It seems likely that it would be very near the time of vaccination, but whether before or after vaccination is more important is open.
* There is limited data so far for older people, who often have sleep problems.
The authors suggest that it might be good to try to get good sleep for a few days before and after a vaccination. In some cases, that may be an easy step. Beyond that, the article raises questions that need further testing.
News stories:
* Shorter sleep duration associated with reduced antibody response to vaccination. (Andrew Rhoades, Healio, March 17, 2023.)
* Not getting enough sleep can dilute antibody response to vaccination, study finds -- UChicago, French team reports that sleep might be optimized to promote better immunization response. (Alison Caldwell, University of Chicago, March 17, 2023.)
The article, which may be freely available: A meta-analysis of the associations between insufficient sleep duration and antibody response to vaccination. (Karine Spiegel et al, Current Biology 33:998, March 13, 2023.) Interestingly, the authorship of this article includes the first authors from all the articles that were analyzed.
Other posts about things that may affect vaccine effectiveness...
* Why vaccine effectiveness may vary: role of gut microbiome? (February 27, 2015).
* Does it matter what time of day you get a vaccine? (October 26, 2012).
This post is listed on my page Biotechnology in the News (BITN) -- Other topics in the section Vaccines (general).
Using microneedles for drug delivery
March 25, 2023
Microneedle patches allow the delivery of materials (e.g., drugs, vaccines, nutrients) through a surface. Musings has noted developments in this field [link at the end].
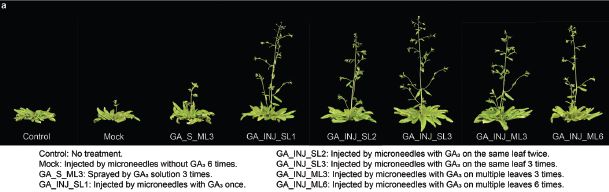
A recent article reports a new type of application. The following figure shows some results...
The patients here are Arabidopsis thaliana, a common model plant. More specifically, the strain used here is a mutant, dependent on added gibberellic acid (GA) hormone for proper growth.
The figure shows representative plants 16 days after initial treatment. The treatments were, from the left:
- control; no treatment.
- control; mock treatment (needles, but no hormone in them).
- traditional treatment, spraying GA.
- experimental treatment, using the microneedle patch with hormone. The last five plants are for variations of treatment with the needle patch.
This is Figure 3a from the article.
|
The general conclusion is that the microneedle patch gave good results. All variations of the treatment, including the simplest, gave similar results.
What about side effects? It is well known that plants respond to wounding with a damage-control response. The following figure gives an idea what happened in this case...
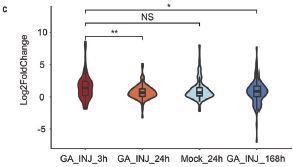
|
Caution... This graph is not very clear. We show it mainly to give an idea how the scientists looked at the issue.
The graph shows a measure of the wounding response (y-axis) for several cases.
What is measured is the level of gene expression for a group of genes known to be involved in the wounding response. That is expressed as a ratio compared to untreated. Since the ratio is shown on a log scale, the "ideal" value is zero.
|
Observations...
* The first two data sets are for the needle-patch treatment, at 3 and 24 hours. There is some effect, but it is significantly reduced by 24 hours.
* The third set is for the mock treatment (needles, no hormone) at 24 hours. The response is similar to the treated plants at 3 hr. That might suggest that the hormone is in fact mitigating damage.
This is Figure 2c from the article.
|
The general conclusion of the authors from experiments such as this is that damage due to the microneedle treatment is not a big concern.
The general point of the article is to open the door to the use of microneedle patches in agriculture. Among the features of the approach is that the payload is delivered directly into the plant, minimizing the wastage that typically accompanies other modes of application.
The article includes some testing with a variety of crop plants, including both monocots and dicots. The method seems to be widely applicable.
News stories:
* Researchers unveil "world's first microneedle" plant drug delivery system to tackle crop disease. (Food Ingredients First, March 14, 2023.)
* [Press Release] SMART researchers develop the world's first microneedle-based drug delivery technique for plants. (EurekAlert! (SMART = Singapore-MIT Alliance for Research and Technology), March 14, 2023.)
The article, which is open access: Drug Delivery in Plants Using Silk Microneedles. (Yunteng Cao et al, Advanced Materials 35:2205794, January 12, 2023.)
Background post about the use of microneedles: Treating a heart attack using a microneedle patch (January 11, 2019). Links to more.
Among posts about using Arabidopsis... Cauliflower math (July 26, 2021). Links to more.
March 22, 2023
Briefly noted... Viral co-infection: influenza and RSV
March 22, 2023
What if you get two viruses at once? A recent article explores what happens in lab culture for one pair of viruses: influenza A (flu) and respiratory syncytial virus (RSV). Turns out that co-infection with these two viruses has various effects, including the production of hybrid progeny. Such hybrid viruses can, for example, lead to cells being infected with flu via the RSV receptor. That is, flu infections can occur even in the presence of antibodies against the flu virus, or in the absence of receptors for the flu virus. Two big cautions: First, this is lab work; the implications for the real world are not known. Second, what happens will depend on the specific viruses, as well as the conditions. Interesting, but don't generalize.
* News story: New research sheds light on hidden world of viral coinfections. (University of Glasgow, October 24, 2022. Now archived.)
* The article: Coinfection by influenza A virus and respiratory syncytial virus produces hybrid virus particles. (Joanne Haney et al, Nature Microbiology 7:1879, November 2022.)
* Posts on flu are listed on the supplementary page Musings: Influenza. There are no previous posts on RSV.
Superconductivity near room temperature: let's try again, now using lutetium
March 21, 2023
Retraction note added, May 2024.
The article that was the basis of this post has been retracted, at the request of several of the authors.
The saga continues, this time with a dark turn. Not only has another article been retracted, but an investigation by the University points to misconduct by the lead scientist.
* Direct link to the retraction note at the journal web site: Retraction Note: Evidence of near-ambient superconductivity in a N-doped lutetium hydride. (Nature 624:460, November 7, 2023.) If you link directly to the original article, the retraction is noted there.
* News story: Exclusive: official investigation reveals how superconductivity physicist faked blockbuster results. (Dan Garisto, Nature, April 6, 2024. In print: Nature 628:481, April 18, 2024.) The focus of this news story is a report from the University after investigation of this matter and related events. It is a complicated and depressing story.
The post, below this update, remains largely as it was originally. At this point, it seems clear that neither the data discussed in this and the earlier Musings post nor the conclusions should be accepted.
In 2020 Musings noted the announcement that scientists had finally achieved the long-sought goal of superconductivity near room temperature (T). Two years later the article behind that post was retracted. The inability of others to reproduce the key findings was central to the journal making the retraction, over the objections of the authors.
We now have two new developments. Both follow the trend of studying high T superconductivity using hydrides.
First, there is a new article reporting superconductivity at room T in a new chemical. The previous report was with hydrides of sulfur, with some carbon. The current work, from the same team, is with hydrides of lutetium, doped with nitrogen. The results are actually better than in the previous work: superconductivity occurs at higher temperature than before, and also at a lower pressure.
Further, as we write this, we also learn that an updated article on the topic of the retracted article has been submitted, and is currently under review. More data, including some from other labs. (The preprint, not yet peer reviewed, is posted at ArXiv. There is a link below, with the background post.)
We included some data last time. Now, let's just enjoy the saga. This is a story of science in progress, in a very difficult field. We are already hearing caution from those in the field. Scientific stories develop over time, as people repeat and extend what has already been reported. Recognizing what the key breakthroughs were may only be clear in hindsight.
What we can say is that we have two new reports extending the story of superconductivity near room temperature. Our previous post on the topic turned out to be premature. We'll see how the new reports (including one that has not yet been peer-reviewed) turn out.
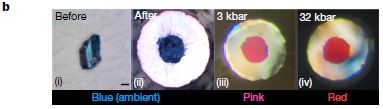
|
No numeric data, but one picture, showing the doped lutetium hydride of this work.
|
The left-hand photo shows the original material. (Scale bar = 10 micrometers.) The next three photos show the material in the measurement cell, at three different pressures (labeled at the top).
The material shows superconductivity only in the middle, pink, form.
What do the color changes in the material mean, and how are they related to superconductivity? They don't know.
This is Figure 1b from the article.
|
News stories:
* Evidence for 'near-ambient' superconductivity found in lutetium hydride. (Michael Banks, Physics World, March 8, 2023.)
* Muted Response to New Claim of a Room-Temperature Superconductor -- A research team says that they have made a material that conducts electricity without resistance at near-ambient conditions. The community has heard it before. (Sophia Chen, Physics 16:39, March 9, 2023.)
The two news stories listed above are from highly respected sources specializing in physics.
As always, you can find more news stories by using the article title (below) as a search term. In this case, I found that stories from generally reasonable sources had significant errors, perhaps propagating misunderstandings. Looking at a range of stories can be good, providing different perspectives. Just be careful -- as always.
* News story accompanying the article: Condensed-matter physics: Hopes raised for ambient superconductors -- A hydrogen-rich compound has taken the lead in the race for a material that can conduct electricity with zero resistance at room temperature and ambient pressure - the conditions required for many technological applications. (ChangQing Jin & David Ceperley, Nature 615:221, March 9, 2023.)
* The article: Evidence of near-ambient superconductivity in a N-doped lutetium hydride. (Nathan Dasenbrock-Gammon et al, Nature 615:244, March 9, 2023.)
Background post about superconductivity at room temperature: Superconductivity at room temperature -- at last (October 18, 2020). As noted there (and above), the article behind that post has been retracted. A new version of the article has been submitted, and is currently freely available as a preprint (prior to peer review): Observation of Conventional Near Room Temperature Superconductivity in Carbonaceous Sulfur Hydride. (Hiranya Pasan et al, ArXiv, February 22, 2023.) I have added this new article (preprint) to the original post.
Previous posts about lutetium: none.
This post is listed on my page Introductory Chemistry Internet resources in the section Lanthanoids and actinoids.
Graphullerene
March 20, 2023
Another new form of carbon. Graphullerene, reported in a recent article. The name is a combination of graphene and fullerene.
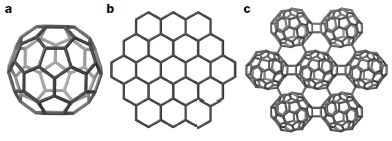
Look...
The three structures are: fullerene (a), graphene (b), and graphullerene (c). (The structures show the arrangement of the atoms, but omit double bonds.)
Fullerene is a ball-shaped molecule ("bucky-ball"). Graphene is a two-dimensional (2D) sheet of carbon atoms. You can think of graphullerene as a 2D sheet of fullerenes.
Note that there are two kinds of bonding between the fullerene units. The horizontal and vertical connections between fullerenes are different. (You can see this best by looking at the middle fullerene, which is fully surrounded (in 2D) by fullerenes.)
This is Figure 1 from the article.
|
That's a new chemical structure.
What did the scientists make it from? This stuff...
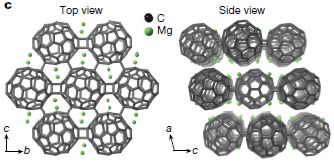
|
The left-hand view looks much like the graphullerene -- except for the green dots. Those green dots are magnesium (Mg) atoms. The right-hand view shows that this chemical occurs as a stack of such layers. The authors give the formula as (Mg4C60)∞. (Yes, they write the formula with an infinity sign.)
This is Figure 2c from the article.
|
Take that, dissolve away the Mg with a little acid, and you get graphullerene.
To fill out that story a little... The product is a multi-layer structure, which they call graphullerite, by analogy to graphite. They can mechanically pull off thinner samples, just as graphene is made from graphite by exfoliation. They have made material as thin as bilayer.
Properties? Here is an example...
Caution... This is a complex figure. However, there is one key point, which is quite simple.
The graph shows the thermal conductivity of materials (y-axis; log scale) vs temperature (x-axis).
Look at 300 K. Two isolated points (not part of any line) with open triangle symbols. The upper one is for graphullerene (more precisely, graphullerite), (C60)∞; the lower one is for fullerene, C60. The thermal conductivity of fullerene is increased by about a factor of 10 by joining the balls together to make graphullerene. That's interesting. Those two points are the only experimental data on the graph.
|
|
What about the sets of points (lines)? They show predictions of the thermal conductivity of graphullerene. Why three lines? For the three directions across the structure. Lines b and c are for the two different directions in the plane of the graphullerene structure; these give the two lines with predicted high thermal conductivity, at the top. Line a is for the direction through a small stack of such planes (graphullerite). The single measured value is in the range of the predictions.
This is Figure 5b from the article.
|
Another form of elemental carbon. And at least a hint of interesting properties.
This could be the first in a new class of chemicals. There are various kinds of fullerenes, and various ways one might connect them. Further, one can make modified fullerenes, and thus get modified graphullerenes. They would not be forms of elemental C, but they would be novel chemicals.
News stories:
* Graphene-Like Sheet Made from Fullerenes. (Chemistry Views, January 12, 2023.) The top picture gives a good idea of the structure of one layer of graphullerene. Note the different horizontal and vertical layouts.
* Newly discovered form of carbon is graphene's 'superatomic' cousin. (Phys.org (Ellen Neff, Columbia University), January 5, 2023.) Includes a cute picture; note the name on the shirt.
The article: A few-layer covalent network of fullerenes. (Elena Meirzadeh et al, Nature 613:71, January 5, 2023.)
A recent post about carbon: A new form of carbon -- hard enough to scratch diamond (March 1, 2022). Links to more.
Posts about fullerenes include: Y-Y: the first (May 5, 2019).
Posts about graphene and such are listed on my page Introduction to Organic and Biochemistry -- Internet resources in the section on Aromatic compounds.
Briefly noted... A pathway to renewable acrylate
March 18, 2023
Acrylates are an important type of plastic -- derived from petroleum. Would it be possible to make them from biomass? In fact, the basic monomer unit, acrylic acid, is just a single step from the common biochemical lactic acid. On paper. It's hard to do, because of competing reactions. A recent article reports progress on making acrylic acid from lactic acid (or the simple derivative methyl lactate). Catalyst development is a key part of the work.
* News stories:
- Chemical researchers discover catalyst to make renewable paints, coatings, and diapers. (Nanowerk News (University of Minnesota), January 9, 2023.)
- Can We Sustainably Manufacture Acrylic Acid? (Samudrapom Dam, AZo Materials, January 25, 2023.) Among the "Related Stories" listed there is one with the title "Catalyzing the Sustainable Production of Acrylic Acid ..."; it is an interview with one of the authors of the article.
* The article, which is open access: Multifunctional Amine Modifiers for Selective Dehydration of Methyl Lactate to Acrylates. (Yutong Pang et al, JACS Au 3:368, February 27, 2023.)
* Related: A "greener" way to make acrylonitrile? (January 6, 2018).
March 15, 2023
Briefly noted... America and Asia are getting closer
March 15, 2023
Geologically speaking. It is known that the Pacific Ocean is getting narrower, by a few centimeters per year. A recent article explores the processes involved. The article predicts that the narrowing will continue, leading to the formation of a new super-continent, called Amasia, within about 300 million years. The Pacific Ocean is the oldest ocean. That means it has the thinnest oceanic crust, a key feature that leads to the prediction that its closure will be the dominant process leading to the next super-continent.
* News story: Pacific Ocean set to make way for world's next supercontinent. (Lauren Sydoruk, Curtin University, September 29, 2022.)
* The article, which is open access: Will Earth's next supercontinent assemble through the closure of the Pacific Ocean? (Chuan Huang et al, National Science Review 9:nwac205, December 2022.)
* Previous post mentioning super-continents: How were the Gamburtsevs formed? (December 7, 2011).
Ultra-fast PCR
March 14, 2023
Here are some results from a PCR (polymerase chain reaction) run, as reported in a recent article...
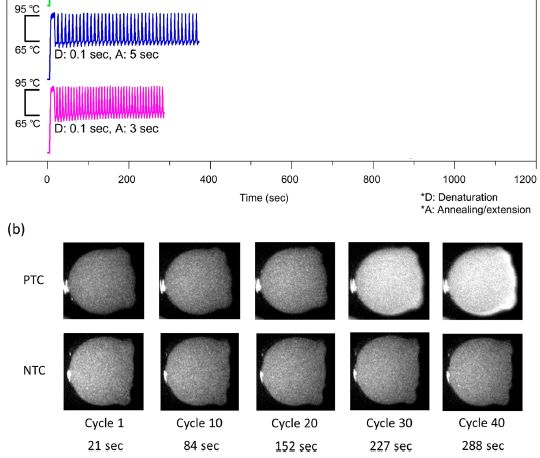
Start with part b (bottom). The first row, labeled PTC, shows the results for a DNA sample from E coli. The second row, labeled NTC (no-template control), shows the results for a run with no target DNA. You can see that the E coli sample lit up in the last two pictures; the control did not light up at all.
The labeling at the bottom shows... the two time points that lit up were at 30 and 40 cycles -- about 4 or 5 minutes in the PCR.
That is, this PCR is more than ten-fold faster than traditional PCR.
Above part b are graphs showing the temperature (T) profiles during two PCR runs. The lower one (red) is for the type of run shown in part b. It shows that the denaturation part of the PCR cycle was 0.1 second, and the annealing/extension part was 3 seconds. The entire run, 40 cycles, was about five minutes. The upper graph (blue) shows the T profile for another experimental run -- much slower, taking nearly seven minutes for 40 cycles.
This is part of Figure 6 from the article. I have included part b, and the bottom left of part a.
|
The big idea here is that the scientists have developed a version of PCR that is about 10 times faster than conventional PCR. All the PCR logic is the same, and the quality of results seems similar. It is just faster.
How did they do this? By heating with a laser, using materials that absorb light and give off heat. The idea is not new; making it practical in this context is.
The photothermal material here is based on graphene, and allows heating and cooling at rates above 20 °C per second. The PCR reaction materials are embedded in a hydrogel matrix, with a reaction volume of about 100 nanoliters (0.1 microliters). Multiple PCR tests can be run together.
Is this ready to go? Apparently not quite. The authors say they need another year or so of development work to make a convenient commercial version of ultra-fast PCR.
News story: This PCR Covid-19 test takes only 5 minutes: KIST. (Lee Han-soo, Korea Biomedical Review, January 6, 2023.) There is actually nothing in the current article about Covid; otherwise, the story itself here is fine.
The article, which is open access: Ultrafast Real-Time PCR in Photothermal Microparticles. (Bong Kyun Kim et al, ACS Nano 16:20533, December 27, 2022.)
Posts that mention PCR include...
* Targeted degradation of the viral genome as a treatment for COVID? (March 13, 2022). A post about an article that includes a conventional use of PCR to measure the level of a viral genome.
* An easier way to tell if a mosquito carries Zika virus? (June 2, 2018). A post about an article that claims an assay 20 times faster than PCR -- but that assay is unrelated to PCR.
* Science: breakthrough of the year (January 4, 2010). History; see the note at the end.
A perspective on POC... POCDx -- What's the barrier? (January 29, 2013). POC stands for point-of-care. Dx, in the title, stands for diagnostics. The current article can be thought of as moving PCR toward POC use.
Posts about graphene and such are listed on my page Introduction to Organic and Biochemistry -- Internet resources in the section on Aromatic compounds.
Biomarkers for Alzheimer's disease
March 13, 2023
Can we detect early signs of Alzheimer's disease (AD), before dementia becomes apparent? The common features, involving brain proteins, are hard to measure. Is it possible that there are early signs of AD in the blood? In fact, there have been some encouraging results.
Here are some results from one new article...
Part A (left) shows the amount of a protein called GFAP (glial fibrillary acidic protein) in the blood of people with and without a particular type of genetic mutation that leads to AD. For those with the mutation (mutation-carriers, MC; red), the protein level is plotted against the estimated time of disease onset (x-axis; see below). For those without the mutation (non-carriers, NC; blue), something similar was done. The gray regions around each line show the 95% confidence bands.
The two lines are strikingly different. If we take the graph at face value, it would appear that the blood level of this protein begins to increase nearly twenty years before the disease becomes apparent. Further, the difference becomes statistically significant ten years before disease onset. (Statistical significance is where the gray regions diverge.)
Part B (right) shows the same type of analysis for another protein. This is for P-tau 181, a particular form of tau. The results are qualitatively similar, though not as good for making early predictions.
What does estimated time of disease onset mean? A bit complicated, but the idea is that the scientists have experience with the mutations studied here, and can estimate the likely age of onset of symptoms for the carriers. This is explained on page 2 of the pdf, under the heading "Estimated years to symptom onset". It is not entirely clear what they did for the non-carriers; I suspect they are simply age-matched.
This is part of Figure 2 from the article. The full figure shows results for two more proteins. Both show some effect, but less than the ones shown above. One of them is not statistically significant at this point.
|
Overall, the results are encouraging. A routine blood sample could be analyzed, and yield a prediction about AD ten years in advance.
Importantly, such markers could be useful for testing drugs or other treatments prior to the usual AD symptoms.
The particular protein that looks so good here as a biomarker, GFAP, is probably an indicator of an immune response to early AD changes in the brain.
There are various questions one might have. Among them...
- The work here is for one type of AD (caused by a particular type of mutation). Do the findings hold more generally for AD? (Evidence available so far suggests, yes, but the evidence is limited.)
- Would predictions be improved by combining data from multiple markers?
Finding a blood marker that is elevated a decade before the onset of AD symptoms is a promising development. For now, it should be considered a research finding; pre-symptomatic prediction of AD in the general population is still for the future.
News stories:
* Alzheimer's Disease Detectable Via Blood Biomarkers a Decade Before Clinical Symptoms. (GEN, January 11, 2023.)
* Blood-based markers may reveal Alzheimer disease ten years before symptoms show. (Science Daily (Karolinska Institutet), January 10, 2023.)
The article, which is open access: Plasma biomarker profiles in autosomal dominant Alzheimer's disease. (Charlotte Johansson et al, Brain 146:1132, March 2023.)
A previous post about an attempt to develop a biomarker for the early detection of AD: Alzheimer's disease: a blood test that might be used for people with some signs of cognitive decline (January 16, 2021).
My page for Biotechnology in the News (BITN) -- Other topics has a section on Alzheimer's disease. It includes a list of related Musings posts.
The whitest feathers
March 11, 2023
We have talked about white paint before [link at the end]. Now, white feathers.
The following figure tells the story...
Part a (left) shows two birds. The white tips of the tail feathers are distinctive.
The birds are Eurasian woodcocks, Scolopax rusticola.
Part b (right) shows the reflectance of the feathers (y-axis), measured over the visible spectrum (x-axis; in nanometers). The top curve is for the white feather tips from these woodcocks. The other curves are for feathers from other kinds of birds, as reported in the literature. Some are labeled here; a literature reference is given for the full data.
It's clear... The white feather tips for the woodcock are the most reflective. That's the first major point of the article.
This is part of Figure 2 from the article.
|
The birds may communicate their presence by the white feather tips. These birds are most active at times of dim light (dawn and dusk). The highly reflective feather tips may well be an adaptation to promote communication in dim light. The location and limited scope of the white regions also allow the birds to remain concealed as they sleep during the day. However, there is little actual information on the matter. (The two birds shown above are a female on the ground and a male in the air.)
How is such high reflectance achieved? The authors went on to explore that, largely through electron microscopy analysis of the feather structure. The feather tips are interesting structures, with these very bright tips, yet consistent with the generally camouflaged nature of the bird.
News stories:
* The Whitest Feathers of Any Bird Have Been Found, And They're Dazzling. (Felicity Nelson, Science Alert, March 7, 2023.)
* European woodcocks have the brightest feathers known to exist. (Josh Davis, Natural History Museum (London), March 1, 2023.) The Museum was one of the institutions involved in the work.
* Woodcocks have the brightest white feathers ever measured. (EurekAlert! (Imperial College London), March 1, 2023.)
The article, which is open access: How woodcocks produce the most brilliant white plumage patches among the birds. (Jamie Dunning et al, Journal of The Royal Society Interface 20:20220920, March 2023.)
Background post about white paint: A lightweight white paint (January 23, 2023). Links to more.
Previous post about feathers -- and their color... Are birds adapting to the radiation at Chernobyl? (August 3, 2014).
March 8, 2023
Briefly noted... Analyzing rainfall trends at the sub-hourly level
March 8, 2023
Scientists have recently reported on the intensity of rain over short time periods (sub-hourly) in Sydney, Australia. It is increasing. The peak intensity of rainfall is increasing even when total rainfall is not changing much. The reason is not known; if it is related to what is commonly called climate change, it is largely beyond the resolution of current modeling. Its generality is also open for now. But short bursts of intense rain are the basis of flash flooding, so the finding may well be of practical importance.
* News stories:
- 'Rain bursts' over Sydney have intensified 40% over last two decades, research finds -- New analysis of weather data suggests potential for severe flash flooding has increased far beyond predictions. (Donna Lu, Guardian, November 10, 2022.)
- Think storms are getting worse? Rapid rain bursts in Sydney have become at least 40% more intense in 2 decades. (Hooman Ayat et al, Conversation, November 10, 2022.) From three of the authors of the article.
* The article: Intensification of subhourly heavy rainfall. (Hooman Ayat et al, Science 378:655, November 11, 2022.)
How to make yourself more transparent while you sleep
March 7, 2023
Here is the phenomenon...
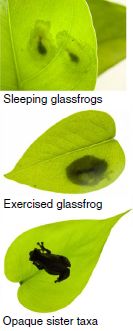
|
Start at the bottom. The bottom leaf has a little frog on it. An ordinary frog.
The first two pictures also have frogs on them, about the same size, but a different (but closely related) kind. The (two) frogs in the top picture are sleeping; the frog in the second picture is active ("exercised"). It is much easier to see the active frog. That is, when sleeping, this kind of frog is hard to see; it is largely transparent.
Such frogs are known as glassfrogs. (Yes, that is one word.) How they execute this camouflage has long been of interest. It clearly involves multiple steps.
The glassfrogs here are Hyalinobatrachium fleischmanni.
The frogs can be as small as 2 cm long.
This is part of Figure 1A from the article.
|
A recent article reveals one step in how glassfrogs become transparent. They hide their blood cells -- in the liver.
The following pair of images provides some of the evidence...
Two images of the same frog. On the left, it is sleeping. On the right, it is anesthetized; for our purposes here, that is "active", meaning not sleeping.
The imaging shows the circulatory system. More specifically, it shows oxygenated hemoglobin.
For the active (anesthetized) frog, you can see the circulatory system throughout the animal. But for the sleeping frog, oxygenated hemoglobin is mostly gone -- except for small dense regions in the middle. Most of the hemoglobin has been concentrated to the liver.
The color bar scale, at the bottom, shows that it is in terms of degree of oxygen saturation, sO2. For a start, yes/no is sufficient.
This is Figure 2A from the article.
|
There are more tests reported in the article to reinforce that interpretation.
From the top figure, it is reasonable that becoming transparent is a survival tactic, a type of camouflage. The current work reveals part of how it works.
Making such measurements is not easy. The whole point is that the measurements must be made on undisturbed sleeping frogs. The work uses an unusual imaging technique, called photoacoustic microscopy (PAM). In this technique, a light signal is converted to sound by the analyte.
In vertebrates, high concentrations of blood cells can have serious consequences. How do the frogs avoid that? An interesting question, with possible implications for human cardiovascular health.
News stories:
* Study: Glassfrogs Hide Red Blood Cells in Their Liver to Achieve Transparency. (Sci.News, December 28, 2022.)
* Glassfrogs Hide Red Blood Cells in Their Liver to Become Transparent -- Researchers finally decipher how a species of frog becomes a master of camouflage with the help of modern biomedical imaging techniques. (Michaela Kane, Duke University, December 27, 2022.)
The article: Glassfrogs conceal blood in their liver to maintain transparency. (Carlos Taboada et al, Science 378:1315, December 23, 2022.)
There are five movie files posted with the article. (Available there as a single zip file.) The first two are perhaps the best, with good pictures and some good action. (About one minute each; no sound, but reasonably labeled.)
Among other posts about frogs...
* Does the frog population affect the incidence of malaria? (October 17, 2022)
* Designing reconfigurable organisms (January 19, 2020).
* The smallest frog (January 31, 2012).
A recent post about transparency in an animal: Evidence for a REM stage of "sleep" in spiders? (October 11, 2022).
Among other posts about transparency...
* Transparent wood (March 6, 2021).
* Transparency of clinical trials -- Is the flu drug Tamiflu worthless? (May 4, 2014).
* Transparent soil (October 13, 2012).
Keanu Reeves and a broad-spectrum fungicide
March 6, 2023
Yes, there is a joke in there. But there is a good science story, too, and that will be our main focus.
The following figure shows some results for a fungal infection, as reported in a recent article...
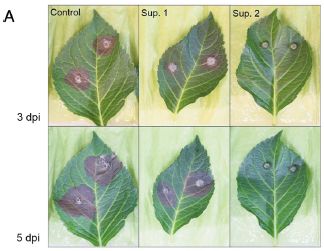
|
Three leaves were infected with small blocks of fungus (Botrytis cinerea) at day 0; the light circles show the infection sites. Two leaves were then treated with a solution of a new anti-fungal agent. A "control" leaf was not treated. The leaves were examined at days 3 and 5 dpi (days post infection).
The dark area around the fungal inoculum shows the damage caused by the infection. See the control (at the left).
Both treatment solutions reduced the damage; "Sup 2" (at the right) did so almost completely.
This is Figure 4A from the article.
|
What is this new anti-fungal agent? It is keanumycin A, one of a group of closely related chemicals reported in the new article.
Here is keanumycin C...
|
It is a lipopeptide. It has a hydrophobic tail at the upper left. The rest is basically a small peptide -- a nonribosomal peptide, made by a series of enzymes that add specific amino acids. Such enzyme-directed synthesis (rather than mRNA-directed on ribosomes) allows for unusual subunits. In fact, both the lipid and amino acid parts of the keanumycins include some unusual features.
The red shows distinctive features of keanumycin C.
I chose to show keanumycin C here, because it is the clearest structure shown in the article.
This is part of Figure 1A from the article.
|
The test shown in the top figure is with a fungus that is a serious plant pathogen of economic importance. Further testing showed that the keanumycins are active against a wide range of fungi, including some important human pathogens. There is some evidence suggesting they are of low toxicity. There is enough here to warrant further study of the keanumycins.
How did the scientists find these novel agents? It's a complex and clever story. The authors were working with Pseudomonas bacteria, and found that they killed amoebae. This finding led them to explore the bacterial genome, where they found genes that could lead to the type of product discussed here. Getting from amoebae to fungi, with low toxicity to plants and animals, is not a simple jump, but that is what the data suggest at this point. We'll see.
How do these agents act? Probably at the level of the membrane. That leaves open why they affect diverse fungi, but not all, and why they seem to have little effect on other organisms.
Why did they name these new broad-spectrum anti-fungal agents after Keanu Reeves? I'll let you discover that for yourself. It is the last sentence of the Introduction in the article. (It is also noted in the news story, but better to get the story from the scientific article.)
News story: Keanu Reeves, the molecule: New active ingredient from bacteria could protect plants. (Phys.org (Ronja Münch, Leibniz Institute for Natural Product Research and Infection Biology), February 6, 2023.)
The article, which is open access: Ecological Niche-Inspired Genome Mining Leads to the Discovery of Crop-Protecting Nonribosomal Lipopeptides Featuring a Transient Amino Acid Building Block. (Sebastian Götze et al, Journal of the American Chemical Society 145:2342, February 1, 2023.)
Posts about fungicides include:
* What do we learn from the sulfur isotopes in the California vineyards? (June 28, 2022).
* Largest field trials yet... Neonicotinoid pesticides may harm bees -- except in Germany; role of fungicide (August 20, 2017).
A perennial rice
March 4, 2023
Rice is an "annual" crop; it must be planted anew for each season. Scientists have now developed a perennial rice, which will re-grow after harvest. Trials of the perennial rice are reported in a new article.
The following figure shows the harvests from traditional annual rice and the new perennial rice over a five year period...
|
The harvests are shown in Mg/ha (megagrams per hectare). The x-axis time scale shows two harvests per year; F and S refer to first and second harvest of the year. (The second season is cooler, and gives lower yields.) Each point is for one test site.
Big picture...
- For the perennial rice (red), yields are similar over most of the time shown. There was only a single planting for each site, with twice-yearly harvest.
- Yields are mostly similar for the perennial rice and annual rice.
|
Some caution is needed in making those statements based on that graph. However, they both seem reasonable after checking the more complete data shown in the article. Extended Data Figure 4 shows the results by site, which makes things clearer.
The authors suggest that the PR strain tested here is good for four years, with eight harvests.
This is Figure 2d from the article.
|
If the yields are about the same, what is the point of using perennial rice? Planting is expensive. Using perennial rice would be simpler and cheaper than having to plant for each crop.
The following figure shows some of the economic analysis offered in the article...
The left-hand graph is for labor costs. Each pair of bars compares the costs for annual rice (AR) and perennial rice (PR). The pair of bars at the left is for the initial planting; the pair of bars at the right is for additional seasons. These pairs are labeled, rather awkwardly, as "transplanting" and "regrowth".
The costs for an initial planting are the same for both cases. But for additional seasons, labor costs are much lower for PR. Check the key for the color coding, and you will see that is because there is no cost for growing the seedlings, plowing the soil, and transplanting the seedlings. That is all logical; the figure puts some numbers on the labor costs that are saved by not having to go through the planting process. (There is a slightly increased "crop management" cost for the PR.)
The right-hand graph is the same idea, now for non-labor costs. Additional seasons for PR have reduced costs. An obvious contributor is not needing a new batch of seeds. There is also somewhat reduced fertilizer costs for the PR, which is already partially grown.
Overall... Both labor and non-labor costs are reduced with PR.
The costs are per hectare. Extended Data Figure 7 shows costs by site, and is labeled $/ha.
This is part of Figure 3a from the article.
|
From the two figures above, we see that the new perennial rice gives a similar crop yield, but with reduced costs. The article also notes improvements in soil quality associated with the perennial rice.
How did the scientists get this PR? Traditional plant breeding, crossing strains of rice with different properties. Rice strains vary in how well they re-grow. Commonly used crop strains re-grow some, but poorly. That is, at least some of the properties needed for regrowth are present. (It is thought that perennial is the original trait for rice.) A common crop strain was crossed with a poor-yield strain with good regrowth. Over multiple generations, the scientists got strains with good yields and good regrowth.
The strain tested above has now been grown for multiple seasons in various countries in Asia and Africa, with encouraging results. It is available commercially in some countries. (Further breeding work has given a couple of strains better than the one tested above.)
News stories:
* Productivity and agronomic potential of perennial rice. (Mary Williams, Plantae (American Society of Plant Biologists ), November 18, 2022.)
* Farmers in China, Uganda move to high-yielding, cost-saving perennial rice. (Lauren Quinn, University of Illinois, November 7, 2022.)
* News story accompanying the article: Perennial cropping: Newer roots for agriculture -- Annual grains, domesticated from wild species, have dominated agriculture since the Neolithic. A new study reports how turning to high-yield perennial rice crops could maintain key ecosystem functions while supporting livelihoods. (Jerry Glover, Nature Sustainability 6:5, January 2023.)
* The article (open access): Sustained productivity and agronomic potential of perennial rice. (Shilai Zhang et al, Nature Sustainability 6:28, January 2023.)
Among posts about rice...
* Wheat, rice, and Starbucks (August 3, 2018).
* How rice leads to global warming, and what we might do about it (September 2, 2015).
* How rice recognizes a Xoo infection (August 28, 2015).
* DEEPER ROOTING leads to deeper rooting -- and to drought tolerance (August 16, 2013).
* Golden rice as a source of vitamin A: a clinical trial and a controversy (November 2, 2012).
* The rice-arsenic issue: Consumer Reports and the FDA weigh in (September 25, 2012).
March 1, 2023
Briefly noted... The mosquito microbiome - inside and out
February 28, 2023
We know that mosquitoes transmit disease by injecting material into the blood. We also know that flies transmit disease simply by carrying microbes on their feet. Do mosquitoes do that, too? Do they carry pathogens on their surfaces? A new article offers a first step in exploring the matter. The scientists isolated bacteria from both the surface and internal parts of Anopheles mosquitoes found in various houses. There are no clear implications, but there are some interesting findings. One finding of possible concern is that Rickettsia were found in the mosquitoes; some Rickettsia are human pathogens. The scientists also found that the surface bacteria varied a lot from house to house, whereas the internal ones were more characteristic of the species and its outside environment. Not a surprising finding, but showing it is a step toward understanding the mosquito microbiome.
* News story: Study Examines Bacteria Living In and On Mosquitoes. (Mick Kulikowski, North Carolina State University, December 16, 2022.)
* The article, which is open access: Internal and external microbiota of home-caught Anopheles coluzzii (Diptera: Culicidae) from Côte d'Ivoire, Africa: Mosquitoes are filthy. (Kaiying Chen et al, PLoS ONE 17:e0278912, December 15, 2022.) As so often, browsing the Introduction may be good.
* Previous post about a microbiome: A drug to treat the gut microbiome (February 25, 2023). Three days ago.
* More mosquitoes: Oldest mosquito fossils: bloodsucking males (March 20, 2024).
* This item is listed on my BITN-Other topics page under Malaria. Anopheles mosquitoes transmit malaria; this section also includes some general items about mosquitoes. In fact, the page contains much about mosquitoes in various sections. Just search the page for mosquito.
Electric insects
February 27, 2023
The following figure shows the electric field in the air as a swarm of bees flies by...
|
The black curve shows the electric field (left-hand y-axis) vs time (x-axis).
The green curve is a measure of the bee density (right-hand y-axis; the figure legend says "pixel density", from photos of the scene).
You can see that the electric field closely follows the bee density.
|
The inset shows two electric field profiles over time. One is at a place where a swarm of bees went by; the other had no bees.
Part F of the full figure shows a similar graph for another bee-swarm event, with potential gradients ten-fold higher.
This is Figure 1C from the article.
|
The next figure provides some context, comparing the electric fields from swarming insects to those from other atmospheric phenomena...
The top two bars are for swarms of bees and locusts.
The bottom two bars are for thunderstorm clouds and electrified dust storms.
You can see that those two insect sources and those two non-biological sources give substantial electrical effects. In this analysis, the bees give the extreme range of values.
The middle two bars are for some insects that usually do not swarm at high density and fair-weather air.
|
|
The atmospheric electricity is shown here as charge density.
The values shown here for the insects are based on modeling, using the known charge per individual for each type of insect and estimated swarm densities. For the bees, the measurements and modeling have been shown to agree well. (For locusts, the measured charge per individual is about 800 picocoulombs.)
This is Figure 2C from the article.
|
The authors say this is the first article on how insects make a substantial contribution to atmospheric electricity. It is likely that insects can change the atmosphere enough to affect aggregation of dust, and thus its transport over long distances.
News stories:
* Insects affect electric fields in the atmosphere, researchers find. (University of Bristol, October 24, 2022.)
* Insects Can Produce As Much Atmospheric Electric Charge as a Thunderstorm Cloud. (SciTechDaily (Cell Press), October 26, 2022.)
* Insect swarms might electrify the air as much as storm clouds do -- The role insects play in creating electricity in the atmosphere may be unappreciated. (Darren Incorvaia, Science News Explores, November 22, 2022.)
The article, which is open access: Observed electric charge of insect swarms and their contribution to atmospheric electricity. (Ellard R Hunting et al, iScience 25:105241, November 18, 2022.) A short readable article. If you haven't thought much about electricity in the calm atmosphere, you might browse the Introduction here.
More about insects and electricity...
* How bumblebees detect the electric field (October 22, 2016).
* Bees and flowers: A 30-volt story (June 21, 2013).
A drug to treat the gut microbiome
February 25, 2023
Recurrent infection with Clostridioides difficile ("C diff") can be a serious problem. Underlying C diff infection is often a disruption of the normal gut microbiome. Restoration of the microbiome can be useful; fecal transplantation has shown some success in treating C diff. See background posts [links at the end]. (Prior to 2016, the organism was classified in the genus Clostridium.)
An alternative to fecal transplantation might be to inoculate with a known microbial mixture. In fact, the drug SER-109 is just that, and it is in clinical trial as a treatment for recurrent C diff infection.
A new article reports one part of the analysis, focusing not on the infection per se, but on measures of quality of life (QOL). In this trial, the C diff was treated with antibiotics, then the drug (or placebo) was given for three days. The drug provided microbes, intended to restore a healthy microbiome.
Here is a summary of some of the QOL analysis...
There is a lot there, so we'll look at it various ways.
Quick overview... There are many pairs of bars. In each pair, the left-hand (darker) bar is for those given the microbial drug; the right-hand (lighter) bar is for those given a placebo. In every case, the dark bar is higher; that is, by every measure, the treatment gave a better result than the placebo.
That is really the main point. If you want to skip the details, it is fine to skip down to below this figure caption.
But if you want some detail...
Patients were given an antibiotic to reduce their C diff. The antibiotic treatment was current standard care. Patients were then given the new microbial drug (or placebo) for three days. Results are shown above for week 1 (part A, top) and week 8 (part B, bottom).
There are eight pairs of bars in each graph, for eight scores.
Those are not eight independent scores. The first bar (left) is for the "total" score. You can use that first bar as an overall indicator, but there are many specifics if you want to explore. There are various physical, mental, and social scores -- all part of "quality of life".
All the individual bars show positive scores. That is, each score showed improvement (compared to baseline score, prior to the treatment), in both treatment and placebo groups. The p value on individual bars tests whether that bar is significantly above zero. All bars in the treatment group test as highly significant (p < 0.001). The p values for the placebo group vary, but most are significant at the < 0.05 level, especially at eight weeks.
There is also a p value over each pair of bars. That tests whether the treatment value is significantly higher than the placebo value. For the first four bars in each graph, that is true; this includes the total score. For the other four bars, the difference does not test as significant.
This is Figure 1 from the article.
|
The trial also recorded whether patients had recurrent infections; that part of the trial had been reported previously. In the current analysis, it was found that QOL improvements in the placebo group correlated with not getting recurrent C diff infection. However, in the treatment group, QOL improvements were seen both with and without recurrent infections. That is a particularly good result; improving the gut microbiome benefits the QOL even if it does not eliminate the pathogen.
The big picture is that the new microbe-drug leads to improvement in quality of life for people with C diff. That is encouraging. Benefit is seen even if the infection recurs. A three-day treatment leads to a QOL improvement at least through eight weeks.
News stories:
* Microbiome drug for recurrent C diff linked to improved quality of life. (Chris Dall, CIDRAP, February 2, 2023.) First item on the page.
* Microbiome therapeutic linked to quality of life improvement in patients with recurrent C. diff infection. (News-Medical.net (University of Houston), February 1, 2023.)
The article, which is open access: Assessment of Quality of LifeAmong Patients With Recurrent Clostridioides difficile Infection Treated with Investigational Oral Microbiome Therapeutic SER-109 Secondary Analysis of a Randomized Clinical Trial. (Kevin W Garey et al, JAMA Network Open 6:e2253570, January 30, 2023.)
Background posts about treatment of C diff include...
* Fecal transplantation as a treatment for Clostridium difficile: progress towards a biochemical explanation (February 8, 2015).
* A bacterial cocktail to fight Clostridium difficile (January 19, 2013). In mice.
Next microbiome post: Briefly noted... The mosquito microbiome - inside and out (February 28, 2023).
February 22, 2023
Briefly noted... Now, 92 for Jupiter
February 22, 2023
Scientists have now recognized 12 more moons for Jupiter. The score, for the moment, is Jupiter 92, Saturn 83.
* News story: Astronomers Find a Dozen More Moons for Jupiter. (Jeff Hecht, Sky & Telescope (American Astronomical Society), January 31, 2023.) Includes nice figures showing the orbits of the known Jupiter moons; not up-to-date, but still useful. There is no scientific paper yet.
* Background post: Briefly noted... -- Item 2. How many moons hath Jupiter? (August 1, 2018).
* and then ... Briefly noted... Saturn retakes the lead (June 16, 2023).
Emissions from gas stoves, even when 'off' -- air pollution implications
February 21, 2023
A new article reports that gas stoves (the kind used for cooking in ordinary homes) can make a significant contribution to air pollution -- when they are off.
Caution... This is an interesting story, but also complicated. There is now a movement to phase out gas appliances, and this article has become part of the argument. As usual here, this is a single article; be careful about reaching big conclusions from it.
Previous work has shown that gas stoves (and such) leak even when off. The current work builds on that.
The first figure shows the top 10 pollutants found in the unburned gas from gas stoves...
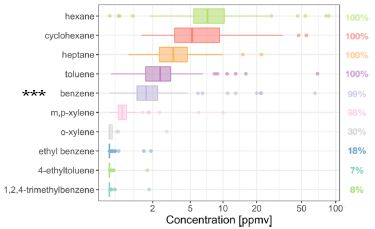
|
The numbers along the right side are the percent of samples with each pollutant. These numbers were used to choose the top 10, and to rank them in this figure. (The numbers are hard to read. Briefly, the top six were found in at least 98% of the samples. The bottom four were found in 7-30% of the samples.)
The x-axis shows the concentration found (in ppmv, parts per million by volume). Most of the scale is logarithmic; the authors note that it "smoothly transitions" to linear at the low end.
|
There is a general trend that pollutants found in more samples (right-hand number) were found at higher levels (x-axis).
The first three pollutants listed are saturated hydrocarbons (name ends in -ane). The others are aromatic hydrocarbons (benzene and derivatives; name ends in -ene).
I have marked benzene with *** at the left to highlight it. Benzene gets special attention in the article because it is a known carcinogen.
This is Figure 2 from the article. I added *** to the left of 'benzene'.
|
The next figure shows the results for benzene by geographical region (all within California)...
The striking result is that the benzene level varies by location -- a lot. The last two bars make the point clearly.
The three colors are for the three major gas companies in the state. (We don't need to identify them here, but they are well known locally -- and are named in the article.) It's interesting that the three red sets show major differences in benzene levels in three areas served by the same company.
NSFV/SCV stands for North San Fernando Valley and Santa Clarita Valley. The authors split off this geographical area from the adjacent "Greater Los Angeles" when they realized it was giving a distinct result. SF = San Francisco.
This is Figure 3C from the article.
|
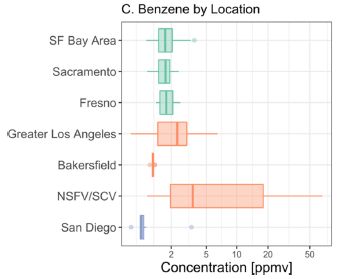
|
The next figure presents modeling results to explore the possible importance of the benzene in unburned natural gas entering homes. This uses the benzene levels measured in the gas, as reported in the figures above, along with estimates of leakage rates, from previous work.
Start with part B (bottom). The graph shows the expected benzene level in the kitchen for five types of homes for each of the geographical areas of the previous figure. (The five types of homes are listed at the bottom; not particularly important, at least to get started.)
There are two benzene emission levels tested in the modeling. We can call them high (red points) and average (blue). Those are the high and average levels for each geographical region.
There are two vertical dashed lines, for reference. One, at 0.94 ppbv, is an established limit for 8-hour exposure to benzene. The other, at 0.17 ppbv, is the estimated background level of benzene in outdoor air. (Note the b = billion for this graph.)
Big picture... There are a few points beyond the 8-h exposure limit. These are for the high-benzene case from areas with the highest benzene emissions. The average-benzene case gives values near background exposure.
Graph B (bottom) is for natural ventilation. Graph A (top) does the same analysis but assuming "proper" air conditioning. This significantly lowers the levels for the high-benzene case, but implementing such ventilation would be an expensive step.
This is Figure 4 from the article.
|
A brief summary of the key points...
- Gas stoves, when off, emit various hydrocarbons. Of particular interest is benzene, a known carcinogen.
- Emissions vary by location -- a lot.
- The higher levels of emissions are high enough to be of concern.
The work raises several questions. For example...
- Why are there emissions when the stoves are off? (Could we do something about it?)
- Why is there such geographical variation in the emissions? (Could we do something about it?)
- Are the concerns that seem to be raised by the third graph proper? (How much are people really exposed?)
I don't have answers for those questions, but it should be understood that the article offers some observations, and is not the last word. The authors note limitations of the work in their own final section (see "Future Research Directions", p 8 of the pdf) .
The big message of the work is that leakage of unburned gas can make a significant contribution to air pollution, and is a source not usually considered. It should be considered.
News stories:
* Gas stoves can spew lots of pollution, even when they're turned off -- Some shed high levels of cancer-causing benzene into a home's air, a new study shows. (Laura Allen, Science News Explores, January 30, 2023.)
* Leaks from gas stoves can create potentially hazardous indoor benzene concentrations -- Scientists find natural gas throughout California contains numerous hazardous air pollutants that can impact air quality and public health. (EurekAlert! (PSE Healthy Energy), October 20, 2022.) This is based on a press release from the main organization doing the work.
The article, which is open access: Composition, Emissions, and Air Quality Impacts of Hazardous Air Pollutants in Unburned Natural Gas from Residential Stoves in California. (Eric D Lebel et al, Environmental Science & Technology 56:15828, November 15, 2022.) The article is from an organization doing energy-related research. Interestingly, the article does not declare any conflict of interest, although the organization clearly benefits from such an article.
A previous post about natural gas leakage: Methane leaks -- relevance to use of natural gas as a fuel (April 7, 2014). This is a general discussion of methane leakage; the post also links to some posts about specific leak issues.
Among those leak posts: Los Angeles leaked -- big time! (April 29, 2016). This is actually from the area identified in the current work as San Fernando Valley. The Aliso Canyon site of this earlier event is mentioned in the current article. It is not obvious that there should be any connection between this leak event and the current work.
A second Asgard in culture, with an actin-based cytoskeleton
February 19, 2023
Here are some samples, from a new article...
Cells of the new Asgard, provisionally called Candidatus Lokiarchaeum ossiferum.
SEM (scanning electron microscopy) images.
Note the extensive "protrusions".
Scale bars are 500 nm. The spherical parts are small, compared to typical prokaryotic cells.
This is part of Figure 4 from the article.
|
They don't look much different from the first Asgard in culture; see the background post [link at the end]. In particular, the protrusions are a prominent feature in both cases -- the only two Asgard that have been directly observed. Perhaps they are characteristic of the group.
But this Asgard grows better than the earlier one reported: faster and to a higher cell density.
We also note that the scientists set out in this work to culture an Asgard; thus the article is also the first successful deliberate isolation of one.
Here is a thin section from a sample of the new Asgard...
Part e (left) shows the actual image. Part f (right) shows the interpretation, done by a computer analysis ("neural-network-aided 3D volume segmentations"; from the figure legend).
The orange lines at the right are filaments. The filaments are marked with orange arrowheads in part e. (If you want a clearer view of the filaments, I suggest you check the original pdf, and set the zoom to 200%, or even higher. Part c there is similar to part e.)
Scale bar (lower right of e) = 100 nm. (The inset is an overview, scale bar = 1 µm.)
It seems that the entire material in this image is bounded by one continuous membrane. It thus seems to be "one cell". Do the images in the top figure each show one cell? We'll leave that as an open question.
This is another part of Figure 4 from the article.
|
The filaments are made of actin -- a type of protein considered characteristic of eukaryotes. The genome codes for four kinds of actin. One of them now seems near-universal in the Asgard, and is called Lokiactin. The genome also codes for several proteins that interact with actin, suggesting a functional importance. The characterization of an actin-based cytoskeleton in a prokaryote suggests that this feature arose prior to the origin of eukaryotes. That is a new -- and important -- finding.
The new observations are consistent with the suggestion that Asgard archaea gave rise to eukaryotic cells. But remember, there is no direct evidence for such an event, or even that an Asgard can engulf a bacterium. It's an intriguing story, but still very incomplete. It will probably remain incomplete, but we will learn more and more about a fascinating group of microbes.
News stories:
* Study: Enigmatic Asgard Archaea Have Complex Cellular Architecture and Extensive Cytoskeleton. (Natali Anderson, Sci.News, December 22, 2022.)
* Shedding light on the origin of complex life forms -- Researchers at the University of Vienna and ETH Zurich cultivate "missing link" microorganism. (EurekAlert! (University of Vienna), December 21, 2022.) (Both institutions published the same news release.)
* News story accompanying the article: Microbiology: Asgard archaeal microbes reveal their inner secrets -- A microorganism that is a proposed relative of our cellular ancestors has been grown successfully in the laboratory. Its internal architecture offers clues to the early evolution of eukaryotic cells. (Jan Löwe, Nature 613:246, January 12, 2023.) Excellent overview of the work, with context.
* The article, which is open access: Actin cytoskeleton and complex cell architecture in an Asgard archaeon. (Thiago Rodrigues-Oliveira et al, Nature 613:332, January 12, 2023.)
Background post: An Asgard in culture (February 4, 2020). Links to more. The article of this earlier post is reference 7 of the current article.
A post about a model that is increasingly discussed: Origin of eukaryotic cells: a new hypothesis (February 24, 2015). The article of this earlier post is reference 28 of the current article.
More actin: The immune response of cnidarians (e.g., corals) (November 1, 2021).
Liquid-filled smart windows, inspired by squid
February 17, 2023
Smart windows are windows with properties that vary -- as needed. For example, in the mid-day sun, a smart window would let light in, but not heat. The idea of smart windows is not new; see the background post for an example [link at the end].
What's new in a recent article in how the smartness is implemented. In this case, one puts various liquids into the inside of the window -- liquids with various properties. Further, their smart windows have multiple independent liquid chambers, allowing for independent use of multiple liquids with different effects.
Here is an example of what can be achieved, as judged by a lab-scale test...
There is a small test-window. The top row of images was taken with visible light; the bottom row with infrared (IR), representing heat.
There is a time scale at the top. It simply times the experiment; the images are not at constant intervals.
Briefly, one layer of the window was filled with a particular liquid, during the first half of the figure. Then. that liquid was removed during the last part. There is one image between those two steps. (The liquid movements are summarized by the arrows at the bottom.)
The images with visible light all look the same. Good, that was the intent.
The images with IR change as liquid was added and removed. The key at the lower right translates the colors into temperatures. You can see that adding the liquid resulted in cooling, and removing it resulted in warming. That, too, is what was intended.
This is Figure 2D from the article.
|
It worked. Changing a liquid in the window provided control over the IR (heat) with minimal effect on visible light.
The authors argue that their type of smart window is better than others that have been proposed. The use of multiple liquid layers allows independent control of multiple factors, such as amount of visible and IR light, as well as directional control of the light. There is less use of exotic materials, so it is cheaper. They estimate a cost savings of nearly half, and that the device would pay for itself in two years (for a specific scenario, of coarse).
What about the squid, noted in the title? The authors say that their idea was inspired by the way squid change their properties, such as for camouflage, using multiple cell layers with different roles. They illustrate this in the figure at the right.
This is Figure 1B from the article.
|
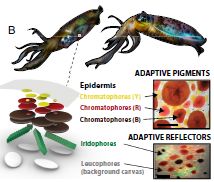
|
News stories:
* Squid-inspired smart windows could slash building energy use -- Liquid-filled panels that dynamically change how they let light through could cut the energy costs of heating, cooling, and lighting buildings by over 40%. (Prachi Patel, Anthropocene, February 2, 2023.)
* 'Liquid windows' inspired by squid skin could help buildings react to changing environments, save on energy costs -- University of Toronto Engineering researchers create bio-inspired system that can optimize the wavelength, intensity and dispersion of light reaching building interiors. (EurekAlert! (University of Toronto), February 1, 2023.)
The article, which is open access: Multilayered optofluidics for sustainable buildings. (Raphael Kay et al, PNAS 120:e2210351120, January 30, 2023.)
Background post: Windows: independent control of light and heat transmission (February 3, 2014).
Among posts about squid: A new brain study (March 3, 2020).
February 15, 2023
Briefly noted... Progress toward a universal mRNA-based flu vaccine
February 15, 2023
An mRNA vaccine candidate has been developed against all 20 known H-types of influenza virus. (H refers to the hemagglutinin subtype, as in the common designation such as H3N2.) A new article reports that animal tests of the vaccine were promising. Human tests are needed. It is hoped that the wide range of targets used here will result in significant protection against new strains that may emerge.
* News stories:
- mRNA Vaccine Provides Broad Protection against All Known Influenza Subtypes. (GEN, November 29, 2022.)
- Expert reaction to study of a multivalent mRNA vaccine candidate as a prototype for a universal flu vaccine. (Science Media Centre, November 24, 2022.)
* News story accompanying the article: Medicine: The influenza universe in an mRNA vaccine -- An mRNA-lipid nanoparticle vaccine protects animals from 20 influenza lineages. (Alyson A Kelvin & Darryl Falzarano, Science 378:827, November 25, 2022.)
* The article: A multivalent nucleoside-modified mRNA vaccine against all known influenza virus subtypes. (Claudia P Arevalo et al, Science 378:899, November 25, 2022.)
* Previous post about a "universal" flu vaccine: A universal flu vaccine: phase I trial (February 1, 2021). This and the current work represent different approaches. This earlier post attempts to develop a vaccine against highly conserved regions of the virus. The current work uses the usual vaccine targets, but more of them than usual. It is also the first to use the new mRNA vaccine technology.
* Posts on flu are listed on the supplementary page Musings: Influenza.
Atmospheric aerosols from passive (non-erupting) volcanoes -- a re-evaluation
February 13, 2023
A new article re-examines the question of how much gas volcanoes emit passively (that is, non-erupting). The results have implications for climate change models.
Sulfate aerosols are of particular interest here. They reduce warming. There are two main sources of sulfate aerosols: volcanic and biological.
It's a complex article -- and a complex, but interesting, story. Let's start with something simple -- the basic data...

Start with part b (bottom). The main data set shows the fraction of sulfate in an ice core from Greenland that is volcanic (volcanic sulfur fraction, fvolc; y-axis) vs time (x-axis), over several hundred years of the "pre-industrial" era covered by this ice core. Although the data is quite wiggly, we can reasonably approximate it is as constant, at about 2/3.
There is an orange line below that, at about 1/3. That shows the value of this parameter that is commonly used in major climate change models.
That is, the value of fvolc measured here is about twice the commonly accepted value. That is the main experimental result reported here -- and it gets attention.
The graph is intended to reflect "passive" volcano emissions. Over long time scales, the non-eruptive emissions of sulfur are much more important than the eruptive emissions. Samples thought to have significant contributions from eruptions were excluded.
Part a (top) shows the values for each type of sulfate (volcanic, biological). The fraction shown in part b is simply based on these two lines. The values for each type are based on isotope measurements of the sulfur in the ice core; each source has a distinctive isotope signature.
This is Figure 2 from the article.
|
So, the fraction of sulfate aerosols due to volcanoes is, according to this new analysis, larger than had been thought. Twice as large.
Why? Now the problems begin. The volcanic fraction could be higher than expected because the volcanic emissions were higher than expected, or because the biogenic emissions were lower than expected. There is nothing in the analysis that distinguishes those explanations. (We assume that the ice core reflects both types equally, but we don't know the absolute levels of either.) The authors suggest that the former is more likely. If so, then the amounts of sulfate aerosols in the past was greater than we had thought.
That has implications for climate change modeling. If the aerosol emissions in the last millennium were not what we had thought, that changes the input data into the models. And of course, that changes the predictions from the models.
The authors' preferred interpretation is that climate may be less sensitive to aerosols than we had thought. It is a complex chain of arguments to get to that conclusion.
The article is actually quite interesting and well written. The authors describe the various issues of concern, and make the logical connections. The difficulty is the uncertainties that underlie such work. If you find the topic of interest, I certainly encourage you to read the article. But a caution... Don't try too hard to reach a conclusion from it. The article offers significant new ideas; they need to be followed up.
News story: Ice cores show even dormant volcanoes leak abundant sulfur into the atmosphere. (Science Daily (Hannah Hickey, University of Washington), February 5, 2023.)
The article, which is open access: Underestimated Passive Volcanic Sulfur Degassing Implies Overestimated Anthropogenic Aerosol Forcing. (U A Jongebloed et al, Geophysical Research Letters 50:e2022GL102061, January 16, 2023.)
Among posts about aerosols: Aerosols and clouds and cooling? (August 27, 2017). This one is about the emissions during a volcanic eruption.
The biological source of sulfate aerosols is dimethyl sulfide (DMS). Here is a post about the complexity of what happens to that chemical: The importance of HPMTF in the atmosphere (June 9, 2020).
Making better straws
February 11, 2023
Plastic drinking straws work well. They are not affected by common drinks. They are strong enough that one can stab a potato with them. However, they are not biodegradable. Even plastic straws labeled as biodegradable, made with poly(lactic acid), degrade poorly. Paper straws are biodegradable, but work poorly. For example, they tend to get soggy.
Plastic-coated paper straws offer an approach that could combine the advantages of the two materials. The basic idea is that it is mostly paper, with enough plastic coating to gain the benefits of plastic without the downside. However, currently available plastic-paper straws have deficiencies.
A new article reports an improvement. The focus is on improving the plastic coating, in particular how it is attached to the paper, to provide a uniform effective layer.
The following two figures show some results comparing the new straws with other straws. We'll discuss the details of the straws, and the labeling, later.
Part d (left) shows a fizz test. A poorly coated straw in a carbonated soft drink gives fizzing (top). This is commonly seen with paper straws. The new straw does not (bottom).
Part e shows a strength test. A weight is applied to one end of a wet straw. The straw at the top, poorly coated, bends. The new straw does not, even with twice the weight (bottom). (Left and right sides are for zero and 60 seconds, respectively.)
From the strength test, one might predict that the new straw could be used to stab and pick up a potato. The results of such a potato-stabbing test are shown in part f. (Read the figure clockwise, from upper left.)
This is part of Figure 5 from the article.
|
The next figure shows results for a test of biodegradability...
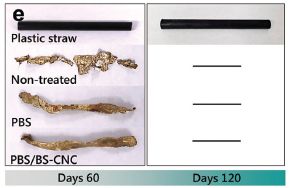
|
Straws were put into an ocean environment. The top straw is an ordinary plastic straw. The others are paper straws, with variations. The top one is unmodified -- basically a paper straw; the bottom is the new straw.
Images are shown after 60 and 120 days of incubation. If the straw was gone, a small black bar is shown.
|
The plastic straw remained unchanged. The three paper-based straws were visibly degraded by 60 days, and gone by 120 days. The plastic coating slowed the degradation (as judged by visual inspection at day 60), but overall degradation is good.
Comment... What happened to the plastic part of the straw? That is not addressed. It is possible that tiny pieces of "microplastic" remain. However, the plastic here is polyester, in short chains. It would not be surprising if the plastic part of these straws was reasonably biodegraded. In fact, it is stated that the plastic used here is biodegradable. However, that is not directly addressed in this article.
This is Figure 6e from the article.
|
What are these straws? They start as ordinary paper straws. Cellulose nanocrystals (CNC) are added to the surface. CNC is chemically like the paper itself, but the surface particles promote additional modification. A plastic coating is attached to the CNC, via a special linker. The linker is butylene succinate (BS); the coating per se is PBS = poly(butylene succinate). The final product is referred to as PBS/BS-CNC. The BS linker seems to be key to getting a good uniform, but very light, plastic coating onto the paper.
Overall, the article offers an improved straw, combining favorable proprieties of both paper and plastic. The authors note it is easy to manufacture, but do not address costs.
News stories:
* Finally, an anti-fizzing paper straw that doesn't get soggy. (Bradley van Paridon, Advanced Science News, November 21, 2022.)
* Development of 100% biodegradable paper straws that do not become soggy. (EurekAlert! (National Research Council of Science & Technology), February 1, 2023.)
The article, which is open access: Biodegradable, Water-Resistant, Anti-Fizzing, Polyester Nanocellulose Composite Paper Straws. (Hojung Kwak et al, Advanced Science 10:2205554, January 4, 2023.)
Many posts about plastics are listed with History of plastic -- by the numbers (October 23, 2017).
The only previous post mentioning a drinking straw: Brain-computer interface: Paralyzed patients control robotic arm by their thoughts (June 16, 2012).
February 8, 2023
Briefly noted... Recorded live, on Mars
February 8, 2023
* Listen. (26 seconds. Be patient.)
* Source/news story: NASA's Perseverance Records a Martian Dust Devil. (NASA, December 13, 2022.) The audio link above is from this page. A video link is also available; good to read this page before trying to make sense of the video.
* The article, which is open access: The sound of a Martian dust devil. (N Murdoch et al, Nature Communications 13:7505, December 13, 2022.)
* More from Perseverance: MOXIE: Making oxygen gas on Mars (October 12, 2022).
Briefly noted... Toxoplasma and the social structure of wolves
February 7, 2023
It is often said that the parasite Toxoplasma gondii enhances risk-taking behavior. In a recent article, scientists studied a possible case in the wild: gray wolves in Yellowstone National Park. The basic findings were that the degree of infection of the wolves was higher in areas with more cougars (the cats that transmit the infection), and that infected wolves were more likely to disperse from their original area and more likely to become pack leaders. That is, it appears that the parasite has practical effects on the social structure of the wolf population, including effects that would seem to be beneficial. (Don't over-interpret. There is no claim that the parasite is "good". The parasite "is", and this article helps us understand its role in a natural situation. It is inappropriate to reach a judgment.)
* News stories:
- This parasite makes wolves more likely to become leaders -- Toxoplasma gondii infections have a dramatic impact on the social behavior of gray wolves. (Jake Buehler, Science News Explores, February 1, 2023.)
- Behind the Paper: Parasitic infection manipulates intermediate host behaviour in a social carnivore -- We studied the effects of Toxoplasma gondii on wolf behaviour in Yellowstone National Park, Wyoming, USA. We found that seropositive wolves were more likely to make high-risk decisions such as dispersing and becoming a pack leader, both factors critical to individual fitness and wolf vital rates. (Connor Meyer, Nature Portfolio Ecology & Evolution Community, November 24, 2022. Now archived.) From the lead author of the article.
* The article, which is open access: Parasitic infection increases risk-taking in a social, intermediate host carnivore. (Connor J Meyer et al, Communications Biology 5:1180, November 24, 2022.)
* More Toxoplasma: Briefly noted... Does having a cat affect entrepreneurship? (February 13, 2019). Hm, is this related?
X-chromosome inactivation in males -- in cancer
February 6, 2023
In mammals, the females have two X chromosomes, whereas the males have only one. There is a dosage compensation mechanism, so that males and females in general make the same amount of products from X. In females, one X is inactivated. In cases of unusual chromosome counts, the "rule" is that all but one X is inactivated.
An RNA molecule called XIST plays a central role in inactivating excess X chromosomes.
A male would not normally have XIST RNA. So the following finding, from a recent article, is at least a curiosity...
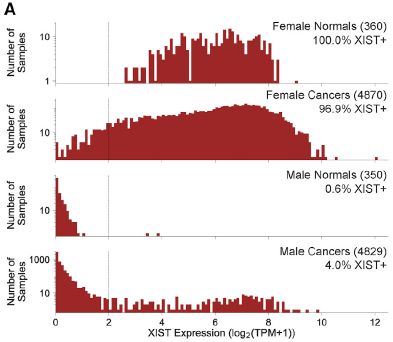
Each graph shows the amounts of XIST RNA found in a particular type of sample. The four graphs are for females and males, each normal and cancer samples. The x-axis is amount of XIST RNA (log scale); the y-axis is number of samples with that amount.
The vertical line near the left is used as a cutoff for a yes/no designation. The percent yes, by this cutoff, is shown at the upper right. (The reason for the specific cutoff value is not clear, but it doesn't matter much.)
The top two graphs are for females. The distributions are about the same, normal and cancer samples. Most females make XIST RNA. There is loss of X-inactivation in some female cancers; we won't discuss this further. (Note that there are ten times more samples for the cancer part, which contributes to the distribution appearing wider.)
The bottom two graphs are for males. They have little XIST RNA, as expected. Only two of the normal male samples (0.6%) meet the cutoff. However, there is a substantial high tail on the distribution for cancer samples from males: about 4%. That is the key finding: a significant percentage of cancer samples from males have XIST RNA.
This is Figure 1A from the article.
|
What does this mean? Further analysis shows that the male cancer samples with XIST RNA have two X chromosomes. It is common to find aberrant chromosome counts in cancers -- a condition called aneuploid (not euploid = not having the "true" chromosome count). For male cancers to have two X chromosomes might, then, just be another example of aneuploidy in cancer; that leads to XIST by the usual X-inactivation rules. (Caution... The full data on this point are more complex than suggested here.)
The authors consider some other possibilities, even raising the question of whether treating XIST in some way might be useful. That's pretty much speculation at this point.
I think it is best to treat this article as a novel finding, the significance of which is open for now.
News stories. Caution: Some of the news headlines suggest that "the" X in male cancers is inactivated. No, the finding is that excess X copies may be inactivated. This seems to be mainly a headline problem, and is largely absent from the stories themselves.
* The Male X Chromosome Is Silenced in Some Cancer Types. (Technology Networks, November 9, 2022.)
* The X chromosome is silenced in some male cancers. (Science Daily (Cell Press), November 9, 2022.)
The article: Somatic XIST activation and features of X chromosome inactivation in male human cancers. (Ananthan Sadagopan et al, Cell Systems 13:932, November 16, 2022.)
More about X-inactivation and/or XIST:
* Added September 11, 2025.
The genetics of orange cats (September 11, 2025).
* Unequal allele expression (April 18, 2023).
* Briefly noted... X-chromosome inactivation -- more complex than it seems. (May 27, 2020).
* Down syndrome: Could we turn off the extra chromosome? (November 15, 2013).
My page for Biotechnology in the News (BITN) -- Other topics includes a section on Cancer. It includes a list of relevant Musings posts.
A gene for insomnia?
February 4, 2023
Are there genes that affect how one sleeps? Large genetic databases allow that question to be explored statistically. The basic idea is simply to look for correlations between characteristics and genome sequences. The characteristics in this case could include people's answers to questions about the quality or quantity of sleep. The approach is called GWAS: genome-wide association studies.
GWAS gives statistical associations, but doesn't say anything about what is going on. In fact, it doesn't even identify genes, but rather genetic regions.
GWAS analysis of the sleep question, using the genome databases of the UK Biobank and 23andMe, has pointed to numerous genetic regions as candidates for sleep genes.
The following graph shows one way to proceed, as reported in a recent article...
Several candidate genes were "knocked down", one by one -- in flies (Drosophila). The graph shows how much each of the resulting fly strains slept over a 24-hour period. Each point is for one strain, representing one gene being tested. The strains are listed along the x-axis in order by the size of effect: strains with less sleep at the left, and so forth.
The region within two standard deviations of the mean is shown in gray. You can see that there are a few points below the gray region (at the left), and a few points above the gray region (right). These have the largest apparent effects, and are the best candidates to study further.
This is slightly modified from Figure 2B of the article. I added an asterisk (at the right) to mark one point of interest (see below).
|
What does it mean to "knock down" a gene? Here, the scientists used RNAi = interfering RNA. The RNAi binds to and blocks the mRNA for that gene; it thus reduces (knocks down) the function of the gene. In the current work, the knock-down was targeted to neurons.
One of the candidates from the graph above is PIG-Q, which I have marked with an asterisk at the right. The knock-down for this gene slept a lot, suggesting that the wild type gene inhibits sleep. The next figure shows a follow-up test for this gene.
The experiment here is like the first one, but focused on one candidate gene. The sleep measurement was made in 30-minute intervals.
The results show that the inhibition of PIG-Q (red data) increased sleep -- at all times during the day, lights on or off.
This is the left-hand graph of Figure 2C from the article.
|
This test confirms and extends the first test.
What does PIG-Q do? It is involved in anchoring proteins to membranes, using GPI (glycosylphosphatidylinositol). The story beyond that is largely open at this point.
The overall strategy of the work is to use GWAS to generate leads, then test the leads in simple lab animals. The experiments shown above are with fruit flies; the scientists also used zebrafish -- a vertebrate, closer to humans, but still simple enough for large scale lab work. Knock-down of PIG-Q in zebrafish also increased sleep. The set of findings suggests that PIG-Q is involved in sleep across diverse organisms. Further, the approach should be useful more broadly in studying leads from genetic association studies.
News stories:
* Scientists identified a new genetic pathway involved in insomnia -- A novel insight that could pave the way for new treatments for insomnia and other sleep-related disorders. (Pranjal Mehar, Tech Explorist, January 12, 2023.)
* Variant-to-gene mapping uncovers genetic link to sleep regulation. (Lyndsey Fletcher, Front Line Genomics, January 12, 2023.)
The article, which is open access: Variant-to-gene mapping followed by cross-species genetic screening identifies GPI-anchor biosynthesis as a regulator of sleep. (Justin Palermo et al, Science Advances 9:eabq0844, January 6, 2023.)
More GWAS: Ear lobe genetics: more complicated than you thought (March 23, 2018).
More insomnia: Association of mother's sleep disorders with premature birth? (October 13, 2017). It might be an interesting question whether any of the effects reported in this earlier work can be correlated with specific gene markers.
More sleep genes: Sleep genes and Alzheimer's disease? (May 28, 2022).
There is more about genomes on my page Biotechnology in the News (BITN) - DNA and the genome. It includes an extensive list of related Musings posts.
February 1, 2023
Briefly noted... A good role for "senescent cells"?
February 1, 2023
Senescent cells. Markers of aging. Bad guys. Let's eliminate them. Not so fast, according to a recent article, which offers evidence that some populations of "senescent cells" are involved in healing processes. For example, drugs designed to kill senescent cells inhibited tissue repair. The work should be thought of as leading to a refinement of our ideas about senescent cells.
* News story: Scientists Reappraise the Role of 'Zombie' Cells That Anti-aging Medicine Has Sought to Eliminate. (Neuroscience News (UCSF), October 16, 2022.) Excellent overview, for both context and the current work.
* The article: Sentinel p16INK4a+ cells in the basement membrane form a reparative niche in the lung. (Nabora S Reyes et al, Science 378:192, October 14, 2022.) Check Google Scholar for a freely available copy. (If the search by title fails, delete the plus sign in the title, and try again.)
* A useful background post: A treatment for senescence? (June 4, 2017). Links to more.
* The page for BITN -- Other topics includes a section on Aging.
Does E coli grow in a multicellular form?
January 31, 2023
Look...
An E coli biofilm. The region marked by the dashed rectangle is shown at higher magnification at the right. Note scale bars just above the images.
Pretty.
More importantly... Two batches of ordinary (wild type) E coli bacteria were grown up. Same kind of cells, grown up the same way. One batch was given a red stain and one a green stain. The two cultures were mixed, and the mixture allowed to form a biofilm under lab conditions.
One might expect, most simply, the biofilm to consist of a random mixture of red and green cells. It doesn't. It consists largely of red and green chains.
At the left, the main horizontal dashed lines mark the biofilm. The thickness is shown at one point.
This is Figure 3C from the article.
|
Why?
The authors investigated how the bacteria were growing. The general conclusion is that they grew into multicellular forms. The key structure consisted of four parallel chains of cells. These 4-chain structures then aligned to form the biofilm.
The first step is forming a "rosette" of four cells. Each rosette seems to form by four cells coming together. Once a rosette is formed, each cell divides in the usual way. The result is four parallel chains of cells, with each chain consisting of about 210 (~1000) cells. Those chains then come together to form the biofilm, as seen in the figure above. The scientists found genes needed for some steps.
The following figure shows multiple views of one rosette observed over a few minutes...
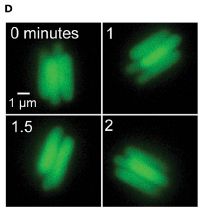
|
One rosette of four E coli cells.
This is Figure 1D from the article.
|
Intriguing observations. They go against our common idea that E coli simply divides in two, producing two separated and independent daughter cells.
There is more to be done to understand the generality and importance of what was found here. Among the questions... Does recognizing this process for developing biofilms lead to new approaches for preventing them?
News story: More to E. coli Than Meets the Eye: BME Lab Discovers Evidence of Multicellularity in Single Cell Organism. (Jerry Grillo, Georgia Tech, January 25, 2023.)
The article, which is open access: Evidence of a possible multicellular life cycle in Escherichia coli. (Devina Puri et al, iScience 26:105795, January 20, 2023.)
Posts on biofilms include...
* Better bacterial conductivity (November 3, 2020).
* Salmonella and food contamination; the biofilm problem (April 28, 2014).
Using abandoned mines to store energy
January 30, 2023
Here's the idea...
In part b (left), the device is charged. There is a pile of sand (orange) at the top (elevation about 0-80 meters).
If the sand falls down the shaft, by gravity, it can generate electricity.
Part c (right) shows the discharged state. The sand is at various storage locations deep underground.
When energy is plentiful, the sand can be transported back to the top, recharging the device.
UGES = Underground Gravity Energy Storage.
The apparent multi-floor structure? That is how mines are built.
This is part of Figure 5 from the article.
|
The underlying principle here is not new. We do things like this with water. Hydroelectric plants work by the same principle: water flowing downward, by gravity, turns a turbine and generates electricity. A variation of that is to intentionally pump water up to a storage tank, where it can be used to generate electricity later as needed. This is called pumped-storage hydroelectric. The energy cost of pumping the water is spent when energy is cheap; energy is generated when it is expensive. Such a system is about energy storage, not an energy source.
The device proposed here is the same idea, but uses sand rather than water. The authors make the case that abandoned mines could be used for this purpose.
The following table gives some cost estimates, comparing water and sand devices and lithium ion batteries...
There is no need to draw any general conclusion from the table at this point. What's important is that the sand process is in the ballpark. To be optimistic, it is the best for energy storage cost (where ordinary batteries really do poorly).
The numbers for the sand process are, of course, early estimates. And all the numbers have wide ranges; details matter.
This is Table 5 from the article.
|
An advantage of using abandoned mines is that they already have basic infrastructure, including connection to the power grid. And they have elevators or such to transport materials from the bottom of the mine to the surface.
Are there enough abandoned mines around to make this significant? The authors estimate that there are enough abandoned mines to, roughly, provide all the world's energy. But it would be developed one mine at a time.
The article opens the door to a new way to store energy: as sand in abandoned mines. The method should be thought of as a complement to other methods of energy storage, perhaps best suited for intermediate term storage (multi-day to months).
The article includes some interesting maps. For example, Figure 1 shows the distribution of (active) mines around the world, labeled by what they are for. This is not really needed for the current content, but does make the point that mines are widespread. Figure 10 shows the storage potential of mines by country; caution, red is good (high capacity) and green is bad on this map.
News stories:
* Scientists propose turning abandoned mines into gravity batteries. (Ben Coxworth, New Atlas, January 12, 2023.)
* Storing renewables via regenerative braking in underground mines -- Scientists in Austria have developed a long-term energy storage system that uses regenerative braking to adjust the descent speed of sand in mine shafts and generate electricity. (Emiliano Bellini, pv magazine International, January 24, 2023.)
* Turning abandoned mines into batteries. (Science Daily (International Institute for Applied Systems Analysis), January 12, 2023.)
The article, which is open access: Underground Gravity Energy Storage: A Solution for Long-Term Energy Storage. (Julian David Hunt et al, Energies 16:825, January 11, 2023.)
The following posts seem to be about energy in mines...
* How to light a cave (August 30, 2021).
* Bacteria that make atomic copper (May 8, 2021).
There is more about energy issues on my page Internet Resources for Organic and Biochemistry under Energy resources. It includes a list of some related Musings posts.
Virovory
January 28, 2023
The following figure, from a new article, includes growth curves for two types of ciliate protozoans on a particular food item...
Start with part C (lower left). The black lines show the growth of a species of Halteria; blue is for the control, without the food item.
Part D shows results for similar tests with another protozoan, a Paramecium.
You can see that the Halteria grew on this food, whereas the Paramecium did not.
The top row of graphs shows removal of virus from the solution. The Halteria removed much more virus. The Paramecium removed some.
The thin lines are for individual tests; the thick lines are for the average.
Virus is visible inside both types of cells; see the right side of the full Figure 1 in the article. Presumably virus is taken up by the usual feeding mechanism of the ciliates.
This is part of Figure 1 from the article.
|
What's the food? Virus particles. The Halteria are growing on the virus particles as their primary food source. (What else is in the growth medium is not clear from the article itself.)
Virovory.
It is not surprising that viruses can serve as food. After all, they contain much protein and nucleic acids, just as we do and all our food does. We presumably degrade viral debris, and use the resulting amino acids and such. But this article is a clear report of an organism that can use viruses as its main source of nutrients, at least under lab conditions.
In the big picture, it now seems that viruses can be not only predator, but also prey.
The virus used here grows on algae, not protozoans. That is, this is not about eating viruses as a defense, but simply as a food source.
News stories:
* First "virovore" discovered: An organism that eats viruses. (Michael Irving, New Atlas, December 28, 2022.)
* Eating viruses can power growth, reproduction of microorganism -- Study first to investigate, demonstrate effects of 'virovory'. (Scott Schrage, University of Nebraska-Lincoln, January 3, 2023.)
The article, which is open access: The consumption of viruses returns energy to food chains. (John P DeLong et al, PNAS 120:e2215000120, January 3, 2023.)
Previous posts about virovory: none.
Another ciliate with unusual metabolism... A purple-green protist, with an unusual set of endosymbionts (September 25, 2021).
I have listed this post on my page Internet resources: Biology - Miscellaneous under Nutrition; food and drug safety.
January 25, 2023
Briefly noted... A practical way to make tetrataenite -- and reduce the demand for rare earth elements
January 25, 2023
Permanent magnets made using rare earth elements, such as neodymium, are important in modern technology. However, there are supply issues with these materials. Perhaps we could use meteorite dust instead. In fact, a promising mineral has been found in meteorites. A new article reports a practical way to make it on Earth. The material is an alloy of iron and nickel. The problem is that the alloy can form two different structures, and the more useful one is hard to make. The key development in the new work is to make the desirable form, called tetrataenite. The key step is to include a few percent of phosphorus in the alloy; the P atoms enhance the mobility of the metal atoms as the melt cools, and a large fraction of it ends up in the desired form. The authors think the process can be improved further, and can be developed into a practical process for making high quality magnets using Earth-abundant materials. The findings may also prompt a re-think of how the mineral forms in meteorites.
* News story: A new way to create permanent magnets. (Andrey Feldman, Advanced Science News, November 17, 2022.) From the journal publisher.
* The article, which is open access: Direct Formation of Hard-Magnetic Tetrataenite in Bulk Alloy Castings. (Yurii P Ivanov et al, Advanced Science 10:2204315, January 4, 2023.)
* A recent post about rare earth elements: Extraction of rare-earth metals: a bacterial assist (February 8, 2022). Links to more.
* This post is listed on my page Introductory Chemistry Internet resources in the section Lanthanoids and actinoids.
Briefly noted... Yeast as a primary food in space?
January 24, 2023
Yeast is nutritious, easy to grow, and easy to modify, including by the modern tools of genetic engineering. Perhaps it could be the basis of all food in space. A recent article explores the possibility. In one sense, there is little that is new in it, but it brings a lot of things together. The article is labeled "Perspective". Fairly short, and quite readable.
* News story: Bioengineered yeast might feed astronauts exploring the depths of space -- Baker's yeast also has the potential to become astronomer's yeast. (Rupendra Brahambhatt, ZME Science, November 16, 2022.)
* The article, which is open access: Harnessing bioengineered microbes as a versatile platform for space nutrition. (Briardo Llorente et al, Nature Communications 13:6177, October 19, 2022.)
* More about food for space: Asteroids as a food source for astronauts (November 6, 2024).
* I have listed this post on my page Internet resources: Biology - Miscellaneous under Nutrition; food and drug safety.
A lightweight white paint
January 23, 2023
We have noted advances in white paint before [link at the end]. White paint is reflective, which is good for keeping cool.
A recent article offers a new development in white paint. The following figure summarizes the status of the field.
The figure shows the reflectance of various paint materials (y-axis) vs the thickness of the paint (x-axis).
Look at the left side of the graph, for thin coatings. There is a black dashed line near the top and a set of red points. Those are for the same material, a paint based on BN -- boron nitride. That paint is the focus of the current article.
The black dashed line is the prediction for the material, based on a simulation. The red points are real data for real paint (labeled "exp" for experimental).
The main point is that the real paint achieves about 98% reflectance at a 150 µm (0.15 mm) coating, in agreement with the prediction.
This is Figure 2C from the article.
|
This is not the first white paint to achieve 98% reflectance, but it does so at half the thickness of the previous material. Not only 1/2 the thickness, but about 1/5 the weight, because the new paint has a lot of air in it; it is nanoporous. That would be an advantage in applications where weight is an issue -- such as airplanes.
The material used here is the white pigment hexagonal boron nitride (hBN), which is already used commercially for other things (such as lubricants). Interestingly, the computer simulations suggested that a flake form, called nanoplatelets, would be more effective than spherical particles. That prediction was confirmed experimentally.
The graph above shows that the agreement between prediction and data is not good for thinner coatings. The disagreement probably relates to the form of the material, and is a caution that the understanding of the material is incomplete.
The new paint reflects much of the energy at wavelengths that allow it to escape the atmosphere. This issue of radiative cooling was discussed in the background post.
News stories:
* Purdue team develops thin-layer lightweight and ultrawhite paints for daytime radiative cooling. (Green Car Congress, October 4, 2022. Now archived.)
* World's whitest paint now thinner than ever, ideal for vehicles. (Jared Pike, Purdue University, October 3, 2022.)
* Lightweight hBN Nanoporous Paint with Excellent Cooling Abilities. (Hussain Ahmed, AZoNano, October 10, 2022.) Good discussion of several of the technical issues.
The article, which is open access: Thin layer lightweight and ultrawhite hexagonal boron nitride nanoporous paints for daytime radiative cooling. (Andrea Felicelli et al, Cell Reports Physical Science 3:101058, October 19, 2022.)
Background post: A better white paint, using BaSO4; it's cool (August 10, 2021). The article of this earlier post is reference 21 of the current article. It is also the article noted on the figure as Li et al 2021, for the BaSO4-based paint. The two articles are from the same lab.
More paint: Paint without pigment (May 4, 2023).
More boron nitride: Nanopore sequencing of DNA using synthetic membranes (May 15, 2021).
Other things white: The whitest feathers (March 11, 2023).
The Black Death: implications for the development of auto-immune diseases?
January 21, 2023
The Black Death (1346-1350) was a major pandemic of bubonic plague that killed 40% of the people in Europe (and nearby areas) in less than a decade.
A recent article offers evidence that the extreme death rate led to a significant change in the genetic make-up of the human population. Some people survived the Black Death because they had "better" genes -- in that context. The article identifies some of those genes, whose frequency changed significantly during that time. Interestingly, some of those genes may be not so good for us in "ordinary" times.
Here are some of the key data...
Each little graph is for one particular genetic mutation. The y-axis shows the frequency of that mutation (y-axis). The x-axis is a time scale; points are shown for certain distinct time periods. The first three points are for before, during and after the Black Death (BD). The right-hand point is for modern humans. There are two data sets. The red curve is for people from London; the blue curve, with less data, is for people from Denmark.
Look at part d (at the left). Both the red and blue curves suggest that the mutation increased in frequency between "Before BD" and "After BD". For the red curve, the latter value is similar to the modern value, suggesting no further change since then.
The general pattern also holds for parts e and f.
Part g (right) shows something similar, but reversed: the mutation declined during the BD.
The BD samples were from people buried in a plague cemetery in London during 1348 and 1349. The after-BD samples were from about 1350-1539 (London) or: 1350-1800 (Denmark).
This is part of Figure 2 from the article.
|
Simply collecting these data was quite an achievement. The scientists were able to access about 200 bodies with well-determined death dates. They sequenced the genomes, and looked for patterns. The results shown above are for some genes with the largest effects.
With candidate genes at hand, one can ask more questions. What are the genes? What can we say about the specific mutations? Are there any implications of these mutations for the modern population?
The mutations are in regions associated with immunity. That was a bias of the screening process; the scientists looked for mutations associated with genes for immunity. In one case, the scientists showed differences in the effects of the alleles. In particular, they showed that one mutation found here promoted resistance to infection with plague bacteria, Yersinia pestis, in a lab test.
The largest selection effect was for alleles associated with the ERAP2 gene. From the changes in allele frequencies, the scientists estimate that people homozygous for the protective allele were about 40% more likely to survive plague infection than those homozygous for the deleterious variant.
Beyond that, the authors note that two of the alleles they found to be protective against plague have been associated with increased incidence of auto-immune diseases, such as Crohn's disease, rheumatoid arthritis, and lupus.
If we take all this at face value, realizing that some of the data is limited, it seems that the Black Death event changed the genetic nature of the human population, with one effect being to increase auto-immune diseases.
News stories:
* Black Death may have influenced evolution of genes involved in immune responses, study finds. (Brittany Trang, STAT, October 19, 2022.)
* Ancient DNA shows people with certain genes were more likely to survive the Black Death -- UChicago scientists find bubonic plague had effect on human genome. (Alison Caldwell, University of Chicago, October 27, 2022.)
* News story accompanying the article: Genetics: Rapid natural selection during the Black Death -- Human DNA from the Middle Ages reveals that natural selection occurred at pace in survivors of a bubonic plague pandemic, perhaps leaving their descendants at increased risk of autoimmune diseases. (David Enard, Nature 611:237, November 10, 2022.)
* The article: Evolution of immune genes is associated with the Black Death. (Jennifer Klunk et al, Nature 611:312, November 10, 2022.)
Another case of very rapid evolution under extreme pressure -- in an organism that grows much faster: The story of the peppered moth (July 9, 2012).
The only previous post that mentioned the plague: Bacteria found in rectum of old flea (October 16, 2015).
January 18, 2023
Briefly noted... Was a simpler larynx a key to the development of human speech?
January 18, 2023
Human speech is unique -- and complex, involving both the brain and the anatomy of the speech apparatus. A recent article offers a new idea about one aspect of how speech developed. An analysis of the anatomy of the larynx of over forty primate species suggests that the organ is actually simpler in humans. That simpler larynx allows smoother, more stable sound production. Arguably, the simpler human larynx was a key development allowing for speech. The article is quite complex; I suggest starting by browsing it for the big ideas.
* News story: Simplified voice box enriches human speech -- Anatomical simplifications allowed vocal complexity in human speech. (Science Daily (Kyoto University), August 11, 2022.)
* News story accompanying the article: Evolution: When less is more in the evolution of language -- Did loss of vocal fold membranes typical of nonhuman primates enable human speech? (Harold Gouzoules, Science 377:706, August 12, 2022.)
* The article: Evolutionary loss of complexity in human vocal anatomy as an adaptation for speech. (Takeshi Nishimura et al, Science 377:760, August 12, 2022.)
The role of tiny droplets in driving unfavorable reactions -- such as those needed to get life started
January 17, 2023
Much of the story of life chemistry is about the use of energy: how the energy from an external source is used to drive reactions which, on their own, are unfavorable. A special question is how all that got started in the early stages of establishing life systems.
One example of an important unfavorable reaction is the formation of a peptide bond between two amino acids. The reaction releases water, and is unfavorable in the presence of water. In modern biology, the reaction is done using the energy from ATP, in a fairly complex reaction sequence.
A recent article offers one way that unfavorable reaction might have occurred before energy pathways had been developed. The following figure shows some key evidence behind the idea...
|
The logic of the test is simple: a solution of the amino acid glycine is sprayed into a mass spectrometer (MS), and analyzed there.
A small amount of the dipeptide glycylglycine is found. Apparently, it formed in the droplets between the time the spray was created and the time the droplets entered the MS for analysis.
To test this idea further, they varied the distance the droplets traveled, hence the time available in the droplets. The results of that test are shown here: amount of the dipeptide formed (y-axis) vs distance (x-axis). At least for a portion of the curve, greater distance (longer time) gave more of the dipeptide.
This is part I of Figure 1 from the article.
|
The results support the idea that peptide bond formation is occurring in the spray.
How can that happen, if the reaction is unfavorable? The suggestion is that the reaction occurs at the surface of the droplets. What makes the simple reaction unfavorable is the presence of water. But molecules at the surface of the droplets are at an air-water interface. It is reasonable that the interface shifts the energetics, making the reaction more favorable.
Is there any relevance to prebiotic or early-life chemistry? That would be speculation, of course, but perhaps. Tiny droplets occur in nature; ocean spray is an example. The same basic effect would occur in simply drying-up of puddles or such; the droplets provide an extreme case of increasing the air-water interface, especially with tiny droplets.
In the news story, the authors also note that their procedure could be useful in the lab for synthetic chemists, to facilitate reactions that might otherwise be difficult.
News story: The fountain of life: Water droplets hold the secret ingredient for building life -- Chemists discover key to early Earth chemistry, which could unlock ways to speed up chemical synthesis for drug discovery. (EurekAlert! (Purdue University), October 3, 2022.)
* Commentary accompanying the article (actually, in a later issue): Peptide synthesis in aqueous microdroplets. (Veronica Vaida & Alexandra M Deal, PNAS 119:e2216015119, October 20, 2022.)
* The article: Aqueous microdroplets enable abiotic synthesis and chain extension of unique peptide isomers from free amino acids. (Dylan T Holden et al, PNAS 119:e2212642119, October 3, 2022.)
Another article making a similar point appeared recently...
* News story: Drying process could be key step in development of life. (Phys.org (Jason Daley, University of Wisconsin-Madison), December 21, 2022.)
* The article: Glycine to Oligoglycine via Sequential Trimetaphosphate Activation Steps in Drying Environments. (Hayley Boigenzahn & John Yin, Origins of Life and Evolution of Biospheres 52:249, December 2022.) The work in this article differs from that in the main article, above, in also including phosphates in the reaction mix. The role of surfaces remains central.
Another post about droplets affecting reaction rates: Spontaneous formation of hydrogen peroxide from water (October 26, 2019).
Another way to make peptides, though it is not suitable for use on Earth: Making peptides in space: a new pathway (April 15, 2022).
My page Internet Resources for Organic and Biochemistry has a section on Amino acids, proteins, genes. It includes a list of posts about making proteins.
The effect of climate change on rainbows
January 16, 2023
The following figure shows how the frequency of rainbows is expected to change due to climate change, as reported in a recent article...
Red is for areas that, according to the new work, are expected to experience more rainbows; blue is for areas that will experience fewer rainbows. Darker colors indicate larger effects; see the key. The plotted parameter is the number of days per year with at least one rainbow. The comparison is, approximately, for the year 2100 vs 2000.
You can see that there are major differences around the world. For example, the work predicts major increases in rainbows in the far-north.
Interestingly, the overall effect is small: about a 5% increase in rainbows globally. But there will be major shifts in the distribution of rainbows -- major changes in the rainbow-haves and rainbow-have-nots.
The small graph at the right summarizes the average of blue- and red-effects vs latitude.
The predictions are based on one specific high emissions climate change scenario, known as SSP5-8.5.
This is Figure 7 from the article.
|
At one level, this is a fun article. However, rainbows are physical phenomena, and the analysis here is serious physics. As an example of the complexity, clouds are needed to produce rain, but they can obscure the rainbow that follows. The work started by establishing the current distribution of rainbows, something that apparently had never been done. That distribution was then adjusted to 2100 based on the climate change model.
Among the simpler reasons for changing rainbow patterns... Areas where warming leads to more rain instead of snow are likely to get more rainbows. Areas that become drier will get fewer rainbows.
Over 2/3 of Earth's land area will get more rainbows. However, much of the increase will be at high latitudes and high elevations, where few people will see them.
News stories:
* Somewhere over the rainbow... climate impact is visible -- India, 5 African countries may see a lot more rainbow days due to increased precipitation, finds study. (Madhumita Paul, Down To Earth, November 3, 2022.)
* Climate change to produce more rainbows. (Marcie Grabowski, University of Hawaii at Manoa, October 28, 2022.)
The article, which is open access: Global rainbow distribution under current and future climates. (Kimberly M Carlson et al, Global Environmental Change 77:102604, November 2022.)
Previous posts about rainbows: none.
A recent post about climate change: What caused the extinction of the mammoths -- I (January 16, 2022).
SNO and the higher prevalence of Alzheimer's disease in women
January 14, 2023
Alzheimer's disease (AD) is more prevalent in women; it is not known why. A new article offers a clue.
It's about SNO. That's S-nitrosylation, the attachment of a nitrosyl group (-N=O) to the S atom of cysteine in proteins, using nitric oxide. In particular, it's about SNO of a protein called C3, which is part of the complement cascade in the innate immune system.
The following figure summarizes the key data...
|
The figure shows the amount of SNO in the C3 protein for four groups of people: males and females with and without AD.
The results for non-AD people are very low. The results for people with AD are higher -- especially for females.
The analyses were done on post-mortem brain samples. The results shown are for nitrosylation at one specific site in C3, Cys-720.
This is part of Figure 5A from the article.
|
Those results establish a correlation between SNO and AD, but alone do not say anything about why.
One can suggest connections. The modified protein is associated with inflammation in the brain, and that could promote destruction of synapses. That's an incomplete idea, of course, but it can be followed up. One test will be to intervene by promoting loss of the modification, and see if that has beneficial effects.
It is known that females have higher levels of SNO, a result that was verified in the current work. Also, estrogen is associated with lower levels of SNO, so the modification increases after menopause. (Comment... Does this suggest that hormone replacement might be relevant? That is not mentioned.)
News stories:
* Protein Modifications May Explain Why More Women Get Alzheimer's Disease. (Sarah Whelan, Technology Networks, December 14, 2022.)
* Discovery could explain why women are more likely to get Alzheimer's -- Scripps Research and MIT scientists find that a modified immune protein harming brain connections is much more common in the brains of women with Alzheimer's, compared to men. (EurekAlert! (Scripps Research Institute), December 14, 2022.)
The article, which is open access: Mechanistic insight into female predominance in Alzheimer's disease based on aberrant protein S-nitrosylation of C3. (Hongmei Yang et al, Science Advances 8:eade0764, December 14, 2022.)
Recent post on AD: Alzheimer's disease: a blood treatment? (January 9, 2023).
Another case of sex differences in disease susceptibility... Why some viruses may be less virulent in women (March 1, 2017).
Posts that mention nitric oxide:
* The miracle of Methylomirabilis (May 10, 2010).
* Garlic or rotten eggs? (February 8, 2010).
My page for Biotechnology in the News (BITN) -- Other topics has a section on Alzheimer's disease. It includes a list of related Musings posts.
January 11, 2023
Briefly noted... Making male and female stem cells from one person
January 11, 2023
What's the difference between cells of males and females? Well, one has one each X and Y chromosomes and the other has two X chromosomes, in addition to the usual complement of autosomes. But if we try to study male vs female cells, it's not so simple, because they come from different people, so have their genetic differences. A new article reports making both male and female stem cells from the same person. There is a trick -- and nature did the trick. The donor was a person with XXY sex chromosomes (Klinefelter syndrome). And the person was actually mosaic, with cells of various types. What the scientists did was to make induced pluripotent stem cells (iPSC) from the person; they got stem cells of various types, because the person had various cell types. This will allow studies comparing cell lines that are (nominally) identical except for the sex chromosomes.
* News stories:
- Male and Female Stem Cells Derived from One Donor in Scientific First -- Studying otherwise identical XY, XX, X0, and XXY pluripotent stem cells will allow researchers to investigate sex-based differences in greater depth. (Dan Robitzski, The Scientist, December 22, 2022. Now archived.)
- Hadassah Researchers Are First in World to Derive Male and Female Cells from the Same Person -- Breakthrough opens path to new discoveries in study of sex differences and development of gender medicine. (Hadassah, November 29, 2022.)
* The article, which is open access: Modeling sex differences in humans using isogenic induced pluripotent stem cells. (Ithai Waldhorn et al, Stem Cell Reports 17:2732, December 13, 2022.)
For more on stem cells:
* The choano-mouse: implications for understanding the origins of transcription factors that control stem cells (April 23, 2025).
* There is a BITN page for Cloning and stem cells. It includes lists of Musings posts.
Alzheimer's disease: a blood treatment?
January 9, 2023
A recent article explores the possibility of treating (or even preventing) Alzheimer's disease (AD) by a blood treatment. The work is in a mouse model of AD, and the method wouldn't be practical in humans. Nevertheless, the results are intriguing.
The mouse model uses transgenic mice, carrying a gene that leads to the production of the human amyloid beta peptides (such as Aβ-42). Those peptides form the characteristic AD plaques. The method is to replace the blood with fresh blood -- whole blood exchange.
The following two figures show some results for one treatment regime. The first figure shows the effect on amyloid plaques...
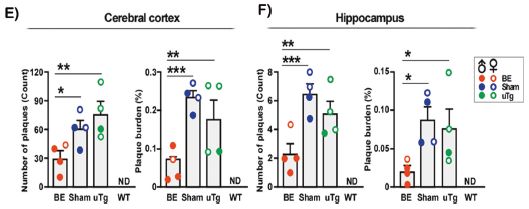
Various things are plotted in the individual graphs in the two figures here, but the x-axis layout is the same for all. The four bars are for two types of mice, with three conditions for one of them. The bar at the right, for each graph, is for wild type (WT) mice. The other three bars are for the transgenic (Tg) mice, which are known to develop an AD-like condition. One bar is labeled uTg, for untreated transgenic; this is the control for these animals. The left-hand bar is for the Tg mice given the blood exchange (BE) treatment. The other bar is for Tg mice given a sham treatment.
The first graph, at the left, is for the number of plaques found in a specific type of sample from the cerebral cortex. The main point is that the bar for the BE-treated animals is lower than for the untreated animals (uTg). That is, the treatment reduced formation of AD plaques. (The bar for the sham-treated animals is similar to the uTg bar. The bar for the WT animals shows nothing.)
The second graph shows the same results plotted in a different way. The two graphs at the right (Part F) show similar analyses for another brain tissue.
The basic pattern is the same in all four graphs: the BE treatment led to less AD plaque, compared to the Tg controls (sham-treated or untreated).
In this test, BE was done from age 3 months to 13 months, once a month; each exchange replaced about half of the mouse's blood with fresh blood. The analyses reported here were done at 13 months. (In the sham treatment, the mice were injected with the same blood that had just been removed.)
This is part of Figure 1 from the article.
|
The next figure shows the effect on performance in memory tests...
The two graphs are for two tests: short- and long-term memory. The y-axis is labeled latency; that is the time it takes the mice to perform the task. The layout of the graphs is the same as in the first figure.
The general picture is the same as above. Tg mice treated with BE showed improvements in test scores.
This is part of Figure 2 from the article.
|
Blood exchange seems to help. One can raise various questions, but the work here is an interesting lead.
It is much easier to treat blood than brain, so there is an incentive to explore this approach. The extensive blood exchange used here would not be practical in humans. However, hemodialysis and plasmapheresis are blood purification procedures currently used with people; they might be extended to this application. The article even notes that there is some data suggesting that these treatments may reduce blood amyloid levels.
The scientists do not know how this works. A simple model is that brain amyloid is in equilibrium with blood amyloid; having lower blood amyloid levels thus promotes removal of brain amyloid. That's logical, but is just an idea for now.
The direct effect of the blood exchange treatment is on the level of amyloid protein or plaque. The article offers some data suggesting there is an effect on memory. The relationship between amyloid level and memory effects has been subject to some controversy, but we won't address that here.
News stories:
* Whole blood exchange could offer disease-modifying therapy for Alzheimer's disease. (Science Daily (University of Texas Health Science Center at Houston), July 15, 2022.)
* Whole Blood Exchange Being Studied as a Potential Treatment for Alzheimer's Disease. (George Citroner, Healthline, July 19, 2022.) Now archived.
The article: Preventive and therapeutic reduction of amyloid deposition and behavioral impairments in a model of Alzheimer's disease by whole blood exchange. (Akihiko Urayama et al, Molecular Psychiatry 27:4285, October 27, 2022.)
Next post about AD... SNO and the higher prevalence of Alzheimer's disease in women (January 14, 2023).
More about mouse blood: Would young blood be good for your brain? (October 21, 2011). The article of this earlier post is reference 32 of the current article.
My page for Biotechnology in the News (BITN) -- Other topics has a section on Alzheimer's disease. It includes a list of related posts.
Using an enzyme to make quantum dots
January 6, 2023
Quantum dots are useful, but hard to make. A new article reports use of an enzyme to make cadmium sulfide (CdS) quantum dots in a simple and inexpensive way. The enzyme itself is an artificial enzyme, which had been developed for another purpose.
The following figure gives the idea...
Start with part B, at the right. It's simple: photos of the system over time. The colors that develop are due to the production of CdS quantum dots of increasing size. (The actual times here are not clear.)
Part A (left) shows some quantitative data: the absorption spectra at 24 hr, under various conditions.
The peak at 380 nm is for the quantum dots. That peak only develops in one case, with the complete system: Cd (as CdCl2), L-Cys (L-cysteine, source of S for S2- ions), PLP (a required factor), and ConK (Construct K, the enzyme). The other curves are for controls. Two of them lack one component; the third control uses a variant protein predicted to be inactive.
PLP = pyridoxal phosphate, the active form of vitamin B6. PLP and cysteine react spontaneously, without the enzyme, to give a chemical with absorbance at 340 nm; the only condition that doesn't give this peak is the one lacking PLP.
This is part of Figure 2 from the article.
|
What's going on here? One key issue is that the enzyme is releasing sulfide ion, S2-, from the cysteine, with PLP as a cofactor. This is related to the property originally found for the protein; it served to reduce the toxicity of metal ions to E coli bacteria, perhaps by leading to the precipitation of the metal sulfide. The current work is an application, where the sulfide is used to make CdS quantum dots -- in vitro.
The common stereoisomer of cysteine is L, used in the work described above. A test showed that the D isomer worked equally well.
The system seems to be reproducible, and to allow growth of the quantum dots at a consistent rate. That may be due to the production of sulfide at a controlled, and very slow, rate. (I must say that I wonder whether the protein is also providing a template for the growth of the quantum dots. There is no reason to invoke this, and the article does not mention it.)
The article is of interest at two levels. First, it is an example of an interesting artificial protein. Second, it may be useful in developing a novel process for making quantum dots.
News story: Chemists create quantum dots at room temp with lab-designed protein. (Wendy Plump, Princeton University, December 12, 2022.)
The article: A de novo protein catalyzes the synthesis of semiconductor quantum dots. (Leah C Spangler et al, PNAS 119:e2204050119, December 12, 2022.) The authors have filed for a patent on their process.
Another case of biology-mediated production of quantum dots: Unusual synthesis of cadmium telluride quantum dots (February 15, 2013). The article of this earlier post is reference 24 of the current article.
Do bees count left-to-right?
January 3, 2023
It's not news that bees do math. Musings has posted on bee-math before [link at the end]. But now... A recent article makes a fascinating claim: that bees order numbers left to right. It's an intriguing article -- whether you accept the authors' interpretation or not.
Let's start with some data, even before we look at the nature of the tests. The following table summarizes the key experiments.
The key data column is labeled "Count L/R". It shows how many bees went to the left or right. That result is then expressed as a fraction ("empirical proportion") in the next column. The fraction is always given as the fraction toward the favored side, whichever that is. That is, values significantly above 50% indicate a significant effect, but do not indicate the direction of the effect.
The first set of data is for control experiments. The results are near 50%, as expected if the response is random. For the first row, the bees were trained on One and tested on One; that gives a random response. In all three controls, the bees were trained and tested on the same number, and gave a random response.
All the other tests gave a fraction significantly different from random. But now the important point... Look through the rows and you will see that when the bees were tested on a smaller number than used for training, they went to the left. When tested on a bigger number than used for training, they went to the right. That direction effect is the key to the author's interpretation: small numbers to the left. Note that we have not yet discussed the actual nature of the experiments. But whatever it is, there appears to be a significant effect.
The bees here are common honey bees, Apis mellifera.
This is part of Table 1 from the article. (I have omitted columns of statistical analysis.)
|
The following figure gives an idea of the test...
The experiment chamber displayed various images to the bees. The important aspect of each image was the number of symbols on it. In the training phase (Part A, upper left), the bees were shown a single image, in the center, with some number of symbols. In the testing phase (Part B, right), the bees were shown two identical images, one on each side. The number of symbols on the testing images might be the same as the training image (controls), or different -- either more or less than the training number. The question was, which way did the bees go? That is what the data shown above is about.
Part C (bottom) shows examples of how the various numbers were displayed. (The style of the numbers didn't affect the results. This was tested in some of the experiments listed in Table 1, above.)
This is part of Figure 1 from the article.
|
It's intriguing. The test is well-defined, and the results seem significant. What's going on? The authors suggest that the bees have an innate number line, left to right. What alternative interpretations might there be -- and how might we tell them apart?
An earlier post was about a similar test with chickens [link at the end]. My comments there were similar.
If we can't figure out whether humans have an intrinsic preference for how to order the number line, perhaps it isn't surprising that we can't figure it out for other animals.
News stories:
* Bees can count, and they do so left to right - just like most of us -- These crafty little fellows are not bad at math. (Mihai Andrei, ZME Science, December 12, 2022.)
* Bees shown to 'count' from left to right for first time. (Pierre Celerier, Phys.org, October 30, 2022.)
The article, which is open access: An insect brain organizes numbers on a left-to-right mental number line. (Martin Giurfa et al, PNAS 119:e2203584119, October 17, 2022.)
Background post on bee-math... Zero? Do bees understand? (July 20, 2018). The article of this earlier post is reference 17 of the current article.
Background post on similar work in another animal... Small numbers to the left? Chickens may agree (February 17, 2015). The article of this earlier post is reference 5 of the current article.
There is more about math on my page Internet resources: Miscellaneous in the section Mathematics; statistics. It includes a listing of related Musings posts.
Top of page
The main page for current items is Musings.
The first archive page is Musings Archive.
E-mail announcements -- information and sign-up: e-mail announcements. The list is being used only occasionally.
Contact information
Site home page
Last update: July 13, 2026