Home
> Musings: Main
> Archive
> Archive for September - December 2015 (this page)
| Introduction
| e-mail announcements
| Contact
Musings: September - December 2015 (archive)
Musings is an informal newsletter mainly highlighting recent science. It is intended as both fun and instructive. Items are posted a few times each week. See the Introduction, listed below, for more information.
If you got here from a search engine... Do a simple text search of this page to find your topic. Searches for a single word (or root) are most likely to work.
Introduction (separate page).
This page:
2015 (September - December)
December 29
December 21
December 16
December 9
December 2
November 23
November 18
November 11
November 4
October 28
October 21
October 14
October 7
September 30
September 23
September 16
September 8
Also see the complete listing of Musings pages, immediately below.
All pages:
Most recent posts
2026
2025
2024
2023:
January-April
May-December
2022:
January-April
May-August
September-December
2021:
January-April
May-August
September-December
2020:
January-April
May-August
September-December
2019:
January-April
May-August
September-December
2018:
January-April
May-August
September-December
2017:
January-April
May-August
September-December
2016:
January-April
May-August
September-December
2015:
January-April
May-August
September-December: this page, see detail above
2014:
January-April
May-August
September-December
2013:
January-April
May-August
September-December
2012:
January-April
May-August
September-December
2011:
January-April
May-August
September-December
2010:
January-June
July-December
2009
2008
Links to external sites will open in a new window.
Archive items may be edited, to condense them a bit or to update links. Some links may require a subscription for full access, but I try to provide at least one useful open source for most items.
Please let me know of any broken links you find -- on my Musings pages or any of my regular web pages. Personal reports are often the first way I find out about such a problem.
December 29, 2015
Can pigeons diagnose cancer by reading patient X-rays?
December 29, 2015
About as well as professional radiologists can.
Or better. According to a new article.
Here is the idea... For training, a pigeon was shown a breast X-ray image, and asked to classify it as benign or malignant. (Well, it was asked to press one of two colored bars.) If the response was correct, it received a food reward. That is, the animal receives a reward for correct answers, and learns what is considered correct.
The following figure shows how the pigeons progressed through training...
|
The graph shows the response, as percent correct vs days of training.
There are three data sets. They are for different magnification of the images. Importantly, these are successive training sequences; we will come back to this.
|
The first training was done with images at 4x magnification. This gave the results shown in the lowest curve, with circle symbols. The response rate started at about 50%, which is random. It improved with training, and reached about 85% by day 9.
After training with 4x images, the birds were then tested with images at higher magnifications (10x and 20x). The results for these training routines are shown in the upper two curves. Note that they start fairly high; this is because the birds have already been successfully trained at 4x. The birds' responses improve over a few days, and again reach a plateau, at about the same level.
This is Figure 6A from the article.
The training set-up and examples of the X-ray images are in the news stories, and also in the video listed below.
|
Overall, the pigeons are about 85% accurate in classifying the images as benign or malignant. That's not quite as good as what trained radiologists can do, but it's close -- and requires far less training.
Interestingly, if the results using four pigeons are combined, they are about 99% accurate. (The authors refer to this analysis as flock-sourcing.) They do not report a similar analysis for radiologists.
There are other tests, and the results with the pigeons vary. To some extent, the pigeons find difficult the things the radiologists find difficult, but there is more to it.
Is this useful? I don't think that is the point. The purpose of the work is to study the capabilities of the pigeon visual system and brain. It's also a reference point for the development of computer systems to analyze images. If pigeons can analyze the images, why is it so hard to develop a computer system that can do so?
News stories:
* Pigeons diagnose breast cancer on X-rays as well as radiologists -- When "flock-sourcing," they do better, with 99 percent accuracy --- and they work for seeds. (Kurzweil, November 19, 2015.)
* Pigeons spot cancer as well as human experts. (J Bohannon, Science magazine news, November 18, 2015.)
Video: Pigeons (Columba livia) as Trainable Observers of Pathology and Radiology Breast Cancer Images. (2 minutes; well-labeled, no sound.)
The article, which is freely available: Pigeons (Columba livia) as Trainable Observers of Pathology and Radiology Breast Cancer Images. (R M Levenson et al, PLoS ONE 10:e0141357, November 18, 2015.)
More about radiologists: What if there was a gorilla in the X-rays of your lungs? (July 26, 2013).
Another example of using animals to help with medical diagnosis: Rats, bananas, and tuberculosis (March 11, 2011). (The current article refers to this work.)
Next cancer post: Why are some types of cancer more common than others? Follow-up (January 24, 2016).
My page for Biotechnology in the News (BITN) -- Other topics includes a section on Cancer. It includes a list of related posts.
Does it matter what time of day you milk the cow?
December 28, 2015
By reputation, milk induces sleep. Does that mean that milk is a drug, not just a food? If so, should we wonder whether the details of milk preparation affect its pharmacological activity?
That's the idea behind a new article, which compares the effect of cow milk on mice depending on what time of day the cow was milked.
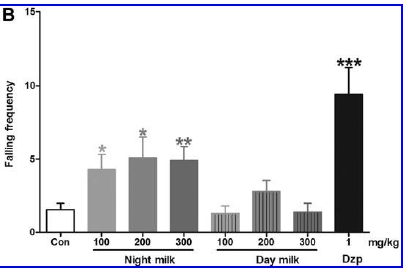
In this work, the scientists compared the effects of "Night milk" (milk collected from the cow at night) and "Day milk" on several behaviors in mice. Each behavior is related to sleep or to sedation. Here is an example...
|
The graph shows the effect of "Night milk" vs "Day milk" on the frequency of falling (during a special test).
The first bar (left, "Con") is a control, showing the falling frequency in untreated mice.
The last bar (right, "Dzp") shows the effect of a sedative drug (diazepam). You can see that it greatly increases the falling frequency. This is a positive control.
|
In between are bars for Night milk and for Day milk. For each kind of milk, there is a series of three bars, at increasing dose. You can see that all three bars for Night milk show an increase in falling frequency; the Day milk had little or no effect. (Asterisks indicate that the result is significantly different from the control.)
This is Figure 2B from the article.
|
I chose to discuss falling frequency here because it showed the biggest effect. Look at the graph above, and it's easy to see that there is an effect. The effects on other behaviors were small. Among the behaviors studied were the time required to fall asleep and the duration of sleep. Both showed small but statistically significant effects.
The scientists analyzed the milks. The Night milk contained about ten times more melatonin than the Day milk. The Night milk also contained about 25% more tryptophan. (These results were expected, based on earlier work.)
Are the observed effects consistent with what one might expect from the levels of melatonin and tryptophan found in the Night milk? Qualitatively, yes. Quantitatively? The authors do not address this, but it should be done. If there is agreement, it would strengthen the case that Night milk is more effective at promoting sleep. If there is not agreement, it would show that the story is incomplete.
Perhaps the most important point here is raising the question. If we are going to use milk as a drug, maybe we should examine it as carefully as we would an "ordinary" drug. It should not be a surprise that the composition of cow milk varies during the circadian cycle; whether it matters is open for testing. The current paper is a step.
News story: Night milk: milk taken from cows at night might be the sleep aid you need -- Sedative effects of night milk have not been tested on people but the high amounts of tryptophan and melatonin suggest it may be healthier than Ambien. (M Gajananm, Guardian, December 15, 2015.) Note the excessive interpretation in the sub-headline there; concentrations are facts, but "healthier" is open for discussion.
The article: Milk Collected at Night Induces Sedative and Anxiolytic-Like Effects and Augments Pentobarbital-Induced Sleeping Behavior in Mice. (I J I dela Peña et al, Journal of Medicinal Food 18:1255, October 26, 2015.)
A recent post about melatonin and sleep: How caffeine interferes with sleep (December 11, 2015).
More... Evening light: how it affects our sleep (July 30, 2019).
A recent post about milk: Breastfeeding and obesity: the HMO and microbiome connections? (November 14, 2015).
and then... Cockroach milk (August 21, 2016).
Also see...
* The nutritional value of yogurt? (September 28, 2018).
* Polled cattle -- by gene editing (July 8, 2016).
* Does it matter what time of day you get a vaccine? (October 26, 2012).
December 21, 2015
How balloons burst
December 20, 2015
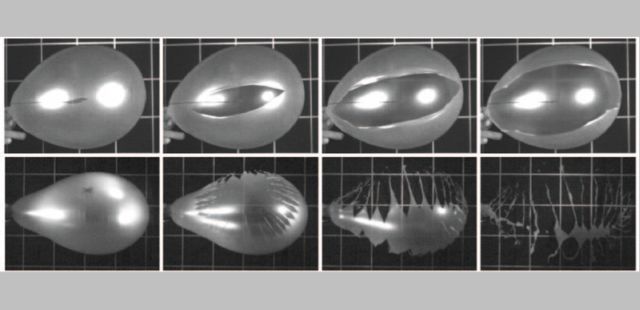
A team of physicists recently published an article on how balloons burst when punctured. The following figure shows part of the story.
Each row of the figure shows a balloon bursting. You can see the puncture site in the first (left-hand) frame.
The balloon in the top row burst along a single line or crack. The crack got larger over time (as you go from left to right).
For the balloon in the bottom row, it is more complicated. Many cracks developed, and the balloon fragmented into small pieces.
This Figure is reduced from one in the news story in Physics. It also appears in the Phys.org story. Figure 2 parts a & b of the article cover about the same ground, though a different case. That figure is labeled with times, up to 133 microseconds.
|
That is, balloons can burst in either of two ways when punctured -- with one crack line, or multiple cracks.
The next question is what determines the mode of bursting. To test this, the scientists developed a model balloon and a test apparatus, in order to have a reproducible system.
|
This is a diagram of the apparatus for testing how a balloon bursts. It is, of course, a two-dimensional cross section.
The balloon is a rubber sheet of defined properties. It is shown as a yellow stripe (labeled "membrane"). The base of the balloon is held by the "frame" (left side).
Two views of the balloon are superimposed. The uninflated balloon is entirely within the frame area; see the dotted line there. Air is added via the "air inlet" at the left. This inflates the balloon.
|
At the right is a "blade". When the expanding balloon reaches the blade, it pops. By varying how far the blade is from the frame, the scientists control how large the balloon is upon bursting. Of course, the balloon size is proportional to the pressure within the balloon.
"Camera 1" (at the right) records the action upon puncture, at 30-60,000 frames per second.
This is Figure 1 from the article.
|
After many tests, the general conclusion is that balloons at low pressure burst with a single crack when punctured; in contrast, balloons at high pressure burst with multiple cracks. Analysis showed that the multiple cracks arose largely by branching.
Of course, it is not simply the pressure that matters; it is the stress in the membrane. At high stress, rapid propagation of the crack leads to further fragmentation of the membrane.
This is probably the best study ever made of how balloons burst. But how things fragment is of wide interest, e.g., to engineers -- and geologists. This study, using simple materials but modern technology, offers some insight.
News story: Into how many pieces does a balloon burst? (Phys.org, November 2, 2015.)
News story from the publisher in their news magazine. Freely available at: Focus: Two Modes of Balloon Bursting Revealed. (P Ball, Physics 8:105, October 30, 2015.)
Videos. The above item, in Physics, includes two video clips from the authors. Video 1 (20 seconds) shows toy balloons bursting, one by each process; these are shown slowed down so you can follow what happens. The images in the top figure above may be from this video. Video 2 (43 seconds) shows you their experimental apparatus -- in action. The videos are well-labeled, but do not have meaningful audio.
The article: Popping Balloons: A Case Study of Dynamical Fragmentation. (S Moulinet & M Adda-Bedia, Physical Review Letters 115:184301, October 30, 2015.)
More about things bursting:
* The aroma of rain (June 13, 2015).
* Pop goes the hemozoin: the bubble test for malaria (January 24, 2014).
More on ballons: Robot uses coffee as a picker-upper (December 17, 2010).
More about stress responses: How to confuse a yeast -- a sensory illusion (January 15, 2016).
GJ 1132b: "the most important planet ever found..."
December 18, 2015
That gets attention, doesn't it? Even with the qualification that follows: " ... outside the Solar System." It's from the news story in the journal. There are so many new planets being discovered these days that it can be hard to get attention.
Yes, GJ 1132b is interesting. Perhaps not up to the standard suggested by the title here, but interesting. In fact, the authors seem to have said "most intriguing". That's more reasonable.
So what's the deal? First, GJ 1132b is about Earth-size. Moreover, it is Earth-like. It's rocky, based on measuring its density. That means it is also Venus-like.
Second, it's rather close, at least by astronomical standards. About 39 light-years away.
Third, it has an interesting Sun. GJ 1132 is a red dwarf star, small and cool. Cool star, but the planet is only a million miles away (it orbits the star every two days!).
What's the point? The temperature on GJ 1132b may be about 230 °C. That is too hot for life (or for liquid water), but it makes GJ 1132b the coolest rocky planet yet found. It's cool enough that it may well have an atmosphere -- and that's why it is interesting. An atmosphere, and close enough to us that we should be able to study it. That its star is small and dim is a bonus; the starlight interference will be smaller. It would be the first case where we are able to get information about the atmosphere of an Earth-like planet beyond our Solar System. That's interesting, even intriguing.
Planet GJ 1132b is referred to both as Earth-like and Venus-like. Of course, in terms of size, it is both. Earth-like is a major focus for planet hunters. The new planet is too hot for life. Venus is hot with an atmosphere; that's why some refer to it as Venus-like.
The news stories listed below are good at describing why the new planet is interesting. The article itself documents the technical information.
News stories:
* Astronomers eager to get a whiff of newfound Venus-like planet. (Science Daily, November 11, 2015.)
* A Relatively Nearby Earth-Sized Planet. (P Gilster, Centauri Dreams, November 11, 2015.)
* News story accompanying the article: Astronomy -- A small star with an Earth-like planet. (D Deming, Nature 527:169, November 12, 2015.)
* The article: A rocky planet transiting a nearby low-mass star. (Z K Berta-Thompson et al, Nature 527:204, November 12, 2015.) Check Google Scholar for a freely available copy at ArXiv.
More from a dwarf star... Habitable planets very close to a star (June 19, 2016).
A post about Venus: Sulfur dioxide in the atmosphere of Venus (February 16, 2013). Links to more.
A recent post about exo-planets: Most Earth-like (habitable) planets haven't formed yet (October 27, 2015).
Also see... Atmosphere suggests planet might harbor life (August 30, 2010). Discusses how one studies the atmosphere.
December 16, 2015
How vitamin C kills cancer
December 15, 2015
You're surprised by the title?
There is a long and fascinating story about vitamin C and cancer. The bottom line is that mainstream science has largely given up on the vitamin for cancer treatment.
So what's new? A new article shows how it works. And in this case, "how" includes "when". That is, the new article suggests that vitamin C might work against particular types of cancer -- but not others.
The following experiment shows one part of the story...
|
The graph shows the uptake of vitamin C by two human cancer cell lines, grown in lab culture. These particular cell lines are known to have high levels of a glucose transporter called GLUT1.
Three conditions were tested. The two colored bars for each condition are for the two cell lines. The results for the two cell lines were similar in each case, so we'll consider them together.
The first condition (left) is the control. Just vitamin C was added; see the key at the bottom. The amount transported into the cells was set to 1.
|
For the second condition (middle), glutathione (GSH) was also added. It is an anti-oxidant (reducing agent). Its presence ensures that all the vitamin C is in the reduced form; none is in the oxidized form, dehydroascorbate (DHA). The addition of GSH resulted in much less transport of vitamin C; this suggests that it is the oxidized form that was being transported.
For the third condition (right), STF31 was also added. STF31 is an inhibitor of the GLUT1 transporter. It also resulted in much less transport of vitamin C. This shows that it is the GLUT1 transporter that is involved.
This is Figure 1A from the article.
|
Together, the results shown above suggest that the oxidized form of vitamin C is being transported into the cells, using the GLUT1 transporter. And the cell lines used here carry mutations that lead to high levels of that transporter.
Why is this interesting? The scientists go on to show that transporting large amounts of oxidized vitamin C (DHA) into cells can inhibit them, even kill them. Why? Because high levels of the oxidized form of vitamin C create oxidative stress in the cells, which can lead to cell death. That is, transport of vitamin C -- the oxidized form -- kills some cells and not others. It kills cells with a high level of the GLUT1 transporter. Those cells can transport the oxidized vitamin into the cells. That kills them by upsetting the redox (oxidation-reduction) balance in the cells.
What are these cells that can transport vitamin C so well -- to their own detriment? They are certain kinds of cancer cells, with certain specific mutations.
Is it possible, then, that vitamin C would inhibit the growth of cancers with these mutations? To test this, the scientists tested a model system in mice. It worked.
It is an interesting scientific article. The scientists do many experiments, and develop many ideas. It follows from the work that vitamin C might be a useful treatment for certain cancers. But it doesn't prove that it will work "in the real world". Even if all their biochemical insights are correct, it doesn't mean that the effect will be useful. A mouse test is interesting, but mouse testing has a poor track record in predicting cancer treatments.
This needs to be tested in humans. I suspect that will get done. It will be done using cancers that have been pre-screened to see if they carry mutations that lead to high levels of the GLUT1 transporter. That's the key point. The article suggests which cancers may be susceptible to vitamin C. A test needs to focus on those cancers.
There is an incentive to follow up these findings. The mutations studied here are usually associated with cancers that are currently hard to treat.
Is it possible that old trials of vitamin C could be re-analyzed in the light of this new information? That is, in those old trials, were the positive results more prevalent in the cancers with the high GLUT1 level? In principle, it is possible to do that analysis -- if DNA can be isolated from stored samples. I have no idea if such samples are available.
News stories:
* Vitamin C halts growth of aggressive forms of colorectal cancer in preclinical study. (Medical Xpress, November 6, 2015.)
* High-Dose Vitamin C Kills Mutant Colorectal Cancer Cells, Suggesting New Treatment Approach. (L Bushak, Medical Daily, November 6, 2015.) Includes some skepticism about the proposed treatment, but it seems based more on history than on criticism of the new findings.
* News story in the journal previewing the article: Vitamin C could target some common cancers. (J Kaiser, Science 350:619, November 6, 2015.)
* News story accompanying the article: Cancer: Revisiting vitamin C and cancer. (C R Reczek & N S Chandel, Science 350:1317, December 11, 2015.)
* The article: Vitamin C selectively kills KRAS and BRAF mutant colorectal cancer cells by targeting GAPDH. (J Yun et al, Science 350:1391, December 11, 2015.)
Previous cancer post... The WHO report on the possible carcinogenicity of meat (December 12, 2015). That's the post immediately below.
A post that mentions vitamin C -- and says it doesn't work against cancer: Is folic acid good for you or bad for you? (April 10, 2010).
Oxidative stress and the anti-oxidant glutathione were discussed in the post Are birds adapting to the radiation at Chernobyl? (August 3, 2014).
But also see... Anti-oxidants and cancer? (October 18, 2015). Anti-oxidants are a complex issue. The balance is important.
My page for Biotechnology in the News (BITN) -- Other topics includes a section on Cancer. It includes a list of related posts.
The WHO report on the possible carcinogenicity of meat
December 12, 2015
It was a big news story a few weeks ago: the World Health Organization (WHO) reported that processed meat is carcinogenic, and red meat may be carcinogenic.
It's an interesting story, even important. But it is also confusing. Here are some comments about the report. They are based on my reading of some of the materials, plus listening to an hour discussion of it; one of the panelists was on the WHO team that prepared the report.
It's important to keep fact and opinion separate with such a story, so let's start with some facts...
Preparing such reports is a normal activity of WHO. More specifically, it is an activity of the International Agency for Research on Cancer (IARC), within WHO. The IARC team that prepared the report is a team of scientists.
WHO did not test anything. They did not do any experiments. The report is based on an analysis of what has been published. WHO has standards for evaluating the quality of trials, and they have rules that guide their decision-making process.
WHO defines their terms. It is important to understand what it is they claim. Their definition of "processed meat" may be especially important.
The report has not yet been published. There are summaries available. The full report will be published, in a WHO monograph; I do not know when.
Ok, those are facts. Let's look at some of the issues. This part may include my analysis and opinions.
The main findings are stated as broad generalities: processed meat is shown to be a human carcinogen; red meat is a possible carcinogen. These characterizations are based on standards established by WHO.
They have compared processed meat with cigarettes -- and caused considerable confusion by doing so. The comparison is intended to reflect the confidence in the conclusion, not the magnitude. That is, they are just as confident that their analysis shows processed meat is carcinogenic as they are for cigarettes. However, the magnitudes are very different.
Here is an example of a magnitude, using round numbers. If one eats 50 grams of processed meat per day over a lifetime, there is (says the report) a 20% increase in the risk of cancer. Since the baseline risk is about 5%, it becomes 6% with the consumption of processed meat. (The 50 grams, or about 2 ounces, is about two strips of bacon.) These magnitude numbers are sometimes reported in a way that is not clear. It is not two strips of bacon, but two strips of bacon per day over a lifetime. It is important to understand the dose that is involved.
A concern about that statement is what "processed meat" refers to. The report is very clear in saying what they mean, but it is not what most people would mean by the term. For the report, it refers to a wide variety of meats, processed in various ways. (Processing is traditionally done for preservation, but it may also be done for taste.) But that's confusing. Meats are processed in various ways. There is no reason why the various treatments should have similar effects. One would presume that some forms of meat processing are more carcinogenic than others. Lumping them is confusing. Why did they do this? Apparently because they were unable to reach conclusions for individual types of processed meats. That may well reflect limitations of the tests that they analyzed; remember, they did not do any tests, but merely analyzed what was already reported.
This leads to another point of interest... Why are processed meats carcinogenic? Or, better, why is a particular type of processed meat carcinogenic? In fact, there has long been evidence that certain types of "curing", using nitrates, could lead to the formation of nitrosamines, a type of chemical that is known to be carcinogenic. In one sense, it might not matter why something is carcinogenic. If it is, let's avoid it. But in this case, they claim that a heterogeneous class of things is carcinogenic. It really would be nice to sort that out.
What about meat, which they conclude is a possible carcinogen? What meat? Red meat, which means mammalian muscle. The stuff we typically eat, from cows and pigs and such (but not birds).
It's odd that meat is carcinogenic. If meat means mammalian muscle, that's us. That would mean we are carcinogenic. Now, maybe it's only carcinogenic to the digestive system. Maybe.
This gets us back to the issue, why is it carcinogenic? In fact, it's well known why meat is carcinogenic -- at least one reason. It's the way we cook it. High temperature treatment of meat leads to "char", which is quite likely carcinogenic. If this is the main reason they are getting a signal from meat, wouldn't it be good to make a distinction between "meat is carcinogenic" and "how we cook meat makes it carcinogenic". (That also gets us out the hole of ourselves being carcinogenic.)
Some of the points I raised above were among my first thoughts when I heard about the report. Interestingly, they came up during the discussion; the panel member who was involved in the report understood the points, and had proper responses. The comments are not criticisms of the report as much as a reflection on the state of our knowledge. (However, I do wonder why they say some things the way they do. They have a penchant for saying things that are predictably confusing.)
Eating meat is a normal activity for many animals (and even an occasional plant). Cooking it and preserving it are not. (Cooking makes meat more digestible, and we like the taste. Treatment of meat to preserve it was an important development for mankind, before refrigeration.) How much of what WHO found is fundamental to meat, and how much is due to the things we do to it -- all with the best of intentions?
What to do? We can divide that into parts, what an individual should so and what the scientific community should so.
The effects described here are small. If you want to reduce your consumption of meat and especially processed meat, fine; it's not likely it will make much difference in your risk of cancer, but it is a proper step. Further, it would be good to compare the effect with other risks you take. Those who might consume unusually large amounts of meat or processed meats would have a stronger case; it would also be good to learn about other problems from eating large amounts of meat, which are beyond our scope here.
The more important implications are for the scientific community. The work raises lots of questions.
News stories:
* WHO Confirms Eating Meat Causes Cancer, But How Did This Once Healthy Food Become So Deadly? (D Dovey, Medical Daily, October 26, 2015.)
* Processed meat can cause cancer. (Science Daily, October 27, 2015.)
A Q&A posted by WHO at their web site: Q&A on the carcinogenicity of the consumption of red meat and processed meat. (IARC, WHO, 2015.) This is good, though at times you may have the feeling you are dealing with a government report.
News story published by the WHO panel in a scientific journal: Carcinogenicity of consumption of red and processed meat. (V Bouvard et al, Lancet Oncology 16:1599, December 2015.) Check Google Scholar for a freely available copy. Two pages; a good overview by the authors of the study. As noted, their full report will be published separately, and is not yet available.
More about meat...
* Growing meat without an animal? (April 11, 2018).
* Red meat and heart disease: carnitine, your gut bacteria, and TMAO (May 21, 2013).
* Carnivorous algae -- that hunt large animals (October 7, 2012).
More about the WHO, a political organization that deals with science: The role of WHO: the view of its director (December 1, 2015).
And then... Is glyphosate (Roundup) a carcinogen? (March 6, 2016).
Next cancer post... How vitamin C kills cancer (December 15, 2015). This is the post immediately above.
My page for Biotechnology in the News (BITN) -- Other topics includes a section on Cancer. It includes a list of related posts.
My page Internet resources: Biology - Miscellaneous contains a section on Nutrition; Food safety. It includes a list of relevant Musings posts.
How caffeine interferes with sleep
December 11, 2015
Drinking coffee late in the day can keep you awake. A recent article explores why.
Body physiology varies during the day. That's the circadian rhythm. (Circa-dia = about a day.) We have a natural cycle of sleeping and waking. (People vary; for example, there are morning people and night people.) Jet lag is a manifestation of our circadian rhythm. Melatonin is a hormone involved in our circadian rhythm; it is sometimes used to treat jet lag.
The article here looks at the effect of caffeine on melatonin. We will note just one experiment, on the effect of caffeine on the melatonin cycle in humans. ("Melatonin cycle"? It is a specific measure of the level of melatonin, one that marks the circadian response as the beginning of night.)
The general idea is that the scientists gave the test subjects a dose of caffeine and measured the effect on melatonin. We'll skip some details, so don't make much of the specific numbers. Here are some results...
|
The graph shows the effect of various treatments on the melatonin cycle. The y-axis is a time scale, showing the shift in the melatonin cycle, in hours. Negative values mean that the effect is to delay sleep.
The treatments involve light and caffeine.
The first bar (left, clear) is for "dim light". It has little effect; you can even take this as a control.
The second bar (dark) is for dim light plus caffeine. (The first condition included a placebo for the caffeine.) There is a big change in the melatonin cycle. That's the key point.
|
The last two bars (to the right, bars with diagonal lines) are for bright light, without or with caffeine. Both show a greater effect; they are not significantly different from each other.
This is Figure 2A from the article.
|
In summary, the results show that caffeine affects the melatonin cycle, as does light. The direction of the effect is to delay sleep. Of course, light is a normal controller of the circadian rhythm. The results here show that caffeine acts like light. That is, caffeine acts on sleep via the common circadian rhythm. Thus we begin to see why a late cup of coffee can keep you awake.
The experiment above was done shortly before bedtime. At that time of day, light delays sleep -- and so does caffeine. The scientists have not (yet) tested the effect of caffeine on the morning part of the melatonin cycle.
News story: How Caffeine Affects the Body Clock -- Evening consumption of the drug leads human circadian rhythms to lag. (R Williams, The Scientist, September 16, 2015. Link is now to Internet Archive.)
The article: Effects of caffeine on the human circadian clock in vivo and in vitro. (T M Burke et al, Science Translational Medicine 7:305ra146, September 16, 2015.)
Posts on circadian rhythms or melatonin include:
* Evening light: how it affects our sleep (July 30, 2019).
* The genetics of being a "morning person"? (April 15, 2016).
* Does it matter what time of day you milk the cow? (December 28, 2015).
* Melatonin and circadian rhythms -- in ocean plankton (November 24, 2014).
* Sleepy teenagers (July 23, 2010).
Posts on caffeine or coffee include...
* Using caffeine to treat premature babies: risk of neurological effects? (April 27, 2019).
* Good news on the coffee front: Coffee is good for you (March 15, 2016).
* Your desire for caffeine: It may be in your genes (May 31, 2011). This post makes a connection between caffeine and adenosine; if you pursue the current article further, that connection appears again.
* Robot uses coffee as a picker-upper (December 17, 2010).
December 9, 2015
A better way to oxidize americium? A step toward improved processing of nuclear reactor waste?
December 7, 2015
Americium (element #95, symbol Am) is an important waste product from nuclear reactors. It is very "hot". It is also hard to separate from several other elements in the crude waste. That's because it is commonly in the +3 (or III) form (oxidation state), and it behaves much like several other elements that are +3.
It should be possible to oxidize Am to a higher oxidation state, V or VI, thus allowing its chemical separation from those other elements, which can't be oxidized. However, it has proven difficult to do so in practice.
A new article reports an interesting development, which may allow a practical oxidation of Am(III) to the higher oxidation states. It has been known that the oxidation is easier if the Am is in a complex. What the scientists did here was to attach the complexing agent to the electrode. Thus, the Am(III) being oxidized at the electrode was complexed. The oxidized Am could be removed, but the complexing agent stayed on the electrode. This simplifies purification of the oxidized Am, and also makes it easy to reuse the complexing agent. The major product is Am(V), in the form of AmO2+.
The following figure shows some results, and also illustrates how the scientists did the analysis -- by looking at the color change.
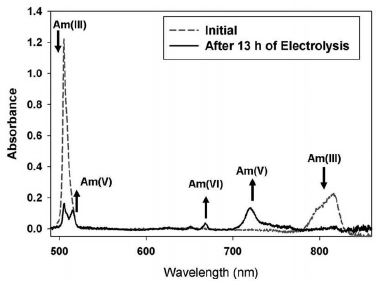
|
The figure shows two spectra, superimposed on the same graph. One is for the Am sample before the treatment (dashed line); the other is for the same sample after the oxidation (solid line).
Quick inspection shows that the two curves are different.
Arrows point to some of the key changes. There are two peaks that are characteristic of the initial Am(III), one each at about 500 nm and 800 nm. Both of these largely disappear during the treatment. There are various peaks for Am(V) and Am(VI), which appear during the treatment.
This is Figure 4, right side, from the article.
|
This is an interesting solution to an interesting chemistry problem. The context of the problem is also interesting. The news story in Science spends considerable time outlining how nuclear reactor waste is processed -- and how a practical way to separate americium could be a step toward a much improved process of waste disposal. The second figure of that news story outlines how they envision a grand scheme for nuclear waste treatment. Here is that figure: Scheme for treatment of nuclear reactor waste [link opens in new window]. The "big idea" is that, with proper separations, only small amounts of waste need the extremely long term storage that we often hear about.
News story: Functionalized porous electrode used for radioactive waste product. (H Zeiger, Phys.org, November 17, 2015.)
* News story accompanying the article: Nuclear fuels: How to isolate americium -- An electrolytic process enables isolation of the radioactive element americium from used nuclear fuel. (C Soderquist, Science 350:635, November 6, 2015.) As noted above, this provides a nice overview of the problem of what to do with waste nuclear fuel.
* The article: Electrochemical oxidation of 243Am(III) in nitric acid by a terpyridyl-derivatized electrode. (C J Dares et al, Science 350:652, November 6, 2015.)
You may recognize americium as a component of common smoke detectors. Would the present work impact the production of those devices? In principle, perhaps, but the amount of Am used for that purpose is actually quite small. Each smoke detector contains less than one (US) cent's worth of Am. Existing stockpiles of Am are enough to satisfy this need for a long time.
Other posts perhaps related to nuclear energy include:
* A nuclear-powered battery for your phone? (October 9, 2024). And it is about americium.
* Analysis of uranium samples from World War II Germany (November 7, 2015).
* Radioactivity released into ocean from Fukushima nuclear accident reaches North America (March 23, 2015).
My page of Introductory Chemistry Internet resources includes a section on Nucleosynthesis; astrochemistry; nuclear energy; radioactivity. It includes a list of related Musings posts.
This post is also listed there in the section Lanthanoids and actinoids.
There is a section of my page Internet Resources for Organic and Biochemistry on Energy resources. It includes a list of some related Musings posts.
When the laundry piles up... An econophysics critique of smart meters
December 6, 2015
This post is about an article in a physics journal; the topic is when you should do the laundry. The authors didn't actually do any laundry; this is a theoretical analysis of laundry, using the tools of econophysics, whatever that is. In all seriousness, it is an interesting and provocative analysis of a current issue in energy resources.
What's the real issue? Smart meters. These are meters that measure your electricity usage and report it continuously back to your electricity company. This lets the company bill you using different prices per unit of electricity depending on when you use it. The idea is that electricity is more valuable during certain times, referred to as peak usage; therefore, peak-usage electricity should cost more. If you do your laundry at night, during off-peak times, they will charge you less than if you do it during the day, when demand is high.
In fact, your smart meter can do more than that. It can turn your washing machine on all by itself, presumably late at night when electricity is cheap. (This assumes that your washing machine is intelligent enough to understand the smart meter; modern washing machines are, or soon will be.)
We understand that power plants have a finite capacity, and that usage patterns vary. For things where you can choose, it is good to use electricity when demand is lower. And it is reasonable that the electricity company charges less for off-peak usage, to encourage you to make that choice. Sounds good. Or is it?
A new article, from the Institut für Theoretische Physik, Universität Bremen, challenges the alleged benefit. The authors argue that attempts to control electricity usage using feedback from the usage level could backfire: it could lead to catastrophic swings in usage, which would defeat the purpose. Imagine the following, extreme scenario... usage declines, so the price is reduced. Everyone turns on their washing machine -- manually or automatically, it doesn't matter; the point is that the lower price triggers demand. The result? A higher overall demand than happens during the usual peak period.
The authors show the effect by computer modeling. It makes sense.
Comment... Isn't this just a problem with the nature of the feedback? This is all about computer software, at the electric company. It monitors usage and sends out commands (or information) that adjust usage. That makes some sense. (We'll ignore privacy concerns here. In particular, we'll assume that accepting usage commands is voluntary.) If the company computer sends out commands to use more electricity than is available, that's not so good. Surely, good software can figure that out.
Smart meters have been the subject of considerable debate, with good arguments for them, and some concerns. The current article raises an interesting issue, but it should be solvable. It's one thing to suggest that feedback from usage to price may be good, but that doesn't mean that any feedback procedure that is suggested is good; details matter.
News stories:
* A seemingly obvious way to make the electricity market better may actually make it worse. (L Zyga, Phys.org, July 23, 2015.)
* Smart Meter Time Varying Pricing Can Lead to "Catastrophic Consequences" for the Grid. (K T Weaver, Smart Grid Awareness, July 27, 2015.) This is from an anti-smart meter site. Despite the obvious bias, it's a useful presentation. Just be aware that it presents only part of the story.
The article: Econophysics of adaptive power markets: When a market does not dampen fluctuations but amplifies them. (S M Krause et al, Physical Review E 92:012815, July 22, 2015.) Check Google Scholar for a copy.
Previous post about laundry: Folding towels (April 10, 2010).
Also see a section of my page Internet Resources for Organic and Biochemistry on Energy resources. It includes a list of some related Musings posts.
Can one tell if a fingerprint is from a male or a female?
December 4, 2015
Fingerprints are a mainstay of police work. The physical pattern of a fingerprint is compared to a database of known prints. There is no way to derive that pattern from any knowledge about the person.
There is now some effort to see what we can learn from analysis of what is in a fingerprint -- the chemicals left from sweat, for example. A new article shows that one can learn the sex of the person leaving a fingerprint from a simple biochemical analysis.
The figure shows some results with real fingerprints.
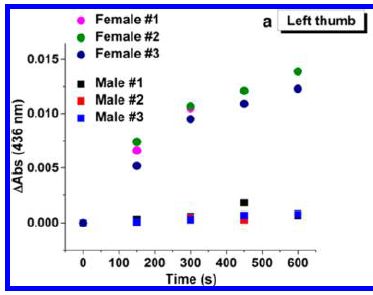
|
The graph shows the assay response vs time, using samples from fingerprints of three females and three males.
The results for samples from females are shown with circle symbols of various colors; male samples are shown with squares.
You can see that the female samples give a higher signal; it is clear at the first time point (150 seconds).
This is Figure 3a from the article; it shows results for left thumbs. Part b shows right thumb results for the same people; they are quite similar.
|
What is the analysis? It involves extracting the amino acids from the prints. The extracted samples are then tested for the level of amino acids. This is done using an enzyme that oxidizes the amino acids, with the enzyme action being coupled to the production of a visibly colored product.
The y-axis on the graph shows the amount of color seen in the analysis. The results here were recorded with a spectrophotometer, but it is likely that a practical test could be developed based on visual distinction. In fact, the entire assay is simple, and could probably be developed in something like a dipstick format.
It's simple, and seems to work. Is it useful? It is part of a broader effort to, literally, extract more information from fingerprints than simply the pattern. The article establishes that it may work. What the limitations are is less clear. The authors note that their results are for samples from Caucasians. That limitation can easily be tested, but who knows what it will reveal. I wonder what old prints might do. Is it possible that old prints from females may have lost some of their amino acids, and appear male? Extensive testing will ultimately tell us. For now, this is an interesting development; take it with plenty of caution.
News stories:
* Fingerprints Yield Sex Info -- The amino acids left behind in a human fingerprint can be used to determine whether an individual is male or female. (K Zusi, The Scientist, November 5, 2015. Now archived.) A short note.
* Male or female: Gender fingerprinting. (David Bradley, Wiley Analytical Science Magazine, November 30, 2015.)
* Review: Forensic Identification of Gender from Fingerprints. (Emily C Lennert, Florida Forensic Science (Orange County Public Defender, Orlando), July 26, 2017.)
The article: Forensic Identification of Gender from Fingerprints. (C Huynh et al, Analytical Chemistry 87:11531, November 17, 2015.)
More about fingerprints:
* Briefly noted... How fingerprints develop (June 2, 2023).
* Why some people don't leave fingerprints (September 19, 2011).
* Fingerprints (April 2, 2010). Forensic use.
More forensic science: How easy is it to destroy any traces of 43 students by burning them? (October 25, 2016).
December 2, 2015
The role of WHO: the view of its director
December 1, 2015
The World Health Organization (WHO) is an agency of the United Nations (UN). It has been much criticized for how it handled the Ebola outbreak -- and that wasn't the first time. Fact is, WHO is a political organization -- and it behaves as such.
Science magazine recently did an interview with the head of WHO. It's interesting. In offering it here, I am not endorsing anything or anyone, but merely allowing one relevant party to speak. We need to think about how the world community handles medical issues; WHO is part of the effort.
Interview, freely available: In wake of Ebola epidemic, Margaret Chan wants countries to put their money where their mouth is. (K Kupferschmidt, Science Insider, October 14, 2015.) This is an interview with Margaret Chan, WHO director-general, by a member of the news staff at Science. A short version of the interview appeared in the magazine, 350:495, October 30, 2015. The interview also briefly discusses the problem of increasing antibiotic resistance.
Recent Ebola post, which is relevant here: After Ebola, what next? and how will we react? (September 5, 2015).
There is a section on my page Biotechnology in the News (BITN) -- Other topics for Ebola and Marburg (and Lassa). That section links to related Musings posts, and to good sources of information and news.
Something good WHO did... International relations: sharing flu viruses (May 28, 2011)
More WHO...
* WHO: We need to prepare for Disease X (May 13, 2018).
* The WHO report on the possible carcinogenicity of meat (December 12, 2015).
The "hobbits": dentition suggests they were a distinct, dwarfed human species
November 30, 2015
"Hobbits" is a nickname given to some small hominins (human-like animals) found on Flores Island in Indonesia; they are known only from some fossils, estimated age about 18,000 years. Their relationship to modern humans is disputed. Hypotheses include that they represent modern humans, but a diseased state. Alternatively, they might be a new species, with one or another connection to the lineage of modern humans. For those favoring species status, the hobbits are Homo floresiensis. These alternatives have been noted in various Musings posts; one is listed as background at the end here, and it links to the others.
Distinguishing among the hypotheses requires evidence, and that is hard to come by from the limited samples.
A new article reports a thorough analysis of the teeth available from four hobbit specimens.
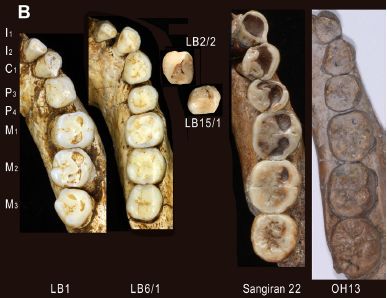
|
The figure shows teeth from four Homo floresiensis individuals (coded with LB numbers). It also shows teeth from early Javanese H. erectus (Sangiran) and H. habilis (OH).
The teeth are aligned, so similar teeth are in a horizontal row; they are coded at the left with standard tooth-numbering.
This is Figure 9B from the article.
|
Don't try too hard to make much of this from the pictures. The scientists took detailed measurements of all these teeth and more, and fed them to a computer for comparative analysis.
Upon integrating all the data, the scientists concluded that the hobbit teeth are quite distinct from the teeth of modern humans (Homo sapiens). This argues against the model that the hobbits are diseased or deformed forms of modern humans.
They then suggest that the teeth are most likely from the line Homo erectus, known to be in the region. They prefer a model in which the hobbits represent a dwarfed version of H erectus that developed in the confines of the island. If this holds, it would mean that the hobbits are not particularly close to modern humans, but rather are a side branch. It's interesting that a distinct species of Homo co-existed with "us" only 18,000 years ago.
"... [T]he dental remains from multiple individuals indicate that H. floresiensis had primitive canine-premolar and advanced molar morphologies, a combination of dental traits unknown in any other hominin species. The primitive aspects are comparable to H. erectus from the Early Pleistocene..." From the abstract of the article.
This is a serious analysis, and provides much information about the puzzle. Whether the conclusions from this work are correct remains to be seen. I suspect that the interpretation of the results will prove contentious.
Delightfully, from the Introduction of the article, referring to the full set of hobbit features. not just the dentition... "Researchers agree that this unique mosaic has significant evolutionary meaning, but disagree on what it is."
News story: Dental analysis suggests Homo floresiensis was a separate species from modern man. (B Yirka, Phys.org, November 20, 2015.)
The article, which is freely available: Unique Dental Morphology of Homo floresiensis and Its Evolutionary Implications. (Y Kaifu et al, PLoS ONE 10:e0141614, November 18, 2015.)
Background post on the hobbits: The little people of Indonesia (May 14, 2009). Includes a list of all Musings posts on the hobbits.
Next... Homo floresiensis -- revised dating of the original "hobbit" site (June 25, 2016).
Posts about teeth from ancient humans include...
* The case of the missing incisors: what does it mean? (September 13, 2013).
* Analysis of teeth confirms that Regourdou was right-handed (September 7, 2012).
More old teeth. Many more... Helicoprion -- a fish with 117 teeth, arranged in a spiral (March 9, 2013). Links to a follow-up.
Claiming knowledge one does not have: it's particularly common with those who think they are experts
November 29, 2015
What do you think of the "1975 Public Affairs Act"?
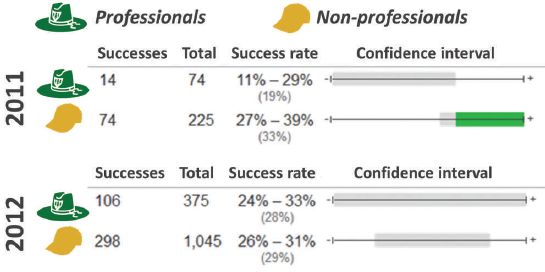
When a representative group of Americans was asked that, in the late 1970s when it might have been current, a third of the respondents expressed an opinion, one way or the other. That is, a third of those questioned claimed some knowledge of the Act.
That's an interesting finding -- because there is no such Act.
That is an example of people claiming knowledge they don't have. It's a nice example, because it is easy to tell whether they really have the knowledge they claim: there is no such Act. This phenomenon is called over-claiming.
A recent article extends the study of over-claiming to explore the effect of expertise. Are those who think they know a field well less likely to make excessive claims of their knowledge in the field -- or more likely? More likely, say the results. That is, "experts" are more likely to over-claim knowledge than non-experts.
It's an odd article, in that most of the results, which are quantitative, are presented as narrative, with almost no tables or figures.
Here's a brief summary of one experiment... Test subjects were randomly assigned to two groups. Each group was given a little geography quiz. After taking the quiz, they were asked to rate their knowledge of geography. One quiz was quite easy, the other was quite difficult. Those who took the easy quiz rated themselves as more knowledgeable about geography than did those who took the difficult quiz. That is, it seems that the easy quiz induced a feeling of expertise in the subject matter. Both groups were then asked to rate their familiarly with some geographical locations, some real and some not. The group that took the easy quiz was more likely to claim knowledge of non-existent locations. The authors interpret this as showing that the feeling of expertise induced by the easy quiz led to an increase in over-claiming.
The work describes a phenomenon. It does not explain it. Even the finding that it relates to one's perception of expertise is more description than explanation. It does not tell us whether people over-claim knowledge because it is human nature to do so, or because our culture (education?) teaches us to do so, or who knows what. In particular, there is no claim that it is because people deliberately lie.
Perhaps you are aware of the phenomenon. You may see it in politicians and in advocates for positions you disagree with. Yes, that's all probably true. But be careful. You may well show it, too -- along with those on your side. Whatever the reason, it is likely common. We don't carefully and critically examine everything we know. At the very least, when it matters, you should do so. When someone's "knowledge" is questioned, it would make sense to go check, go look it up.
Science, at least collectively, understands this. It is fundamental in science that knowledge is tentative, subject to questioning and further work. Of course, individual scientists may well express high confidence in their knowledge, for better or worse. And our education system tends to transmit "facts", often with little understanding of their source or certainty.
It's an intriguing article. Sorting out the causes of over-claiming is for future work. For now, we simply recognize the phenomenon of claiming knowledge one does not have. And we recognize that being knowledgeable does not prevent over-claiming; it may even make it worse.
"Continuing to explore when and why individuals overclaim may prove important in battling that great menace -- not ignorance, but the illusion of knowledge." That's the final sentence of the article.
You might wonder, regarding the story at the top of this post... Maybe there was something of a similar name that was in the news. That is, maybe this was confusion, not over-claiming. That is a proper kind of question to ask. I don't know in this case (but one can check it out, in the reference quoted in the current article). We must emphasize that the phenomenon of over-claiming is not based on one such story, but on much accumulated evidence.
Is over-claiming related to one's genuine knowledge of the subject, or to one's self-evaluation of expertise? Those are somewhat distinct issues, and the article discusses both. The particular experiment above focuses on the latter.
News stories:
* Self-proclaimed experts more vulnerable to the illusion of knowledge. (Science Daily, July 20, 2015.)
* 'Learned' people easily may claim facts impossible to know. (B Friedlander, Cornell Chronicle, June 11, 2015.) From one of the institutions involved in the work.
The article: When Knowledge Knows No Bounds: Self-Perceived Expertise Predicts Claims of Impossible Knowledge. (S Atir et al, Psychological Science 26:1295, August 2015.) The example I posed at the start of this post is taken from the introduction in this article. They give a reference to the study, which I did not check.
I think there is some connection between this and the recent post Using a smartphone as your extended brain (November 17, 2015).
Two fine books, listed on my page of Books: Suggestions for general science reading are relevant to the topic...
* Gleiser, The Island of Knowledge -- The limits of science and the search for meaning (2014).
* Kahneman, Thinking, Fast and Slow (2011).
Reducing asthma: Should the child have a pet, perhaps a cow?
November 28, 2015
Asthma is an increasing problem. It involves a respiratory distress, due to an immune reaction. Why it is increasing is unclear, but there is a perception that it has something to do with the greater cleanliness common in modern society. The idea is that, somehow, the exposures to antigens that commonly occur in early life are important for normal development of the immune system. Too much cleanliness, and the immune system doesn't develop "normally". It's an appealing idea, sometimes called the hygiene hypothesis. The problem is that it is rather broad, and we have little idea of the specifics. In fact, data to support the broad hygiene hypothesis as well as specific aspects of it are weak.
A new article offers one of the best tests yet of the hygiene hypothesis. It makes use of national databases in Sweden, which record information about every person -- and every dog. The analysis provides support for the hygiene hypothesis, but also shows the limitations of even a big study.
Here is one summary table from the article...
The general plan was to analyze the data for all children in Sweden over a certain time period, using the national databases. Information included whether or not the child had asthma, and whether or not the household had a dog, or had family members who handled farm animals. The scientists could then calculate how exposure to dog or to farm animals affected the odds of getting asthma. More specifically, the analysis relates exposure to the animals in the first year of life to the appearance of asthma at age 6.
There are several rows of data here, but looking at one row in detail will serve our purposes.
Look at the first row, for "All"; it summarizes the results over the entire population studied. The first column of numbers is the odds ratio (OR), with its 95% confidence interval (CI). The first value, for exposure to dog, shows an OR of 0.92. This means that children with dogs had 0.92 as much asthma as those without dogs; that is an 8% reduction. The CI is entirely below 1, and the p value shown is below the common cutoff of 0.05. Thus the result appears to show a statistically significant difference.
On that same row... the result at the right, for exposure to farm animals, is OR = 0.47, again statistically significant.
This is part of Table 2 from the article. I have truncated the table at the right side; what's missing is the number of cases in each group.
|
The general conclusion from that first row of data is that exposure to dog in the first year of life leads to a small, but statistically significant, reduction in asthma at age 6. And exposure to farm animals also leads to a reduction in asthma -- a much larger reduction.
The others rows of data in the table above broadly agree with the first row. Briefly...
The second row is a re-analysis of the same data, making certain adjustments. The adjusted results are marked with a superscript "a". The results generally agree with the unadjusted analysis, though the result for dog is a little stronger. [What are the adjustments? Other factors that the authors think might be an issue, such as parental age. It is hard to know whether such adjustments are proper -- or complete. Making such adjustments can be a contentious issue.]
The rest of the table subdivides the full set of data into two groups, depending on whether or not a parent had asthma. For each of those groups, there are two rows of results, just as for the complete ("all") set discussed above. Again, the results are similar. There seems to be a somewhat larger protective effect of dog exposure if a parent has asthma.
The authors note that this may be the largest and most systematic analysis of the effect of animals on the development of asthma. It supports that there is a protective effect of exposure to animals. That's fine. The effect of dogs is small, but a 15-20% reduction in asthma in families with a history of asthma is certainly of interest. But what is that effect? What we have here is a general correlation. Does it matter what kind of dog? Long- vs short-haired? Is it the dog's microbiota that matters? Does the type of exposure (intimacy between dog and child) matter? It's even worse with the "farm animal" part of the analysis. The criterion for inclusion was that a family member is involved with handling animals, as recorded in the national database listing occupations. The authors do note that the exposure is largely cattle and sheep. Still, that's a rather broad category.
This article got news attention when it came out. The common headline was that dogs are good for children, in reducing asthma. That's not incorrect, but it certainly is incomplete. It is typical of much of the work on the hygiene hypotheses. It's an interesting idea, and there is support for it. But it remains quite unclear what is going on. And it remains unclear whether you should get your child a cow to sleep with.
News story: Early contact with dogs linked to lower risk of asthma. (Science Daily, November 2, 2015.)
The article: Early Exposure to Dogs and Farm Animals and the Risk of Childhood Asthma. (T Fall et al, JAMA Pediatrics 169:e153219, November 2, 2015.)
More on the hygiene hypothesis:
* Treating asthma with a hookworm protein? (December 2, 2016).
* Are lab mice too clean to be good models for human immunology? (May 21, 2016).
* How intestinal worms benefit the host immune system (February 27, 2016).
* Are girls too clean? (February 26, 2011).
More asthma:
* A vaccine against asthma? (July 3, 2021).
* Is Helicobacter pylori good for you or bad? (April 10, 2012). The "good" is that Helicobacter may help prevent asthma, by its effect on the immune system.
More on children and dogs, perhaps relevant to the current post: Sharing microbes within the family: kids and dogs (May 14, 2013).
More on dogs: Predicting success in training guide dogs -- role of good mothering (November 27, 2017).
Among posts on cows...
* Polled cattle -- by gene editing (July 8, 2016).
* Cows on Mars? (November 7, 2012)
* Did Lucy butcher a cow? (February 11, 2011).
November 23, 2015
Organ transplantation: from pig to human -- a status report
November 23, 2015
One source of organs for transplantation could be non-human animals. Pigs may be the best candidate as organ donor for humans: they are of similar size, and similar physiology, in that they are omnivorous. And we know how to grow them on a large scale.
Musings has noted such work before [link at the end]. We now have a nice update, as a Nature news feature. It discusses the range of difficulties that must be dealt with. Despite some technical progress, the big answer so far is that it doesn't work very well.
There has been some success with use of pig corneas, and with pancreatic islet cells that are encapsulated. These are useful steps, but not true organ transplants.
A recent advance is the improved ability to do gene editing. Tools such as CRISPR allow us to make changes to the pig genome as we wish. Of course, that doesn't tell us what the right changes are, but it does facilitate the work.
The figure summarizes some of the things being done.
It doesn't mention any of the problems, which are addressed in the article. Take the figure as a map, not a conclusion.
This is the Figure from the article.
|
Challenges remain; tools develop. Research continues. It will help us understand biology better, and perhaps someday may lead to a good source of organs. The news feature here is a useful overview and update.
News feature, which is freely available: New life for pig organs -- Gene-editing technologies have breathed life into the languishing field of xenotransplantation. (S Reardon, Nature 527:152, November 12, 2015.)
Background post: Pigs as organ donors for humans (February 16, 2010). Also see follow-up post, linked there.
New developments...
* Pig hearts can sustain life in baboons for six months (January 7, 2019).
* Long term survival of a pig heart in a baboon (April 30, 2016).
* How to do 62 things at once -- and take a step towards making a pig that is better suited as an organ donor for humans (January 17, 2016).
Also see: Using human stem cells to make chimeras in pig embryos (February 25, 2017).
More about CRISPR: CRISPR: an overview (February 15, 2015). Includes a complete list of posts on CRISPR.
There is more about replacement body parts on my page Biotechnology in the News (BITN) for Cloning and stem cells. It includes an extensive list of related Musings posts.
More about gene editing is included on my Biotechnology in the News (BITN) page Agricultural biotechnology (GM foods) and Gene therapy. It includes a list of related Musings posts.
Effect of food crops on the environment
November 20, 2015
Growing food affects the environment. It consumes resources, and leaves by-products.
A new article provides an analysis of the impact of selected crops, over a ten year period.
Here is one summary of the findings...
The figure shows the results for four US crops. The general nature of the graphs is the same for each crop,
The graphs show the environmental impact (y-axis) vs year (x-axis). Each graph covers a recent period of about ten years (though the dates are different for the different crops).
The impact is presented two ways. For each crop, the top frame is impact per hectare; the bottom frame is impact per ton. The difference, of course, reflects changes in crop yield over time.
The impact is presented on a "relative" basis, with the value for the first year taken as 1.
Results are shown for several types of environmental impact, using different colored lines. There is a key at the bottom, though it is rather cryptic; don't worry about this for now.
If you quickly scan the set of graphs, you will see that most of the lines are approximately horizontal. That is, whatever those lines show, not much changed over the time shown.
Let's note some of the bigger exceptions... The red lines for corn and cotton slope downward, with only half the impact at the end of the time period. The red lines for soybean slope upward, reaching about four times the original impact by the end.
Red lines? Red lines are for "FET": freshwater ecotoxicity. This largely reflects pesticide runoff into waters.
For the two crops showing reduced FET, the authors think that is due to increased use of GMO crops, properly managed, leading to less use of pesticides, especially the more toxic ones. For the crop showing increased impact, they note that there was a serious pest outbreak that required unusually high pesticide use.
You can easily see the effect of crop yield with the corn data. The lines slope downward a little more when plotted per ton; that is because the yield (tons/hectare) increased.
This is Figure 1 from the article. The full key for identifying the curves, from the figure legend: "ACD = acidification, EUT = eutrophication, SF = smog formation, HHR = human health respiratory, FET = freshwater ecotoxicity, HHC = human health cancer, and HHNC = human health non-cancer."
|
I think the most important point is that people are doing such analyses. They are hard to do. The authors note that they have advanced the field by emphasizing current data. They are able to see short term changes, and even explain them.
Whether their analyses and conclusions are correct is something we will learn over time. Presumably, others will do such analyses, and try to develop the methods further. Do people agree on the data? On the proper analysis? On the implications?
Such analyses have the potential to help us set targets for change, and to see how we are doing.
News story: LCA and the Dynamics of Agriculture's Environmental Impacts. (Bren School of Environmental Science & Management, University of California, Santa Barbara, October 8, 2015.) From the university.
The article, which is freely available: Changes in environmental impacts of major crops in the US. (Y Yang & S Suh, Environmental Research Letters 10:094016, September 11, 2015.) The first page is a nice overview. If you find the topic of interest, you may enjoy reading further. It's a nicely organized article, with considerable discussion of what they did, including limitations and caveats.
Another big view of pollution: Deaths from air pollution: a global view (October 23, 2015).
The article here is an example of life cycle analysis (LCA). Other LCA posts include...
* CFL and LED lights: energy-efficient, but toxic (March 3, 2013).
* Materials for solar cells (March 10, 2009).
More about pesticides... Silent Spring -- on its 50th anniversary (October 5, 2012).
More about soybean: Improving soybean oil by gene editing (January 8, 2017).
November 18, 2015
Using a smartphone as your extended brain
November 17, 2015
Modern phones give us instant access to all the world's information, it would seem. So we look up things. Things perhaps we should know, perhaps do know. Of course, the phone is a stand-in here for use of the Internet, a specific example of how we access the Internet. The broad question is, how do we use the Internet? Along the way, we might ask... Do people differ in how they use the Internet? If so, why?
A recent article offers some evidence on the matter. The general theme of the article was to explore how people use the Internet, via their smartphone. More specifically, the scientists asked whether they could correlate such usage with other characteristics of the people.
Here is an example of the results from the new article. The table is not easy reading. We'll walk through some parts of it slowly. I'll give an overview of the experiment and the results, but then focus on specific examples from the table. If you find the broad view confusing, the examples may help.
This experiment involved smartphone (SP) users. They reported their level of use, broken down into some categories, listed in the left column. The users were then grouped into low, medium or high, for each type of usage; those with the lowest 1/3 of usage level were considered "low", and so forth.
The people were given two types of tests, labeled "Cognitive Style" (left side) and "Cognitive Ability" (right side). We'll discuss what these mean later.
The table shows the average scores for people in each group. The column headings low-medium-high refer to the level of SP usage. The numbers in the table are the (average) test scores.
The column labeled ANOVA shows the result of a statistical test for that set of test scores. ANOVA values that are statistically significant are marked with one or more asterisks.
Example... Look at the first data set (upper left). It is for "overall" SP usage, and the relationship to the "cognitive style" test. People whose overall SP usage was low scored (on average) 0.44 on the cognitive style test. Those with medium overall usage scored 0.38, and those with high usage scored 0.25. The ANOVA statistic was 3.75, which is marked as significant. That is, the results show a significant correlation between overall SP usage and cognitive style score -- a negative correlation, in that higher phone usage was correlated with a lower test score.
This is the top part of Table 2 from the article. (The other parts provide similar analyses for computers users.)
|
What do we see? A useful place to start is with the asterisks that denote significance. For both tests, the results for overall SP usage and for SP search engine usage are significant. However, the results for SP usage for social media and entertainment are not. That is, whatever it is we are testing here, it relates to search engine use, not the other uses. "Search engine use" might be interpreted as using the SP for "knowledge"; perhaps it is the only one of the uses that we would interpret that way.
So, let's focus on the search engine usage. For both tests, scores decrease as SP search engine usage goes up. What are these two tests?
The cognitive ability test, on the right, is easier to explain. It is a test of one's ability to do certain things, such as some math. It is in the general vein of an IQ test. The trend of cognitive ability score vs SP search engine usage shows a correlation: people who use search engines more have lower test scores. (You just looked something up using your phone? That means you're dumb? No, not at all. We all look things up, but some people are more likely to than others. And so forth. Be cautious about interpreting all this!)
The cognitive style test, on the left, may raise some new issues. Recent decades have developed the idea that we have two broad types of thinking. One is generally described as fast and intuitive; the other as slower and analytical. Both of these are normal, and both have advantages. Of course, people vary in their propensity to use one or the other.
The cognitive style test is a measure of how analytical the person is. A higher score means that the person is more toward the side of the spectrum showing slower, more analytical thinking; a lower score means that they are more toward the side showing faster, more intuitive thinking. It would be good to avoid any connotation that one side is better than the other; they are two parts of normal human thinking.
The results for the cognitive style test suggest that those who tend to act fast-and-intuitive are more likely to use their SP search engine.
Taken together, the tests reported here suggest that people vary in how they use the Internet. We look things up, using the Internet as an extended memory. Some people do that more than others; the current work correlates that with certain features. Interesting tests.
The work opens up many questions. For example...
* Are the results reported here reproducible? It is possible that the results of such experiments vary, for various reasons including the nature of the people tested. A single experiment is a step, but not necessarily the final answer.
* What is the cause-effect relationship for the effect? Some would suggest that the presence of easy information, on the Internet, is making us less likely to think. There is nothing here that supports such a claim; the authors note that explicitly. It is just as plausible that some people are more inclined to look things up. And maybe, there is more than one reason for what is observed.
* And then there are some "big" questions... Is this good or bad? How should we be using the phone, or the Internet? These may be fun to discuss, but I really would suggest that it is premature to conclude much. It is sad to find that people think having more information available to more people is bad.
News stories:
* iPhone, Therefore I Am. (S Greenfield, Psychology Today, April 2, 2015.)
* Is your smartphone making you stupid? (Kurzweil, March 6, 2015.)
The article: The brain in your pocket: Evidence that Smartphones are used to supplant thinking. (N Barr et al, Computers in Human Behavior 48:473, July 2015.) Check Google Scholar for a copy.
Comment...
The general topic addressed here came up in discussion recently, so a note about the article caught my attention. I'm not sure what to make of all this. But if this post serves to promote some thinking or discussion about the topic, that's good. Just be cautious about jumping to conclusions.
One person responsible for raising these questions in the popular mind is the journalist Nicholas Carr. In 2008, he wrote an article for the Atlantic: Is Google Making Us Stupid? (N Carr, Atlantic, July 2008.) It's available, go have a look. The title is catchy, and gets attention. And the article raises questions. But it is important to distinguish raising questions and pretending that we have answers.
Carr later expanded the article into a book. The article usefully serves to raise the questions. The book is a long-winded elaboration; I spent much of the time with the book wondering what the point was. Some of the history is fun to read, but not important. Carr is not good at evaluating evidence, and his elaboration is unconvincing to those who think critically about evidence.
Some are using Carr's book to claim that the Internet is making us stupid. That's not justified. I wouldn't conclude much of anything from what Carr wrote, other than that there are questions. We have new tools. More people have more access to information than ever before. Why do some want to paint this as bad?
There is also a Wikipedia article on the topic, with the title of the article as its title. It tries to provide some balance of views, but is rather messy. If you browse it, you will get a sense of the debate. Don't try to make much more out of it.
A book, listed on my page of Books: Suggestions for general science reading... Kahneman, Thinking, Fast and Slow (2011). Kahneman is a key figure in developing the ideas of cognitive style, of fast and slow thinking, that are used in the analysis above. He is a psychologist -- who won the Nobel prize in economics, because his ideas have proved insightful. The book is long, but quite readable. It is an enjoyable book about how people think. If you find the topic of this post interesting, you should at least learn what Kahneman did.
Above I have criticized one book and recommended another. Why the distinction? Kahneman is a scientist, whose contributions are behind much current work in psychology. The book is a presentation to the public of what he has accomplished. In contrast, Carr is not a scientist. He is an observer of the field; he has questions and concerns, but he lacks understanding. His goal is not to present what is known, but to raise concerns. Both are valid books, but they are different. You shouldn't uncritically accept any book you read. In particular, you should distinguish whether what is being presented is broadly accepted or not.
Also see:
* Political bias in Internet access? (January 23, 2017).
* Claiming knowledge one does not have: it's particularly common with those who think they are experts (November 29, 2015).
Other posts about using smartphones include... Can you detect the SARS-2 virus with your phone? (March 2, 2021).
Could a tapeworm with cancer transmit the cancer to its human host?
November 16, 2015
You hadn't thought about that? You're not alone.
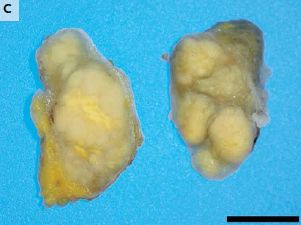
|
"Panel C shows a biopsy specimen from a cervical lymph node containing firm, solid masses." (From the figure legend in the article.) Scale bar is 1 cm.
The lymph nodes are from a 41-year-old man.
The cells in those masses are from his tapeworm.
This is Figure 1C from the article.
|
Tapeworm cancer has not been reported previously, though there is no reason it shouldn't occur.
Establishment of a tapeworm outside the usual intestinal site does occur occasionally, but that isn't what we have here. This isn't a tapeworm in the wrong place; it is a mass of tapeworm cells.
This is from a new article, which is a case report. It's typical that a case report offers unusual observations, but does not explain them.
The patient had various medical problems, including immunodeficiency. He died soon after these observations. It is not possible to connect the death to the tapeworm infection or to the tapeworm cancer.
You may know that some viruses or bacteria can cause cancers. But the cancers they cause are made of human cells; the microbe has caused the cancer by influencing human cell growth. The current case is different. The tapeworm did not cause a human tumor; the tumor consists of tapeworm cells -- which have relocated (metastasized?) to the lymph nodes.
News stories:
* Experts 'amazed' by tapeworm that spread tumors to man. (Medical Xpress, November 4, 2015.)
* Tapeworms In Humans Can Transmit Cancer Cells, CDC Discovers. (A Venosa, Medical Daily, November 5, 2015.)
The article: Malignant Transformation of Hymenolepis nana in a Human Host. (A Muehlenbachs et al, New England Journal of Medicine 373:1845, November 5, 2015.)
Movie. The journal provides a short video summary of the article. It's well done -- and even cute. It is freely available at the article site (see above), or at: Video summary: Parasite-derived cancer. (YouTube, 3 minutes, narrated.)
A recent post on cancer: Cancer metastasis: An early detection system? (October 20, 2015).
A post about a transmissible cancer: Is clam cancer contagious? (April 21, 2015). The current case is different from previous reports of cancer transmissions; it involves transmission between distantly related organisms.
And... Is clam cancer contagious? Follow-up (July 2, 2016).
My page for Biotechnology in the News (BITN) -- Other topics includes a section on Cancer. It includes a list of related posts.
Among posts on one or another kind of worm -- a term with a variety of meanings...
* Polystyrene foam for dinner? (October 19, 2015).
* Using your phone to find Loa loa (August 14, 2015).
* What did Osedax worms eat before there were whales? (May 30, 2015).
* Can memories survive if head is lost? (November 23, 2013). The worm here is from the same phylum as the current post.
Breastfeeding and obesity: the HMO and microbiome connections?
November 14, 2015
Some have suggested that there is a relationship between breastfeeding and the subsequent development of obesity in the child. However, tests of the idea have led to confusing results.
A new article tries to relate the development of obesity not simply to breastfeeding but to specific features of the breast milk. The results are intriguing, though very preliminary.
The focus is on a class of chemicals called human milk oligosaccharides (HMO). These are complex sugars (or sugar derivatives). An important feature of them is that people cannot digest them. Why does a mother put things in the breast milk that her child cannot use? The hypothesis is that they are there to feed the intestinal bacteria, the microbiome. The breast milk influences what develops in the microbiome, and that affects the subsequent development of the child.
In the new work, the scientists followed a small group of infants through age six months. They measured the growth of the children, including the amount of body fat. And they analyzed the mothers' milk for HMO.
Here is an example of the results...
|
The graph shows the relationship between body fat (y-axis) and HMO diversity (x-axis) in the breast milk at age 1 month.
You can see that the more diverse the HMO in the milk, the lower the percent body fat in the child.
This is Figure 1C from the article.
|
That's interesting. Let's go on. The next figure provides a more specific clue -- and a big caution.
|
The graph shows the relationship between body fat and the concentration of one particular HMO in the milk at age 6 months.
(The HMO is lacto-N-fucopentaose I (LNFPI). The concentrations, on the x-axis, are in micrograms/mL.)
The trend is downward: more of this particular sugar in the milk, the less fat in the baby. The regression line tests as statistically significant (with a simple test).
|
But careful... Don't just look at the line. Look at the data points. Do you really think that this set of points is best represented by a linear relationship?
This is Figure 2C from the article. (I added the Fig numbers to each figure, at upper left.)
|
I will resist trying to interpret that graph. After all, the main point is perhaps that it's not very clear what it means. The set of data is certainly not normally distributed (in the statistical sense of "normal").
The authors are quite aware of the limitations of their work here. They emphasize that the findings should be taken as preliminary, subject to further testing. That is, this small test leads them to formulate new hypotheses, such as the possible importance of this HMO, LNFPI. Don't go out to buy this stuff for your kid; the results here do not justify that. What they do justify is further work. Further work that may lead to better understanding of the connections between breast milk, the gut microbiome, and obesity.
The key advance here is to focus on specific components of the breast milk, rather than simply whether or not the infant is fed breast milk. Not all breast milk is the same.
For two of the specific HMO, there seemed to be a trend in the other direction: more of that sugar in the milk correlated with more fat. What does that mean? Is it possible that these HMO have some other benefit? Or are they "mistakes". In any case, they help emphasize the complexity of the story.
The hypotheses is that the microbiome is one factor in obesity, not the sole -- or even primary -- factor.
News stories:
* Obesity May Be Associated with Carbohydrates Found in Breast Milk. (D Semedo, Obesity News Today, November 2, 2015.)
* Factors in breast milk may play a role in transmission of obesity. (Science Daily, October 29, 2015.)
The article: Associations between human milk oligosaccharides and infant body composition in the first 6 mo of life. (T L Alderete et al, American Journal of Clinical Nutrition 102:1381, December 2015.)
A possible connection between obesity and the microbiome was made in the post: Obesity, gut bacteria, and the immune system (May 24, 2010).
More about breastfeeding: Barium, breast milk, and a Neandertal (June 17, 2013).
More about milk: Does it matter what time of day you milk the cow? (December 28, 2015).
Another example of natural sugars that may be more important for their effect on the microbiome than on their direct nutritional content: Influence of the food additive trehalose on Clostridium difficile? (February 23, 2018).
More on the microbiome...
* How a "low-gluten" diet may benefit those who are not gluten-sensitive (January 27, 2019).
* How intestinal worms benefit the host immune system (February 27, 2016).
Among many posts on obesity: Olfaction and obesity? (July 18, 2017).
My page Organic/Biochemistry Internet resources has sections on Carbohydrates and Lipids. They include a list of related Musings posts; the list in the Lipids section includes many on obesity.
How an American weed might interfere with control of malaria in Africa
November 13, 2015
Female mosquitoes need a blood meal to get the protein needed to reproduce. But that isn't all they eat. For example, they eat plant nectar, at least for energy reserves.
Here are some results...
The figure shows the survival of female mosquitoes on various food sources, over time. This is a test under lab conditions. The mosquitoes are Anopheles gambiae, a vector mosquito for malaria.
The lowest curve (yellow) is for water; the mosquitoes don't survive well.
The top curve (blue) is for glucose, i.e., a sugar solution. In context here, this is the positive control, with good survival.
In between are three curves where the food source was various plants. The results vary, but all the plants provide some survival (compared to the water).
The glucose control, of course, has no protein. Plant nectars, too, are mainly sources of sugar. This experiment is not about protein. It is about acquiring energy reserves. It is likely that it is also about the ability of the mosquitoes to survive the plant toxins.
This is Figure 1C from the article.
|
Of particular interest is that one of the better plants here is Parthenium hysterophorus. That's an American weed. An American weed that has become an invasive species in some parts of Africa.
That's "American" in the sense of the American continents, not the US. It's a tropical plant.
By the way, you don't want to eat this plant. It's quite toxic. How the mosquitoes thrive on it is not known; the mosquitoes actually seem to like this plant, feeding on it preferentially. Of course, nectar is intended for consumption by at least some insects.
These results lead to some speculation... An important part of reducing malaria is to control the mosquito vector. If an invasive plant can serve as an alternative food source for the mosquitoes, then that plant could undermine efforts to control malaria. That is, one might wonder if this American weed invading Africa could undermine malaria control there.
The speculation goes far beyond anything actually shown. That's fine. It's even good to think ahead about possible consequences. But do be careful. This is an interesting article, which raises interesting issues. Just be careful to distinguish what is fact and what is hypothesis or even speculation. Importantly, the authors argue that such possible effects on human health should be included in evaluating invasive plants.
News story: Plant Could Hinder Malaria-Control Efforts -- In the absence of a blood meal, some malaria-transmitting mosquitoes in East Africa feed on an invasive weed, scientists find. (M Waruru, The Scientist, September 30, 2015. Link is now to Internet Archive.)
The article, which is freely available: The Invasive American Weed Parthenium hysterophorus Can Negatively Impact Malaria Control in Africa. (V O Nyasembe et al, PLoS ONE 10(9):e0137836, September 14, 2015.)
A recent post about malaria: A novel drug candidate that is active against all stages of the malaria parasite (October 10, 2015).
More... Can Wolbachia reduce transmission of mosquito-borne diseases? 2. Malaria (June 17, 2016).
A recent post about mosquitoes: Why don't black African mosquitoes bite humans? (December 19, 2014).
More about invasive organisms...
* A story of dirty toes: Why invading geckos are confined to a single building on Giraglia Island (November 12, 2016).
* Pythons in Florida (February 7, 2012).
More on malaria is on my page Biotechnology in the News (BITN) -- Other topics under Malaria. It includes a listing of related Musings posts. including posts about mosquitoes.
November 11, 2015
Making use of CO2
November 10, 2015
One approach to dealing with the high level of carbon dioxide in the atmosphere is to remove it. But then what? What do we do with it? One possibility is simply to bury it; that leads to a combined process known as carbon capture and sequestration (CCS).
It is also possible that we might put it to use. CO2 is a chemical used in industry; we might take the CO2 we remove from the atmosphere, and use it. In one sense, the best use would be to convert it to fuel, something like gasoline. An advantage of making a fuel is that there is a huge market potential.
All this is logical. The problem is working out a practical economical process. In particular, it takes a lot of energy to use CO2; if we spend a lot of fossil fuel energy to use CO2, that may defeat the purpose. Many are working on the problem. There are technical successes; practical implementation is still largely for the future.
A recent news feature in Nature gave a nice overview of the field. It discusses possible uses of CO2, and the work being done towards making the use of atmospheric CO2 practical. It's worth a browse. It's a status report, not a claim of success.
The news feature, which is freely available: How to make the most of carbon dioxide -- Researchers hope to show that using the gas as a raw material could make an impact on climate change. (X Lim, Nature 526:628, October 29, 2015.)
Photosynthesis is one "natural" use for CO2, and we might stimulate that... Fertilizing the ocean may lead to reducing atmospheric CO2 (August 24, 2012).
Progress towards a valuable product... Making carbon nanotubes from captured carbon dioxide (June 3, 2018).
Another approach: Capturing CO2 -- and converting it to stone (July 11, 2016).
Also see a section of my page Internet Resources for Organic and Biochemistry on Energy resources. It includes a list of some related Musings posts.
The autism-Angelman connection: a single enzyme involved in two brain disorders
November 9, 2015
There is now good evidence that many genes play a role in autism, but how any of them work is unclear. A new article offers some understanding of how one autism gene works. As a bonus, there is a connection to another disorder of brain development.
The focus here is on a gene called UBE3A. The resulting UBE3A protein is involved in regulating brain development. The UBE3A protein occurs in two states: active and inactive. The balance between those two states is important. The article reports how the balance is controlled.
Mutations that affect the balance between the states of UBE3A are bad. But there are two ways to upset that balance: making it more active or making it less active. Mutations of both types are now known; they both cause disorders of brain development, but different disorders.
The following figure summarizes the new findings...
|
Start with row B of the figure. In cartoon form, this row shows the UBE3A protein in two states, labeled OFF and ON. At the top of those cartoon figures is a switch, which can be thrown from one side to the other. (Note that the head of the switch is in red, regardless of which side it is on. That is a bad choice of color.)
Between the two UBE3A states are two arrows. They show how the switch is thrown. An enzyme called PKA throws the switch to the left (upper arrow); an enzyme called phosphatase throws it to the right (lower arrow).
|
PKA stands for protein kinase A. It is an enzyme that adds phosphate groups to a protein. The phosphatase enzyme removes phosphate groups. That is, the switch between the two states of the protein is based on adding or removing a phosphate group.
Now look at row A of the figure. This tells the same story, but with different detail. The protein itself is represented just by its name. And then we see T485. That refers to amino acid T (threonine) at position 485 of this protein. That's where the phosphate goes. In fact, you can see the phosphate, shown as a circled P, on the left; it is absent on the right.
Row C. It starts with some DNA sequencing. It is the readout of a small part of the sequence of this gene from a person with autism. The different color peaks are for the different bases; computers deal with all this. All you need to look at is the one peak marked with an arrow. At that place, there are two peaks (one each for bases A and G, as shown below the peaks). That makes a difference. If base A is present, the protein has a threonine (T) at that position. If base G is present, the protein has amino acid A (alanine) at that position. And that matters! (The bottom row of the figure shows the amino acids.)
Amino acid T can be phosphorylated; that's because it has an -OH (alcohol) group to accept the phosphate. Amino acid A cannot be phosphorylated; it lacks an -OH group to accept the phosphate. As a result, with amino acid A the protein is only in the non-phosphorylated state -- the ON form. You can see this at the lower right. The protein now has T485A, which means that the normal T is now an A. It's in the ON position -- and the switch is broken.
The person sequenced here has one copy of a mutation that causes autism. The mutation is in gene UBE3A. The person has one normal allele, which gives amino acid T, and one mutant allele, which gives A. The latter is locked "ON", because A cannot be phosphorylated. The person will have an overactive UBE3A protein. That leads to autism. There is some understanding of what the protein UBE3A does, but the pathway from it to autism is not clear.
This is modified from the "graphical abstract" from the article. I have added the letter-labels at the left, and removed certain parts of the figure.
|
The big message here is finding how the level of active UBE3A is controlled, by adding and removing phosphate groups. Too much active UBE3A leads to autism. In the current work, that is due to a mutation that locks the protein in the active state.
In the title of this post I promised two diseases. Previous work had shown that people with a deletion of UBE3A developed Angelman syndrome, a different developmental disease of the brain. Also, people who had an extra copy of the gene developed autism. That earlier work already suggested that too much UBE3A led to one disease, whereas too little led to another. The new work adds to that by finding a switch between the two states of the normal UBE3A protein.
It follows that anything that influences the level of active UBE3A may affect brain development, in one way or another. It may affect the level of active UBE3A by affecting how much UBE3A there is, or by controlling the switch between the active and inactive states.
Among the possibilities... What if we had a drug that stimulated the PKA enzyme? That would reduce the amount of active UBE3A. It wouldn't help with the particular mutation studied here, because the switch is broken. But perhaps in other cases, it could help restore the balance between the two UBE3A states. In principle, it might act against the development of autism. That's an intriguing idea. Such drugs are known. Using them is complicated, because that PKA enzyme does many things in the body. But autism is a serious disease, and it may be worth some effort to see whether controlled use of such a drug has benefit.
There is so much more we want to know. There are many genes that may affect autism. We now understand this one better -- a little better. And we can at least imagine an approach to a therapy.
News stories:
* A Single Genetic Mutation May Cause Autism. (Neuroscience News, August 6, 2015.)
* Researchers show how specific gene change causes subtype of autism. (Autism Speaks, August 6, 2015. Now archived.) From one of the funding sources.
The article: An Autism-Linked Mutation Disables Phosphorylation Control of UBE3A. (J J Yi et al, Cell 162:795, August 13, 2015.)
A recent post about autism: Autism in a dish? (September 4, 2015).
Another mutation involving amino acids A and T: Mutations that lead to reduced risk for heart disease (November 21, 2014).
My page for Biotechnology in the News (BITN) -- Other topics includes a section on Autism. It includes a list of related Musings posts.
There is more about genomes and sequencing on my page Biotechnology in the News (BITN) - DNA and the genome. It includes an extensive list of related Musings posts.
Analysis of uranium samples from World War II Germany
November 7, 2015
A new article reports analyses of samples of uranium (U) left from World War II German labs. These are labs where German scientists were, we might presume, trying to figure out how to control the fission reaction; such control could lead to making a reactor for nuclear power, or to a bomb.
Here is an example of the results...
The table shows the amounts of two isotopes of U, expressed relative to the major isotope, 238U (or U-238, as another way to write it). The analyses were done by mass spectrometry.
Results are shown for three samples. The first two are actual samples from materials used in experiments. The third sample, Hahn YC, is a sample of "yellow-cake", a partially purified form of U.
You can see that the isotope ratios are essentially identical for all three samples. And if you look up the isotopic composition of natural U, the results here are in excellent agreement with that.
The conclusion? These samples are all natural U. They have not been enriched for U-235, the isotope needed for a fission bomb.
This is Table 1 from the article.
|
The scientists also measured the levels of two rare isotopes, one each of U and of plutonium (Pu), which are made upon bombardment with neutrons. The levels of both were at about the levels found in natural samples. In fact, for the Pu, the level was lower in the U samples than in the original ore. This reflects that the U had been purified from the ore, leaving Pu behind. Fission is triggered by neutrons. Had the samples been exposed to much neutron bombardment, the levels of these isotopes should have been high. The results suggest that the samples had not received a sustained high dose of neutrons.
World War II ended 70 years ago. We're still trying to figure out what happened -- and what might have happened. This article makes a small contribution to figuring out World War II.
In other tests, the scientists were able to authenticate the date of the materials, and to determine the likely source of the ore from which the U was extracted.
News story: Forensic investigation of uranium from German nuclear projects from the 1940s. (M Wallenius, Phys.org, September 16, 2015.) If this is labeled right, the news story was provided by the head of the research team, who is also an author on the article.
The article: Uranium from German Nuclear Power Projects of the 1940s -- A Nuclear Forensic Investigation. (K Mayer et al, Angewandte Chemie International Edition 54:13452, November 2, 2015.)
More uranium:
* Role of biological processing in the formation of a uranium ore (June 30, 2017).
* File dates and human settlement in Polynesia (November 16, 2012).
More about measuring fission products: Berkeley RadWatch: Radiation in the environment -- Follow-up (May 6, 2014).
More about atomic bombs: Atomic bombs and growing new brain cells (November 1, 2013).
More from World War II: Alan Turing, computable numbers, and the Turing machine (June 23, 2012).
Also see: A better way to oxidize americium? A step toward improved processing of nuclear reactor waste? (December 7, 2015).
My page Internet resources: Miscellaneous contains a section on Science: history. It includes a list of related Musings posts.
My page of Introductory Chemistry Internet resources includes a section on Nucleosynthesis; astrochemistry; nuclear energy; radioactivity. It includes a list of related Musings posts.
This post is also listed there in the section Lanthanoids and actinoids.
An artificial neuron?
November 6, 2015
Imagine a device that senses a chemical signal at one end, transmits an electrical signal to the other end, thereby triggering the release of a chemical. A biologist might recognize that as a neuron. However, the device that prompts this post is artificial; it is presented as an artificial neuron.
Here is the idea...
|
The upper part of the figure is a diagram of a neuron.
At the left, it receives chemical signals, shown by orange dots.
The signal is transmitted to the other end of the neuron electrically, where it leads to release of a chemical. The released chemicals are shown by blue dots.
|
The lower part of the figure is a diagram of the device the scientists have made. As you can see from how the figure is organized, the device does the same basic things.
Glutamate (Glu) and acetylcholine (ACh) are natural neurotransmitters used in this work. Released chemicals may include hydrogen ions (H+) or more acetylcholine.
This is Figure 1 from the article.
|
The article includes results showing that addition of neurotransmitters to the sensor end of the device leads to release of action chemicals from the other end. Unfortunately, the presentation of the results is hard to follow, so we'll leave the details. I do suggest you check out the movie files listed below.
The basic claim is that they have made an artificial neuron: an artificial device that mimics what a neuron does. They have established the principle. For the future, the scientists hope it can be simplified and miniaturized; the ultimate goal is to use it as a transplant, a replacement neuron providing neuron function in an animal -- including human.
News story: Swedish scientists create an artificial neuron that mimicks an organic one. (Kurzweil, June 29, 2015.)
Movie: Swedish scientists create an artificial neuron that mimicks an organic one. (YouTube, 3 minutes, narrated.) A presentation by the scientists, with some demonstration of the device. As with the article itself, it is not very clear, but give it a try for the ideas.
There are also two movie files posted as supplementary materials with the article at the journal web site. They are a half minute each, no sound. If you can get to them, try Movie #2. Be prepared to go through it multiple times, but it does end up making sense. Watch [Glu] carefully; that is the concentration of glutamate, which is added. It changes from 20 µM to 80 µM, but it happens so fast you may not notice at first.
- OEIP = organic electronic ion pump.
- OEBN = organic electronic biomimetic neuron.
- OEAN (in the movie files)? It's not in the article, but I would bet it means organic electronic artificial neuron.
The article: An organic electronic biomimetic neuron enables auto-regulated neuromodulation. (D T Simon et al, Biosensors and Bioelectronics 71:359, September 15, 2015.) Check Google Scholar for a pdf from the authors. Caution... This is a difficult paper. The idea is good, and the general organization is ok, but the details are hard to follow.
A recent post about the nervous system: How much would it cost to make a brain? (November 1, 2015).
More about glutamate as a neurotransmitter: Novelty-seeking behavior (May 26, 2012).
... and acetylcholine: A bio-marker for SIDS? (June 27, 2022).
My page for Biotechnology in the News (BITN) -- Other topics includes a section on Brain (autism, schizophrenia). It includes an extensive list of brain-related Musings posts.
November 4, 2015
How the MERS virus spread in Korea: role of super-spreaders
November 3, 2015
The outbreak of Middle East respiratory syndrome coronavirus (MERS-CoV, or MERS for short) on the Arabian peninsula continues. There have been about 1600 cases worldwide, with 3/4 of them in Saudi Arabia. The death rate is about 35%.
In May, the virus took a plane trip to the Republic of Korea (South Korea), starting a MERS outbreak there. Over two months there were 186 cases. That's the second largest country total, and the only substantial number outside the Arabian peninsula area. The Korean outbreak had 37 deaths.
A new article details the Korean MERS outbreak. It contains more than any casual reader would want to know, but the first point is simply to note how well the disease was tracked, to produce this data set. MERS is a new virus, poorly understood. The kind of information recorded here is useful in understanding disease spread.
The following figure shows one of the simplest analyses: when and where the cases appeared.
The graph is a tally sheet, showing the date each MERS patient first showed symptoms.
The colors show where the person became infected; see the key at the upper right. The first patient, the index case or patient #1, first showed symptoms on May 11. You can then see waves of infection at three hospitals (yellow, green, purple). There are fairly small numbers of cases marked "other" (gray); most of these are from other health-care facilities.
This is Figure 1A from the article. I added the month labels on the x-axis.
|
It's the most basic description of the outbreak: a record of when and where the cases arose. You can already see that most of the transmission occurred within the health-care system. "The majority (98%) of patients were infected with MERS-CoV in healthcare facilities." (p 272 of the article.)
If you'd like a bit more... Transmission pattern (Figure 4) [link opens in new window]. This figure shows the chain of transmission. It is based on the above figure, plus additional information about the cases. You may not want to spend much time with this; simply recognizing that it exists is good.
But I do note... From the figure above, one might guess that the index patient went to hospital C. It turns out that things were more complex, as seen on the linked figure here. He went to hospitals A & B, then to C. Hospitals A & B were the source of only two infections; C was a hotspot.
The red circles show patients who spread the disease. The number in the circle is the patient number. You can see that Hospital C not only was a hotspot, but a source of five patients who spread the disease further.
Of particular note is the role of a small number of people who transmitted a large fraction of the cases. These people are termed super-spreaders. One patient transmitted 85 cases, nearly half of the total. The five leading transmitters were responsible for 153 of the cases (83%).
One of the super-spreaders was the index patient, #1, the man who brought the virus to Korea. He transmitted 28 cases. But he was also special: it was nine days after he first showed symptoms that he was properly diagnosed. During that interval, he was in contact with several hundred people, many of them hospital staff. That is, this person was exposing people, including health-care workers, even before anyone was aware that MERS existed in the country.
The initial phase of an outbreak is a special challenge. Not only are undiagnosed people around, possibly spreading the disease, but the presence of the disease at all is not yet recognized. What level of infection control should a hospital take to deal with unknown diseases?
The authors look for characteristics that might define a super-spreader. It's not clear. In fact, it is hard to know for sure whether being a super-spreader is a characteristic of a patient per se or of the environment they happen to be in.
One cannot help but think of the Ebola outbreak while reading this article. Among the similarities... the importance of transmission in health-care settings, and the importance of tracing contacts as part of disease control. Of course, contact tracing was much easier for this modest size outbreak in a society with excellent health-care.
Perhaps the main point of this post is a little insight into how a disease, a new disease, is tracked. And it reminds us of the challenge.
News stories:
* 83% of Korean MERS cases stemmed from 5 patients. (Korea Herald, October 25, 2015.)
* Korea highlights MERS super-spreaders, reports death. (J Wappes, CIDRAP, October 26, 2015.)
The article, which is freely available: Middle East Respiratory Syndrome Coronavirus Outbreak in the Republic of Korea, 2015. (Korea Centers for Disease Control and Prevention, Osong Public Health and Research Perspectives 6:269, August 2015.) The journal is from the Korean agency, and the article is published with the agency name as author. (There is a list of "authors and KCDC EIS officers who contributed to this article" in the Acknowledgments. EIS? Epidemic Intelligence Service.)
* Previous post about MERS:
Camels and the transmission of MERS: blame the kids? (March 30, 2015).
* Next: A MERS vaccine, for camels (January 22, 2016).
There is more about MERS on my page Biotechnology in the News (BITN) -- Other topics in the section SARS, MERS (coronaviruses). It includes links to good sources of information and news, as well as to related Musings posts.
The importance of identifying contacts or even possible contacts... An Ebola vaccine: 100% effective? (August 7, 2015).
Life on Earth 4.1 billion years ago?
November 2, 2015
A big news story recently... new evidence that pushes the discovery of life on Earth back 300 million years earlier than previously thought. What's behind this fascinating claim? Hint... It's an interesting story, but don't make much of any conclusions from it.
The following graph shows the carbon isotopes found in some ancient rocks.
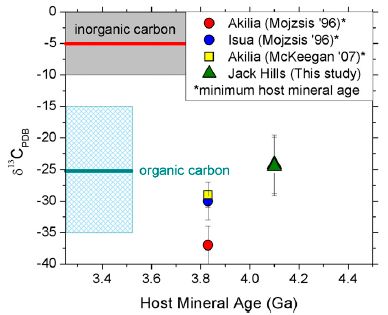
|
The x-axis shows the age of the rock samples -- in billions of years.
Simply having such ancient rocks is a story in itself, but it is not our story here. What matters here is that the rocks contain traces of carbon. The scientists measure the ratio of carbon isotopes in the sample.
The y-axis scale relates to the ratio of two isotopes of carbon, C-13 and C-12. Shaded regions at the left show typical ranges for inorganic and organic C.
|
The new work involves a single rock, the one labeled Jack Hills and marked by a green triangle. It's about 4.1 billion years old; its carbon isotope ratio is more like organic C than like inorganic C.
The other rocks shown are from earlier work.
To get the y-axis number... Find the ratio of the two isotopes in a standard reference material. Then find that ratio in your sample. The scale shows how different the ratio is in your sample compared to the reference. The numbers are parts per thousand. The negative values mean that the sample has less C-13 than does the reference.
The actual numbers aren't important; they depend on what is used for the reference. The differences -- the "delta" (δ) values -- are important. Organic carbon typically contains less C-13 than inorganic carbon. That's the basis of the evidence here.
This work uses the two stable isotopes, C-12 and C-13. It has nothing to do with the radioactive isotope C-14, which has far too short a lifetime to be relevant in this type of work.
It is possible that the carbon in a rock being measured is older than the rock sample; it is unlikely that it is younger (because it is thought that the C must have been included in the rock when it formed).
This is Figure 2 from the article.
|
That's it.
A sample of rock dated as 4.1 billion years old. It contains some carbon. The isotopes found in that C are more like what is found in organic material than in inorganic material. It's a spectacular technical development.
Does that mean that this rock contains evidence for life 4.1 billion years ago? The problem is that there are other possible explanations for the low content of C-13. Biology is one possibility, non-biology processes are also possible. The authors note some examples. In fact, the authors are careful to say that their analysis allows the possibility that the sample is biological, but does not prove it. Of course, that caution gets lost in the news media.
As the figure shows, there are other old samples with low C-13. Whether these are biological or not is also subject to debate. The new finding adds to our collection of old samples of low C-13 content, hence of possible biological origin. But the interpretation of these samples is largely speculation at this point.
News stories:
* Scientists may have found the earliest evidence of life on Earth. (J Rosen, Science magazine news, October 19, 2015.)
* 4.1 Billion Year Old Australian Zircon Contains Graphite of Biological Origin, Study Claims. (Sci.News, October 20, 2015.) Contains a beautiful picture of the "rock" sample of interest; it is Fig 1 of the article.
The article, which is freely available: Potentially biogenic carbon preserved in a 4.1 billion-year-old zircon. (E A Bell et al, PNAS 112:14518, November 24, 2015.)
More on the origin of life: Is it possible that asteroids helped provide the energy needed to get life started on Earth? (January 26, 2015).
An earlier post that notes that C-13 is low in biological materials: Discovery of a chemical of biological origin from Mars? (January 2, 2015).
More C-13... Lightning and nuclear reactions? (January 28, 2018).
My page of Introductory Chemistry Internet resources includes a section on Nuclei; Isotopes; Atomic weights. It includes a list of related Musings posts.
How much would it cost to make a brain?
November 1, 2015
Twenty five cents. (0.25 USD.) So says the senior author of a new article.
These are mini-brains, little blobs of tissue a millimeter or so in diameter. They show many normal brain activities; for example, they form synapses, and transmit electrical signals. The news stories emphasize that these brains do not show cognitive function. (But I must wonder... it is not obvious that any such test was done.)
What are they good for? Drug testing would be one use. These mini-brains are cheap and easy to make, and they last for a month or so. They would be well suited for testing the effect of drug candidates on brain activity.
How does one make such a mini-brain? Take a rat brain, dissociate the cells, and let them reform in a dish into small aggregates, or "neural spheroids".
For those who really want the economics... The cost number, 25 cents per brain, is not in the article itself. It does come from the author, and is noted in the news stories. It includes the cost of making the new brains, but not the general fixed costs of the lab.
It's an interesting approach. What may be particularly important is to notice the diversity of types of mini-brains that are appearing. There may be many ways to make a brain, with different ones suited for different uses. Learning how to make and use mini-brains is part of developing our understanding of the brain.
News stories, both with good overviews of the work:
* How to Make a Mini Brain. (Neuroscience News, October 1, 2015.)
* How to grow a functional 3-D mini-brain for 25 cents. (Kurzweil, October 2, 2015.)
The article: Three-Dimensional Neural Spheroid Culture: An In Vitro Model for Cortical Studies. (Y-T L Dingle et al, Tissue Engineering Part C: Methods 21:1274, December 2015.)
A recent post on mini-brains, but a very different type: Autism in a dish? (September 4, 2015). The mini-brains discussed here are made from stem cells: in this case, special stem cells from individual patients of a specific disease.
More on nervous systems: An artificial neuron? (November 6, 2015).
More organoids (and such):
* Multi-organ lab "chips" (April 14, 2018).
* An organoid for the gut: at last, a culture system for norovirus (October 30, 2016).
More inexpensive things: Making better artificial muscles (March 13, 2018).
My page for Biotechnology in the News (BITN) -- Other topics includes a section on Brain (autism, schizophrenia). It includes an extensive list of brain-related Musings posts.
Making chemistry easier: single-serving capsules
October 30, 2015
Some chemicals are hard to handle. For example, some chemicals are sensitive to air, and must be weighed out in a special chamber or "glove box". Regular use of such chemicals is time-consuming, and a nuisance.
There's gotta be a better way.
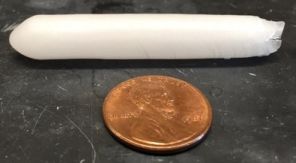
|
A capsule, coated with paraffin wax.
The capsule contains chemicals that have been pre-packaged. The capsule is added to a reaction vessel, which is heated. The paraffin coating melts; the chemicals inside are released. (The paraffin itself is inert.)
The capsule is shown here next to a US penny (2 cm diameter).
This is trimmed from the figure in the Science Daily news story.
|
The chemicals still have to be weighed out with care (in the air-free glove box, for example). But it is more efficient to spend a block of time to weigh out many portions and package them than it is to do it each time as needed. Capsules may contain more than one chemical, if appropriate to the application. The capsules themselves are easily stored, and are stable for many months. Using them requires little special care. (The details will vary depending on the materials being prepared.)
It's so simple! But it is apparently novel, as reported in a recent article in a prestige journal. An article with the primary intent to make life a little easier for chemists.
News story: Researchers pioneer use of capsules to save materials, streamline chemical reactions. (Science Daily, August 12, 2015.)
* News story accompanying the article: Organic chemistry: A cure for catalyst poisoning. (M E Farmer & P S Baran, Nature 524:164, August 13, 2015.)
* The article: Dosage delivery of sensitive reagents enables glove-box-free synthesis. (A C Sather et al, Nature 524:208, August 13, 2015.)
Among other posts on capsules...
* Golden rice as a source of vitamin A: a clinical trial and a controversy (November 2, 2012). Use of capsules to deliver vitamins.
* Hyperloop: Ground transportation at near the speed of sound (August 19, 2013). Use of capsules to deliver people.
October 28, 2015
Most Earth-like (habitable) planets haven't formed yet
October 27, 2015
We are in an era of discovering exo-planets -- the first known planets beyond our Solar System. A particular interest is finding planets that might host life, so-called habitable or Earth-like planets.
A new article says that this may be a bad time to look for such planets. Most haven't formed yet.
The article builds on our improved understanding of the universe, much of it based on the observations by the Hubble Space Telescope, plus the Kepler mission for finding exoplanets. Importantly, there is now good evidence for vast dust clouds in the universe. Inevitably, these will condense -- forming new stars and their planetary systems, including habitable planets. The authors model all this, and suggest that 92% of the ultimate set of habitable planets have not yet formed.
That conclusion is different from one in an earlier Musings post [link at the end]. That post focused on the point that the rate of star formation had slowed down; astronomers agree on that point. But the authors of the previous work did not consider the magnitude of the remaining dust. They concluded that most stars (and therefore most planets) that would ever form had done so. The new article suggests that there is enough dust left to support continuing star formation for a very long time -- perhaps a trillion years. The rate of star formation will be very slow, but the time scale is huge; as a result, the authors of the new work suggest that most stars and their planetary systems belong to the future.
It's fun. It's another step in our understanding of the universe. We'll see how others react to the new model. Of course, it is testable, though the time scale will make it a challenge.
News story: Theoretical Study Suggests Most Earth-Like Worlds Have Yet to Be Born. (SciTech Daily, October 20, 2015.)
The article, which is freely available: On the history and future of cosmic planet formation. (P Behroozi & M S Peeples, Monthly Notices of the Royal Astronomical Society 454:1811, December 2015.)
The American journalist Lincoln Steffens said something along the line... The greatest painting has not yet been painted; the greatest poem is still unsung. To that we now add... The most habitable planet has not yet formed.
The statement from Steffens comes in various forms. One is at Bartleby's: Steffens quote. It's intended as a statement of optimism about the future. I remember it well; it was at the heart of a speech I gave in 8th grade.
Background post about star formation: Star formation has slowed down (December 4, 2012).
Exoplanets... Habitable Exoplanets Catalog (July 27, 2012). The catalog fails to list those not yet found -- and those not yet formed.
And... GJ 1132b: "the most important planet ever found..." (December 18, 2015).
More from the Hubble: Europa is leaking (February 10, 2014).
A smart insulin patch that rapidly responds to glucose level
October 26, 2015
A recent article reports a new approach to delivering insulin "as needed" to diabetics, based on an instantaneous measurement of glucose level.
The heart of the procedure is a glucose-responsive vesicle (GRV). The GRV is designed to fall apart when the glucose level is high; it then delivers its content of insulin.
The following figure outlines the procedure...
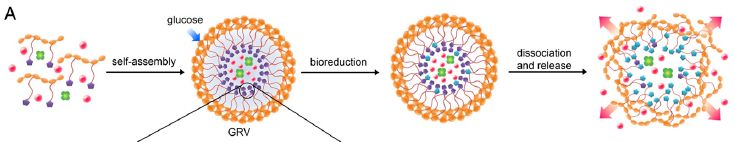
The first frame (left) shows the pieces. The details of this need not concern us here.
The second frame shows a vesicle, and is labeled GRV. The first important point is that the GRV forms spontaneously from the pieces shown at the left. (Ignore the black lines coming out.)
A vesicle is about 0.1 micrometer in diameter.
Notice two components of the GRV... One is insulin, shown by red dots. The other is an enzyme, glucose oxidase (GOX), shown by green box-like symbols. They are both in an inner compartment, marked here by rings of purple dots.
That frame also shows glucose entering the vesicle.
What happens when glucose enters the vesicle? The enzyme GOX oxidizes the glucose. In doing so, it uses up the oxygen in the vesicle. That loss of oxygen causes another component of the vesicle to degrade. The vesicle falls apart, and the insulin is released. That is, high glucose is coupled to insulin release via the loss of O2 in the vesicle; that is the novel feature of this approach.
The degradation is shown in two steps, in the last two frames of the figure. Look carefully at the inner circular structure in the third frame; it has changed from the second frame. Some of the purple dots shown in the second frame have changed to blue dots. That is due to a chemical change of the structure caused by loss of oxygen.
The arrow from the 2nd to 3rd frames is labeled bioreduction. That's a little confusing. The enzyme GOX oxidizes the entering sugar. The resulting loss of oxygen causes the internal compartment of the vesicle to be reduced, by other enzymes, to an unstable structure.
The final frame (right) shows the GRV falling apart, releasing its insulin.
This is Figure 1A from the article.
|
What is shown above is an individual vesicle. In use, vesicles are part of a patch, which contacts the skin with microneedles. In tests with mice, the patch successfully delivered insulin in response to elevated glucose levels. The authors suggest that it is more responsive than currently available alternatives.
Considerable effort went into the design, so that it assembles efficiently, and is tuned to degrade at an appropriate glucose level. But once designed, it is simple and easy to make. The authors now plan to test the device in a more human-like animal, the pig.
News stories:
* Smart Insulin Patch -- A microneedle patch automatically releases insulin in response to high glucose levels. (A B Keener, The Scientist, June 22, 2015. Link is now to Internet Archive.) Includes a discussion of some limitations of the device at this point.
* Smart Insulin Patch Could Replace Painful Injections for Diabetes. (NC State News. June 23, 2015.) From the lead institution.
The article: Microneedle-array patches loaded with hypoxia-sensitive vesicles provide fast glucose-responsive insulin delivery. (J Yu et al, PNAS 112:8260, July 7, 2015.)
Other posts on diabetes or insulin include...
* Treatment of Type 1 diabetes with encapsulated insulin-producing cells derived from stem cells (March 11, 2016).
* Insulin as a treatment for Alzheimer's disease? (January 28, 2012).
* What color is your rice? Rice, diabetes, and arsenic. (December 12, 2010).
More on diabetes is on my page Biotechnology in the News (BITN) -- Other topics under Diabetes. That includes a list of related Musings posts.
Another example of a delivery system using a skin patch and "microneedles": A better way to deliver a vaccine? (July 25, 2010).
More microneedles: Treating a heart attack using a microneedle patch (January 11, 2019).
More on glucose oxidase:
* Engineering a worm to treat cancer (July 23, 2022).
* Why are the bees dying? (January 26, 2010).
More hypoxia: Bigger spleens for a bigger oxygen supply in Sea Nomad people with unusual ability to hold their breath (July 2, 2018).
More monitoring: Electronic monitoring of plant health; it might even allow an injured plant to call a doctor (June 21, 2020).
Chernobyl exclusion zone: mammal populations
October 24, 2015
More from Chernobyl. A new article provides new data on the habitability of the region around the Chernobyl nuclear accident. It's interesting. And it's easily misinterpreted.
The scientists tracked the populations of various mammals (elk, boar, wolves, hares and others) in the "exclusion zone" around the accident site and compared them to nearby uncontaminated regions. The basic finding is that the populations of mammals are not significantly different in the exclusion zone. (In one case, the population is much higher in the exclusion zone, perhaps due to the absence of humans.) Some of their data suggests that animals returned to the exclusion zone within a year after the accident.
Comment...
That's fine. The question is what it means. The elk don't read the signs. People would probably move into the area if they needed some space and didn't see the signs. It's worse than that... We don't know how much time these animals are spending in the exclusion zone; dose of radiation depends on exposure time as level as well as the level. Further, we don't know whether the animals are suffering any consequences from their time in the exclusion zone.
A previous post was about birds in the Chernobyl area. The authors of that work studied the physiology of the birds, and showed that they had signs of oxidative stress. The birds were in the area, and they had adapted to the radiation -- at a cost. We don't know how well this will work in the long run, but at least it offers some understanding of what the animals are doing. [Link at the end.]
The new article presents useful data. It is good that the authors have collected all this, and published it. But the article spends most of its space trying to establish that all is well. It makes only the briefest mention that there might be limitations to the significance.
My comments are not intended as a judgment about whether it is safe to be in the Chernobyl area. That's not a simple matter. That animals seem at home in the area does not vouch for its safety. My comments also are not intended as any claim of error in the article. It's that the way the work is presented is subject to misinterpretation -- as evidenced by the news coverage listed below.
News stories:
* Researchers Discover Abundant Populations of Wildlife in Chernobyl Exclusion Zone. (Sci.News, October 6, 2015.)
* Chernobyl has become an unlikely wildlife haven. (S DeWeerdt, Conservation, October 6, 2015. Now archived.)
The article, which is freely available: Long-term census data reveal abundant wildlife populations at Chernobyl. (T G Deryabina et al, Current Biology 25:R824, October 5, 2015.) It's a 2-page paper. Go look if you'd like to see some data.
Background post about animals at Chernobyl: Are birds adapting to the radiation at Chernobyl? (August 3, 2014).
More about Chernobyl: Effect of Chernobyl exposure on the rate of new mutations in the next generation (June 1, 2021).
More about wildlife... Human-wildlife conflict -- what is the proper way to get rid of a pest? (July 12, 2017).
My page of Introductory Chemistry Internet resources includes a section on Nucleosynthesis; astrochemistry; nuclear energy; radioactivity. That section contains some resources on the effects of radiation. It also includes a list of related Musings posts.
Deaths from air pollution: a global view
October 23, 2015
The following map summarizes the effect of air pollution on the human population, as presented in a new article.
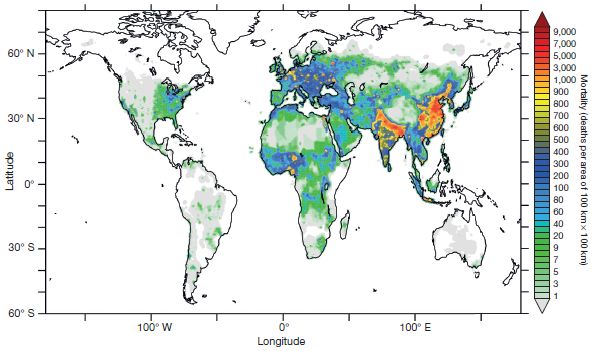
Regions on the map are color-coded by the number of excess deaths caused by air pollution, per year for a defined area. White means none, and brighter colors mean more deaths; see the color key at the right (but don't get bogged down with the numbers).
The result -- number of deaths -- comes from a combination of the air pollution level and the population density. Emphasize that the map, and all the analysis here, is about the effect of air pollution, not the level of pollution per se.
The total number of such deaths over the world is currently about 3 million per pear; it is expected to double by the year 2050, if things continue.
What is that number in the big picture? One might make a zero-order estimate that 1% of the population dies each year. That would be about 70 million. Thus the deaths due to air pollution are a small but significant fraction.
This is Figure 1 from the article.
|
The figure is part of a new article that tries to develop a global overview of the effect of air pollution.
The article goes on to identify the sources of the air pollution that is causing mortality. The authors classify sources as: industry, land traffic, residential and commercial energy use (such as heating, cooking), biomass burning, power generation, agriculture, and natural (such as desert dust).
On a world-wide basis, residential energy use is the greatest source of pollution-induced mortality. This source is dominated by home cooking and heating, based on burning things -- with small inefficient fires.
Looking at a smaller scale shows interesting differences. If one looks at the six countries with the largest number of pollution-induced deaths... in three, residential energy is the largest pollution source; in two, the largest source is "natural"; and in one, the largest source is agricultural. Table 2 of the article shows such analysis for the 15 countries with the largest number of pollution-induced deaths. In one (the US), energy generation is the largest source. (And in California, traffic is the largest source.) The map in Figure 2 of the article shows an even finer-level analysis. It presents a world map showing the mortality caused by air pollution, coded by the pollution source, in different places. For example, if I follow the map correctly, four different sources are #1 at various places around the US.
Industry? It is a significant player, especially in industrialized countries. However, it's not a leading contributor. (It's second in one country on the top-15 list.) Presumably, recent efforts to reduce industrial pollution in many industrialized countries have helped to lower its position. The article does not minimize industry, but rather notes the diversity of sources.
Even with the regional maps, this is a big-picture analysis. It raises many questions, as emphasized by the authors. For example, a central question is: which pollutants matter? They include two here, small particulates and ozone. They are concerned whether all particulates are equally bad, and include one alternative analysis that assumes otherwise. They also discuss the quality of the data sources they used -- and note that some aren't very good.
The article is of interest as an attempt to get a big picture view of the effects of air pollution. That's why they look at deaths from air pollution, rather than just the level of pollution. Pollution in areas of high population density is more important than pollution where few are affected. The article leads to suggestions about how efforts to reduce pollution should be focused. There is more to be done... Others may analyze the data with different goals, and better data is always welcome.
News story: More deaths due to air pollution -- Air pollution could claim 6.6 million lives by 2050. (Max Planck Institute for Chemistry, Mainz, September 16, 2015.) From the lead institution; a good overview of the work. (That 6.6 million number is per year.)
* News story accompanying the article: Atmospheric science: The death toll from air-pollution sources. (M Jerrett, Nature 525:330, September 17, 2015.)
* The article: The contribution of outdoor air pollution sources to premature mortality on a global scale. (J Lelieveld et al, Nature 525:367, September 17, 2015.) Check Google Scholar for a copy.
More on air pollution...
* Indoor air pollution: is ventilation effective? (March 24, 2020).
* Diesel emissions: how are we doing at cleaning up? (July 30, 2017).
* Electric cars and pollution (April 5, 2011).
More on pollution...
* A world atlas of darkness (July 29, 2016).
* Effect of food crops on the environment (November 20, 2015).
* Effect of artificial lighting on the environment (September 3, 2015).
Also see a section of my page Internet Resources for Organic and Biochemistry on Energy resources. It includes a list of some related Musings posts.
October 21, 2015
Cancer metastasis: An early detection system?
October 20, 2015
Metastasis -- the transfer of a cancer to new sites -- is probably responsible for the most cancer deaths. It is now relatively easy to remove a primary tumor, but if a few cancer cells are left, they can establish multiple secondary tumors at other sites. Much attention nowadays is devoted to studying metastasis.
In recent years, scientists have come to realize that cancer cells can be found in the blood stream. These circulating tumor cells (CTC) reflect an early step of the metastatic process. These cells are present at very low levels; scientists are just learning how to find them. Work on CTC is an emerging area of active work, but it is not clear where it will lead.
A new article reports an intriguing development. The scientists implant a small sponge-like scaffold in mice with cancer. The scaffold attracts and collects CTC.
Here are some results...
The table shows the frequency at which metastatic cells were found at various sites, at two time points.
The sites include two body organs, plus the implanted scaffold. In this case, the scaffold was "IP" (intraperitoneal).
At the first time point (14 days), metastatic cells were found in the scaffold for most of the animals, but not in the body organs for any animal. At the second time point (28 days), the scaffold was still "better" than one of the organs tested.
This is Figure 3a from the article.
|
How does this thing work? Apparently, the immune system notices it, and treats it as a foreign body. With an immune horde around it, it becomes an attractor for cancer cells. The authors think that invasion of the scaffold is actually analogous to the establishment of a metastatic lesion.
It's intriguing. It's also early -- as usual for novel discoveries. This is a single type of test, with mice. Would it work in humans? For what cancers and under what conditions? We'll see.
Why might this be useful, if it pans out? First, it is an early detection system. If a person has been treated for cancer, and is likely at risk for metastasis, the device could be implanted and checked at intervals for early signs that the metastatic process is underway. Second, it might actually reduce metastases -- by the simple act of removing metastatic cells. The importance of this point is more speculative for now.
News story: New Device Prevents Breast Cancer Metastasis In Mice. (A Venosa, Medical Daily, September 9 2015.) Caution... hyped title.
The article: In vivo capture and label-free detection of early metastatic cells. (S M Azarin et al, Nature Communications 6:8094, September 8, 2015.)
Previous post on cancer -- and indeed on metastasis: Anti-oxidants and cancer? (October 18, 2015).
Next: Could a tapeworm with cancer transmit the cancer to its human host? (November 16, 2015).
More on metastasis: Metastasis: How clusters of tumor cells get through narrow capillaries (June 3, 2016).
Another sponge... A sponge that will soak up phosphate pollution from water (August 14, 2021).
My page for Biotechnology in the News (BITN) -- Other topics includes a section on Cancer. It includes a list of related posts.
Polystyrene foam for dinner?
October 19, 2015
Not as packaging, but as the main course.
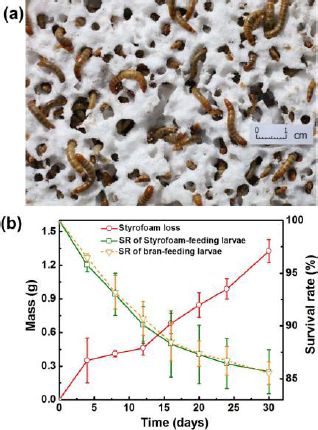
|
Part a (top) shows beetle larvae known as mealworms on a piece of polystyrene foam.
Part b (bottom) shows some data...
The red curve (the one trending upward, with scale on the left) shows the degradation of the polystyrene foam over time. You can see that the foam is degraded at a more or less constant rate. (At 30 days, about 30% of the foam was gone.)
The other two curves (trending downwards, with scale on the right) show the survival of the mealworms, on two diets. One is the polystyrene; the other is their conventional "bran" diet.
This is Figure 1 from article #1. Part a seems to be included with every news story about this work.
|
Plastics such as polystyrene have become symbols of our modern wasteful society. They are synthetic chemicals, and not biodegradable -- and not even easily recycled. They pile up, in landfills or in globs in the ocean. However, the figure above offers evidence that polystyrene can be biodegraded. This comes from the first of a pair of new articles, which we will consider together.
The general message from the figure, and from article 1 overall, is that mealworms will eat polystyrene foam. The survival curves shown above are the same for both diets; that is an odd way to show how well the worms are doing, but at least it is a start.
How do the worms eat the plastic? The same way termites and cows eat "undigestible" cellulose. They use microbes. Article 2 goes on to isolate bacteria that digest polystyrene.
The bacteria don't do as well as the worms do. This suggests there is more to the story. There may be a consortium of microbes in the worm gut that, collectively, digest the plastic. Or perhaps there is something about the environment of the gut that promotes plastic digestion.
Together, these two articles show that an animal, with the aid of gut microbes, can digest a plastic commonly considered to be non-biodegradable. Is this useful? It might be, but it is too early to say. These articles are the first steps.
News stories:
* Common Mealworms Can Live on Diet of Polystyrene, Scientists Say. (Sci.News, October 1, 2015.) This seems to be short version of the following story.
* Plastic-eating worms may offer solution to mounting waste, Stanford researchers discover. (R Jordan, Stanford News, September 29, 2015. Now archived.) From one of the institutions involved. (The work is largely from institutions in China.)
There are two articles:
1) Biodegradation and Mineralization of Polystyrene by Plastic-Eating Mealworms: Part 1. Chemical and Physical Characterization and Isotopic Tests. (Y Yang et al, Environmental Science and Technology 49:12080, October 20, 2015.)
2) Biodegradation and Mineralization of Polystyrene by Plastic-Eating Mealworms: Part 2. Role of Gut Microorganisms. (Y Yang et al, Environmental Science and Technology 49:12087, October 20, 2015.)
Other posts about the biodegradability of plastics...
* What if the caterpillars ate through the plastic grocery bag you put them in? (May 26, 2017).
* Discovery of bacteria that degrade PET plastic (April 3, 2016).
* Degradable polyethylene isn't (October 17, 2011). The lab reporting the current work has recently reported microbial degradation of polyethylene. I haven't seen that work. How that work and the post linked here get reconciled is open for now.
More biodegradability... A biodegradable agent for herding oil slicks (September 18, 2015).
A post about the chemical used to make polystyrene: A simpler way to make styrene (July 10, 2015).
A post about a microbe that grows on methane: The miracle of Methylomirabilis (May 10, 2010). Methane is simple and abundant in nature, so it is not surprising that some bacteria can grow on it. Most microbes that can grow on methane cannot use more complex hydrocarbons. Nevertheless, the methanotrophs establish that bacteria can use hydrocarbons. Metabolism of heavier hydrocarbons is known, but is less common.
Among many posts on beetles...
* How to preserve dead mice so they stay fresh and edible (January 18, 2019).
* How to fly a beetle (April 27, 2015).
Other recent dinner stories include...
* The advantage of menopause: grandma knows where dinner is (June 15, 2015).
* How the price of oil might affect what seals eat for dinner (January 18, 2015).
More worms... Could a tapeworm with cancer transmit the cancer to its human host? (November 16, 2015).
This post is noted on my page Unusual microbes.
Anti-oxidants and cancer?
October 18, 2015
Oxygen is a very reactive chemical, which we use to burn our food. Some of the possible intermediates formed during oxygen use are even more reactive. These species, such as the superoxide ion, O2-, are collectively called reactive oxygen species (ROS), and are considered quite dangerous.
Enter anti-oxidants. Organisms that survive around oxygen have many defenses against it. One is an enzyme that degrades that superoxide ion mentioned above. (That enzyme is called superoxide dismutase.) Further, there are chemicals around that can rapidly react with ROS, sacrificing themselves for the good of the cell. These chemicals are collectively known as anti-oxidants; they include glutathione and common vitamins such as C and E.
So, anti-oxidants are good for us? Maybe we should take more of them? Maybe they would treat cancer?
Those are perfectly good questions to ask, but be careful about what you expect -- or assume. Like so many things in biology, the full story is complex.
A new article examines the effect of some anti-oxidants on mice with melanoma. The following figure shows some key results...
|
There are two treatment groups. In one the mice are treated with the anti-oxidant N-acetylcysteine, labeled NAC. The other is a control, Ctrl.
There are two types of measurements. In frame B (left), the tumor size is measured; in frame C (right) the number of metastases is measured. (Specifically, metastases to the lymph nodes, LN.)
|
The amount of tumor is essentially the same for both treatment groups. However, the number of metastases is doubled when the mice are treated with NAC.
This is Figure 1 parts B & C from the article. The other parts of the full figure provide additional data in agreement with these observations.
|
The experiment shows that the anti-oxidant NAC increases the number of metastases. It's metastases that lead to most cancer deaths nowadays. Thus the effect of the anti-oxidant is of concern.
The big question is the significance of the result. That's not clear. Previous work had shown a variety of effects of anti-oxidants on cancer, with no clear picture. The current article goes on to show how the anti-oxidant works in this case to promote metastasis. It seems to promote migration and invasion of the cancer cells. Along the way, it increases the level of glutathione, thus affecting the natural oxidation balance in the cells. The scientists also show some evidence for another anti-oxidant (a vitamin E derivative); the overall effect may be similar. Other work has suggested different mechanisms of action. There may be no one general answer.
The detrimental effects seen here should make clear that we should not assume that an anti-oxidant would be useful in treating cancer. The work does not preclude that there might be favorable cases, but they need to be shown.
My usual disclaimer on medical matters... I don't give medical advice. This post is about an article, and I have comments about what is in the article.
News story: Antioxidants Facilitate Melanoma Metastasis -- Two compounds boost the ability of melanoma cells to invade other tissues in mice, providing additional evidence that antioxidants can be beneficial to malignant cells as well as healthy ones. (A Azvolinsky, The Scientist, October 7, 2015. Link is now to Internet Archive.)
The article: Antioxidants can increase melanoma metastasis in mice. (K Le Gal et al, Science Translational Medicine 7:308re8, October 7, 2015.)
ROS damage and the anti-oxidant glutathione were discussed in the post Are birds adapting to the radiation at Chernobyl? (August 3, 2014).
Possible role of ROS and oxidative stress in heat attack damage: Can we pinpoint a specific molecular explanation for tissue damage following a heart attack? (March 24, 2015).
A post that mentions the issue of anti-oxidants and cancer: Is folic acid good for you or bad for you? (April 10, 2010).
More...
* How oocytes limit oxygen-induced aging (August 20, 2022).
* Science myths (February 23, 2016).
* How vitamin C kills cancer (December 15, 2015).
More about melanoma:
* A connection between eating fish and skin cancer? (June 20, 2022).
* Can fecal transplantation be useful in treating cancer? (April 27, 2021).
* Fair skin and cancer: What is the connection? (March 12, 2013).
More about metastatic cancer:
* Metastasis: How clusters of tumor cells get through narrow capillaries (June 3, 2016).
* Cancer metastasis: An early detection system? (October 20, 2015).
* Diagnosis of prostate cancer in a 2100 year old man (November 8, 2011).
My page for Biotechnology in the News (BITN) -- Other topics includes a section on Cancer. It includes a list of related posts.
Bacteria found in rectum of old flea
October 16, 2015
You ask... How old? and What kind of bacteria?
20 million years. And... Don't really know, but they might be similar to plague bacteria.
Now this may be getting interesting.
First, let's look at the flea.
That's him, at the right.
The scale bar is 465 µm. That is, he is about 1 millimeter long.
This is Figure 1 from the article.
|
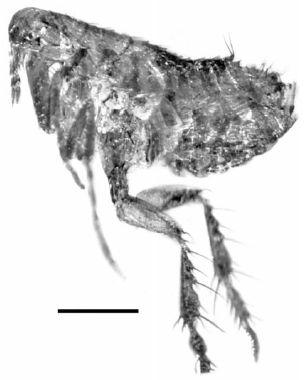
|
Why is this flea so interesting? Aside from what was found in his back end, which we will come to later... The flea was found in a sample of amber from the Dominican Republic. The amber is thought to be 15-45 million years old. Note the high uncertainty of the age estimate; we refer to it as 20 million years old for convenience.
Amber has long been recognized as a source of well-preserved biological samples. Fleas don't fossilize well, yet here we have a remarkably well-preserved flea -- 20 million years old.
Detailed examination showed that this flea looks rather novel. The author decided that it represents a new type of flea -- not just a new genus and species, but a new "tribe". It thus represents a step in understanding the history of fleas, which date back to the time of the dinosaurs.
To emphasize how well preserved he is... This is a photograph (not a drawing or artist's conception). It was taken with an ordinary light microscope.
For the record... His name is Atopopsyllus cionus, n. gen., n. sp. (Atopopsyllini n. tribe, Spilopsyllinae, Pulicidae). "n" means new (or some Latin equivalent), so "n. gen., n. sp." means new genus, new species.
The flea was so well preserved that the author could see individual microbial cells in the rectum. Figure 10 shows trypanosomes; Figure 11 shows bacteria. It's hard to tell much, but you can check these out if you want.
The author finds the appearance of the bacteria (Figure 11) to be intriguing. They remind him of the appearance of plague bacteria -- the bacteria now called Yersinia pestis, which were responsible for the black death. There is nothing more to go on, and it is not a strong argument. But it is provocative. Biologists have explored the history of plague, and suggest the disease is a few thousand years old. But of course the bacterial lineage may be much older, and perhaps there were "similar" diseases millions of years ago. Is the current finding a hint of that history, or just an odd observation of no great significance? I wonder what people will make of this finding.
News story: Bacteria in ancient flea may be ancestor of the Black Death. (Science Daily, September 28, 2015.) This is based on the press release from the author's university. It emphasizes finding the bacteria, and includes a good discussion of how fleas work. Just remember that the facts about the bacteria are limited; in fact, the news story goes beyond what is formally published in the article. This is an interesting news story, but be cautious with the speculation.
The article: A New Genus of Fleas with Associated Microorganisms in Dominican Amber. (G Poinar, Jr, Journal of Medical Entomology 52:1234, November 2015.)
More about fleas: Jumping -- flea-style (February 21, 2011).
There are no previous posts about amber or the plague. The following post notes a plague, but it uses the more general meaning of the term... Musici Ambulanti: Ancient art and ancient microbiology (January 17, 2012).
Now, a plague post: The Black Death: implications for the development of auto-immune diseases? (January 21, 2023).
Another specimen from amber: A Cretaceous dinosaur the size of a tiny bird? (June 2, 2020).
October 14, 2015
Nobel notes
October 13, 2015
The Nobel prizes were announced last week. All three science prizes have a connection to Musings posts, so I thought I would note them here. In no case, did we discuss the specific work that was the subject of the award; that was typically "long ago".
For each, there is a link to the Nobel announcement quoting the first sentence or so, an outside news story, and 1-2 Musings posts.
Physiology or medicine
Nobel announcement: The 2015 Nobel Prize in Physiology or Medicine. The award is "... to William C. Campbell and Satoshi Omura for their discoveries concerning a novel therapy against infections caused by roundworm parasites, and ... to Youyou Tu for her discoveries concerning a novel therapy against Malaria." (October 5, 2015.)
News story: Antiparasite Drug Developers Win Nobel. (K Zusi & T Vence, The Scientist, October 5, 2015.)
Related Musings posts, one about each of those two drugs:
* A post about the anti-roundworm drug ivermectin: Using your phone to find Loa loa (August 14, 2015).
* A post that notes work on the development of a microbial process to make the anti-malaria drug artemisinin: Some fun reading: Fuel cell gadget and growing diesel (December 13, 2008).
Physics
Nobel announcement: The 2015 Nobel Prize in Physics " ... recognises Takaaki Kajita in Japan and Arthur B. McDonald in Canada, for their key contributions to the experiments which demonstrated that neutrinos change identities. This metamorphosis requires that neutrinos have mass." (October 6, 2015.)
News story: Neutrino 'flip' wins physics Nobel Prize. (J Webb, BBC, October 6, 2015.)
Related Musings post: IceCube finds 28 neutrinos -- from beyond the solar system (June 8, 2014).
Chemistry
Nobel announcement: The 2015 Nobel Prize in Chemistry " ... is awarded to Tomas Lindahl, Paul Modrich and Aziz Sancar for having mapped, at a molecular level, how cells repair damaged DNA and safeguard the genetic information." (October 7, 2015.)
News story: Nobel Prize in Chemistry 2015. (Chemistry Views, October 7, 2015.) This news story was added to replace one that is no longer available.
Related Musings posts:
* A gene for breast cancer: what does it do? (May 4, 2010).
* Electricity in DNA: guarding your genes? (December 16, 2009).
Nobel prizes get mentioned in Musings posts from time to time. The last post that featured a Nobel in the title was In vitro fertilization: an improvement and a Nobel prize (October 15, 2010). If you want to see more about posts that note a Nobel, put the following into Google: Nobel site:bbruner.org/musing
Is the warnowiid ocelloid really an eye?
October 12, 2015
What can you do with a mitochondrion? Use it to help you get energy from your food? Good; that is what most organisms do with mitochondria.
But can you use a mitochondrion to help you see? Can you use it to help you make an eye? You get some other parts, too -- including some chloroplasts.
A recent article is about an organism that may do just that.
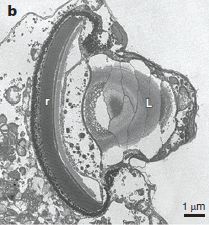
|
This is an electron microscope image of the ocelloid of an Erythropsidinium.
Two parts of it are labeled: r and L. Those stand for retina and lens.
This is Figure 1b from the article.
|
It looks very much like an ordinary animal eye. But this is tiny; note the scale bar at the lower right. And this is not from an animal, but from a warnowiid dinoflagellate (a type of single-celled protist).
This ocelloid feature was first noticed a century ago, but little is known about it. In fact, when it was first noticed, scientists suspected it might be a contaminating eye from some other organism, such as a jellyfish. Warnowiid dinoflagellates are quite rare, and have not been grown in the lab.
The new article includes detailed structural observations, such as the figure above. It also includes genome analyses, which turn out to be instructive. Genome work is so sensitive nowadays that one can analyze the genome from a single cell -- or from a single structure. The key is doing the dissection and isolating the sample carefully so you know exactly where it is from. The sequencing methods per se do not need much material.
The genome analyses of structures from the ocelloid reveal some surprising points... The structure that looks like a retina contains chloroplast DNA; the structure covering the lens, like a cornea, is mitochondrial.
The hypothesis that emerges from the new work is that this simple single-celled organism has assembled something that looks like an eye, using parts that are lying around. These include the common endosymbionts mitochondria and chloroplasts. Chloroplasts, of course, are quite good at receiving light. They are commonly used as the light receptor for photosynthesis; this organism seems to have repurposed them to make a retina.
There is much more we would like to know about the ocelloid. A basic question is, what does it do? There is no direct evidence that the ocelloid is a functional eye. It certainly looks like an eye, and related organisms have a simple eye spot that helps the cell orient to light. Does the ocelloid function as an eye? Is it better than a simple eye spot? Someone needs to figure out how to give eye exams to protists.
News stories:
* Human-like 'eye' in single-celled plankton: Mitochondria, plastids evolved together. (Science Daily, July 1, 2015.)
* Single-Celled Creature Has Eye Made of Domesticated Microbes. (E Yong, Not Exactly Rocket Science (National Geographic), July 2, 2015. Now archived.)
* News story accompanying the article: Protistology: How to build a microbial eye. (T A Richards & S L Gomes, Nature 523:166, July 9, 2015.)
* The article: Eye-like ocelloids are built from different endosymbiotically acquired components. (G S Gavelis et al, Nature 523:204, July 9, 2015.)
How many eyes does it have? (March 12, 2010). The eyes of another very simple creature. A linked post is about giving them an eye exam.
And more unusual animal vision... An eye that forms an image using a mirror (February 13, 2018).
Of ocelli and ocelloids... A see-shell story (February 21, 2016).
More on dinoflagellates...
* Coral bleaching: how some symbionts prevent it (September 30, 2016).
* Quiz: What is it? (March 6, 2012). (The main organism featured there is not a dinoflagellate.)
More organelle stories...
* How are mitochondria from the father eliminated? (September 20, 2016).
* Origin of eukaryotic cells: a new hypothesis (February 24, 2015).
* A new organelle "in progress"? (September 13, 2010).
There is more about genomes and sequencing on my page Biotechnology in the News (BITN) - DNA and the genome. It includes an extensive list of related Musings posts.
A book about plankton, listed on my page Books: Suggestions for general science reading... Sardet, Plankton -- Wonders of the drifting world, 2015.
A novel drug candidate that is active against all stages of the malaria parasite
October 10, 2015
Malaria is a complicated disease. It is caused by a parasite, but that parasite has multiple growth phases -- in mosquitoes and in humans. For example, in humans there are distinct growth phases in the liver and blood.
The complexity of the malaria parasite's growth presents a major challenge to drug development; a drug effective against one stage is typically not effective against another.
You might wonder... Aren't there things the parasite does in all stages? Sure, but they may not be good drug targets. Remember, the basic biology of a malaria parasite is the same as basic human biology. Both are eukaryotes; developing drugs that are active against one eukaryote and not another has long been a difficult problem. Of course, there might be good targets we haven't found yet.
A recent article reports finding such a target -- and a drug that inhibits all stages of the parasite in a mouse model system, with low toxicity.
The drug inhibits protein synthesis in the parasite. But it is more or less an accident that the scientists could find a drug that inhibits the step in all parasite stages but not in the host.
The authors show that their new drug is effective against current drug-resistant strains. They estimate that the drug should be quite inexpensive. The low cost coupled with its broad effectiveness suggests it could be useful as a prophylactic drug, reducing the chances of getting an infection.
Of course, the immediate challenge is to see whether it works in humans. It's a long journey from drug discovery to establishment, and many drugs fail along the way. The current drug is interesting, but the work here it is only a first step.
News stories:
* New single-dose malaria treatment could eventually help millions. (S Petrova, The Conversation (and reprinted here by Medical Xpress), June 18, 2015.)
* New antimalarial compound discovered -- Promising lead kills parasites in both humans and mosquitoes. (Wellcome Trust Sanger Institute, July 2, 2015.) From one of the institutions involved in the work.
The article: A novel multiple-stage antimalarial agent that inhibits protein synthesis. (B Baragaña et al, Nature 522:315, June 18, 2015.)
A recent post on malaria: Pop goes the hemozoin: the bubble test for malaria (January 24, 2014).
More... How an American weed might interfere with control of malaria in Africa (November 13, 2015).
More on malaria is on my page Biotechnology in the News (BITN) -- Other topics under Malaria. It includes a listing of related Musings posts.
2 + 2 = 4: Chemists finally figure it out
October 9, 2015
2 + 4 = 6 has long been a standard process for chemists, but the harder problem of 2 + 2 = 4 has largely eluded them. A new article reports progress.
Here is a diagram showing the 2 + 4 = 6 reaction...
|
In this reaction, a diene (two double bonds) is reacted with an alkene (one double bond), to form a 6-membered ring (or "6-ring" for short), with one double bond (a cyclohexene).
This type of reaction is called a Diels-Alder reaction.
|
It proceeds easily with a wide variety of diene + alkene reactants. (What's the EWG shown in the figure? It stands for electron-withdrawing group, and is needed to activate the alkene. Also, the diene must have the two double bonds in just the pattern shown, with one single bond between them; that pattern is called conjugated, and maximizes their interaction.)
My 2 + 4 = 6 description is a corruption of what chemists actually say. The left side of that is a count of the pi electrons in the double bonds; the label [4π + 2π] under the reaction arrow reflects that. The right side is the ring size of the product. But one might also note that the reaction involves joining a 4-carbon unit with a 2-carbon unit, to form the 6-ring.
This is part A of the Figure from the news story accompanying the article.
|
2 + 2 = 4, then, would mean [2π + 2π], or two alkenes, forming a 4-ring. The following figure shows a couple of examples. These are actual cases reported in the new article.
The reaction on the left is simple, with two molecules of the same alkene (a homodimerization).
The reaction on the right is more complex, with two different alkenes. In fact, one of them has three double bonds -- two of which are near each other (conjugated) as in the diene used above. (The results are more complex than shown here, but it does yield one predominant product.)
It has not generally been possible to do this type of reaction. In the new work, the scientists developed a catalyst that promotes the 2 + 2 = 4 reaction. The catalyst is shown over the reaction arrow as Fe(PDI); it has an Fe atom in a complex organic framework. That organic framework tunes the properties of the catalyst; they actually have variations of the catalyst for different reactions, and catalyst development will continue.
With the catalyst, these reactions run quite well at room temperature (23° C is shown). The article reports that this type of reaction works well for a wide variety of alkenes.
This is part C of the Figure from the news story accompanying the article.
I have left some of the labeling on the figure. We won't go into the details, but the additional information reinforces the point that these reactions may be useful.
|
The article includes some discussion of how the scientists think the catalyst works. The trick is that the Fe atom reacts with both of the double bonds, forming a 5-ring including the Fe; the Fe then drops out, and the 4-ring forms.
4-membered (cyclobutane) rings are strained; that is part of why they are hard to make. But they are useful chemicals, sometimes because the strain helps promote the next reaction. The procedure developed here seems to offer a widely applicable way to make these 4-membered rings from simple starting materials.
News story: Cyclobutane derivatives made from [2+2] cycloaddition of feedstock alkenes and an iron-based catalyst. (Phys.org, September 7, 2015.)
* News story accompanying the article: Organic chemistry: As simple as [2+2]. (M W Smith & P S Baran, Science 349:925, August 28, 2015.)
* The article: Iron-catalyzed intermolecular [2+2] cycloadditions of unactivated alkenes. (J M Hoyt et al, Science 349:960, August 28, 2015.)
A recent post about the development of a chemical process, dependent on a new catalyst... A simpler way to make styrene (July 10, 2015).
More about catalysts: Low temperature treatment for auto exhaust? (February 18, 2018).
A post about cyclobutane rings... Turning sewage into profit -- via rocket fuel (September 15, 2010).
More iron chemistry...
* A practical system for removing arsenic from water (March 21, 2014).
* A living organism powered entirely by electricity? (February 22, 2013).
* Blueprint of a seaweed (1843) (May 2, 2012).
October 7, 2015
Twenty percent of the females are genetic males
October 6, 2015
Sex determination in reptiles can get confusing. Some reptiles use a system involving genes and chromosomes that is somewhat like ours. One sex has two sex chromosomes of the same kind; the other sex has two different sex chromosomes. In humans, the females have two X chromosomes (XX), whereas males have one X and one Y chromosome (XY). In the lizards discussed here, the males are ZZ, and the females are ZW.
There is nothing important about the details, or the difference from what mammals do. The point is that one can tell the genetic sex by identifying the chromosomes.
In some reptiles, sex is determined by temperature (T): the T during egg development.
The lizard known as the bearded dragon has both systems.
The T part of the system has been demonstrated in the lab; it leads to lizards that are genetically male becoming female.
A new article reports examining dragons from the wild. Twenty percent of the females the scientists found should be male, according to their chromosomes. That is, they found ZZ females in the wild. Lots of them. They had a male set of chromosomes, but female anatomy -- and they reproduced as females. In fact, ZZ females reproduced better than the traditional ZW females; they had more offspring.
That's a bit weird, isn't it? But it may be more than that. First, it is a chance to watch a change in sex determination occurring in nature. We know some lizards use one system and some use another; here we may be watching a lizard change from one to the other.
A change from one [system of sex determination] to the other? Think about what happens... Cross a ZZ female with a (normal) ZZ male. All the offspring are ZZ. The W chromosome gets lost. Getting a mix of males and females is now entirely dependent on the environment, the T.
Second, the change may be important -- a challenge to the survival of the bearded dragons. Both of the systems for sex determination work. However, the T-based system has a vulnerability. The sex ratio of the animal depends on the environmental temperature. That's ok. Somehow, the animal has adapted so that it produces a reasonable sex ratio under the conditions it encounters. But what if the environmental T changes rapidly -- so rapidly that the organism cannot adapt? There is a risk of this happening as we experience rapid climate change. There are reptiles for which significant changes in sex ratio have occurred over recent years, and there is concern about the future of some of these species.
The bearded dragons may be undergoing an interesting change, from one mode of sex determination to another. They may also be sealing their own fate if they do this at a time of rapid climate change. That may be quite uncertain at this point, but the story alerts us to the issue. That is the big story here.
News stories.
Update: Two new stories listed May 2022 to replace stories no longer available.
* Reptile sex goes wild in the outback, UC research finds. (Claudia Doman, University of Canberra, July 2, 2015.)
* Australian "dragon." If it's hot, eggs hatch with female genitalia but male genetics. (David J Tenenbaum, Why Files, July 2, 2015. Now archived.)
News story: Lizard Swaps Mode of Deciding Its Sex -- Sex assignment in bearded dragons can flip from one based on chromosomes to one driven by temperature, researchers report. (K Grens, The Scientist, July 1, 2015. Link is now to Internet Archive.) Discusses the current work and the "big story" significance.
* News story accompanying the article: Evolution: Reptile sex determination goes wild. (J J Bull, Nature 523:43, July 2, 2015.)
* The article: Sex reversal triggers the rapid transition from genetic to temperature-dependent sex. (C E Holleley et al, Nature 523:79, July 2, 2015.)
More about lizard reproduction...
* Facultative endothermy: a lizard that is warm-blooded in October (February 1, 2016).
* When should the eggs hatch? (June 11, 2013).
* An advanced placenta -- in Trachylepis ivensi (October 18, 2011).
* Development of a new species of lizard in the lab (May 20, 2011).
More about sex chromosomes or sex determination...
* Added July 16, 2025.
The role of dietary iron in sex determination in mammals (July 16, 2025).
* Quiz: The monkey-cat (October 26, 2011).
* On his right side, he is female (April 24, 2010).
More about climate change: Is the weather getting better or worse? (May 23, 2016).
Ribosomes with subunits that are tethered together
October 5, 2015
In all forms of life, proteins are synthesized on ribosomes. Ribosomes consist of two subunits, commonly called small and large. The subunits join and separate as part of the translation process for making each protein chain; subunit cycling seems to be an integral part of the process.
Would it be possible to tie the two subunits together, so that a particular small subunit always stays with its own large subunit partner? A new article reports doing just that.
The following figure summarizes the idea...
Part a (top) outlines the normal process. It starts with some pieces, which are labeled. (The AUG is the start codon on the mRNA.) First, the small ribosomal subunit (red) binds to the mRNA at the start codon, along with a tRNA molecule. That's what is shown with the first arrow. The large ribosomal subunit (green) then joins, and translation proceeds. Both subunits are important players; you can see that the tRNA molecule is interacting with both.
It's not shown, but the subunits separate at the end of translation.
Part b shows the new process. You can see that the two subunits are now tied together
This is Figure 1 from the news story accompanying the article.
|
The new ribosomes, with subunits tethered together, work -- about as well as the original ribosomes. Cells containing the new type of ribosome (instead of normal ribosomes) grow fine, though at about half the rate of the parent cells with normal ribosomes.
There is an important subtlety. In the tethered ribosome, the two "subunits" are not rigidly attached to each other. As the diagram hints, they are tethered (by an RNA connector). They can't separate completely; they can't mix with other subunits in a cellular pool. But they can breathe, allowing things to happen at the interface between subunits.
As noted above, the tethering was done via RNA. Each subunit has its own RNA molecule. What the scientists did was to join the genes for the two RNAs. This resulted in a single long RNA, which served for both subunits and tying them together. However, figuring out how to do that required considerable effort. You can't just join the two original RNAs.
The following figure shows what they did...
At the left are the two normal ribosomal RNA molecules. The large one, labeled 23S, is in blue at the top. The small one, labeled 16S, is in yellow at the bottom. The complex layout reflects many of the structural features of the RNAs. If you are patient, you will find the two ends, labeled 5' and 3', of each chain.
At the right is the new RNA, labeled 16S-23S. The color coding is retained for the parts, but it is now all one chain. The connection is in red. The ends of the small RNA remain, but those of the large RNA are gone. The small RNA has been inserted into the large one. (That is, they are not end-to-end.)
This is Figure 2b from the article.
|
Why would one want to do this? One reason, of course, is curiosity. Doing it is a test of our understanding of how the ribosome works. However, there is another motivation. Scientists would like to make cells that contain two distinct types of ribosomes, following different rules. That will be a lot easier if subunit mixing is prevented. Ribosomes with tethered subunits could be a step toward making such cells.
News story: Researchers design first artificial ribosome. (Science Daily, July 29, 2015.)
* News story accompanying the article: Synthetic biology: Ribosomal ties that bind. (J D Puglisi, Nature 524:45, August 6, 2015.)
* The article: Protein synthesis by ribosomes with tethered subunits. (C Orelle et al, Nature 524:119, August 6, 2015.)
More about ribosomes -- what they are and how they work:
* Design criteria for mRNA: the start codon (May 2, 2022).
* Do human genes function in yeast? Yeast-human hybrids. (August 21, 2015). In this post, ribosomes were noted as an example of a complex interconnected structure.
* Carl Woese and the archaea (January 12, 2013). rRNA is commonly used to identify organisms.
Also see: Scientific curiosity -- and politics (May 22, 2017).
What's the connection: Narcolepsy and the flu vaccine (or getting the flu)?
October 3, 2015
Not obvious, is it?
Do you remember the new flu strain that emerged in 2009? It provoked extensive vaccination programs. In Europe, there was an increased incidence of narcolepsy. Investigation showed that it correlated with getting one particular type of flu vaccine. Further, one study has found a correlation between the seasonal incidence of flu and narcolepsy.
What's going on? Is it just coincidence, or is there some real connection? A recent article offers a clue.
Before we look at the new information... What is narcolepsy, and what do we know about how it occurs? Narcolepsy is a condition in which a person has a strong tendency to fall asleep during daytime. In recent years, it has been worked out that narcolepsy is typically caused by failure of a hormone called hypocretin. Many people with narcolepsy can now take hypocretin as a drug, resulting in good control of their narcolepsy.
What kind of connection might there be between flu and narcolepsy? The evidence above, showing some correlation between flu and narcolepsy, might suggest that they share some biology. Perhaps, for example, the flu virus, in a vaccine or in a natural infection, stimulates an immunological response that just happens to interfere with the narcolepsy pathway. There is no reason that "should" happen, but sometimes two proteins are closely enough related that there is some immunological cross reaction between them.
The new analysis finds that a part of the flu virus is very similar to the receptor for the narcolepsy hormone. This viral protein induces antibodies to itself, as expected. Those antibodies also recognize the receptor for the narcolepsy hormone, thus preventing that hormone from acting -- and thus causing narcolepsy.
The logic of that is good; I suggest you go through that paragraph slowly enough that you follow what people think may be going on.
One piece of evidence is that the vaccine that seemed to promote narcolepsy contained more of the offending protein than did the vaccine not correlated with narcolepsy. Further, people who had been vaccinated with it had more of the offending antibodies.
It is not clear where this is going. The story is intriguing and plausible, but incomplete. If the story holds up, a hidden problem has been uncovered -- and can be dealt with. There have been some suggestions of a flu-narcolepsy connection before, but some of the work was not reproducible. The new work needs to be integrated with that.
News story: Immune response to a flu protein yields new insights into narcolepsy. (Science Daily (Stanford), July 1, 2015.) This news story was added to replace one that is no longer available.
The article: Antibodies to influenza nucleoprotein cross-react with human hypocretin receptor 2. (S S Ahmed et al, Science Translational Medicine 7:294ra105, July 1, 2015.)
Even with the offending vaccine, narcolepsy was a rare side effect. The incidence of narcolepsy was on the order of one in ten thousand.
The authors explicitly note that, based on what we know at this point, the benefits of the flu vaccine outweigh this possible side effect. Part of that evaluation is that a natural flu infection may have the effect, too. There is considerable uncertainty here at this point, and it is good to learn how to minimize an adverse effect. However, there is no intent here to suggest that the flu vaccine should be avoided.
Narcolepsy was briefly noted in the post Dog psychiatry: Implications for humans (October 3, 2010).
Another example of confusion in the immune system: Why are HIV-infected people more susceptible to Salmonella infection? (May 21, 2010). Links to more.
Many posts on various flu issues are listed on the supplementary page: Musings: Influenza.
* Previous "What's the connection" post: What's the connection: blue cheese, rotten coconuts, and the odorous house ant? (August 24, 2015).
* Next: What's the connection: ships and lightning? (October 14, 2017).
An obesity gene: control of brown fat
October 2, 2015
If we eat more than we spend, we gain weight. If we do too much of that, we may get obese. People vary in their propensity to become obese. That almost certainly includes variation in propensity to eat, all else equal, and variation in how we spend our food.
The above statements are generalities. They are probably broad enough that they are not controversial. They are also too broad to be helpful.
One of the "missing links" may be brown fat. That is a cell type that burns our food without producing anything useful -- except heat. Sometimes the use of brown fat to make heat may itself be good. Sometimes, using brown fat could be just a way to burn off excess food. Our understanding of brown fat is still too limited to let us exploit it intentionally. Musings has discussed both brown fat and obesity in previous posts [links at the end].
A new article expands our understanding of the connection. The scientists study a gene that controls the development of one kind of brown fat; a mutant form of this gene is linked to obesity.
The story started, a few years ago, with a broad survey to find genes associated with human obesity. One of the genes found, the one with the strongest association with obesity, is FTO. In particular, people with a certain form of the FTO gene are more likely to be obese.
What does FTO do? That is the focus of the new article. To study this, the scientists worked with mice, as well as with cells from people with various forms of the FTO gene. The bottom line is that mice -- and humans -- with the mutant form of FTO make less beige fat (one of the forms of brown fat). The work uncovered many details of the process.
The following figure summarizes their findings...
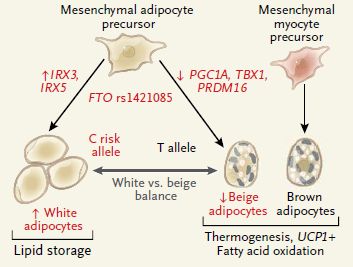
|
The cell at the top (to the left) is an adipocyte (fat cell) precursor. It might differentiate following either of the black arrows pointing down: to white adipocytes (left) or beige adipocytes (right). As the figure notes, white adipocytes are for lipid storage, whereas beige adipocytes can burn fat and make heat (thermogenesis).
Some proteins needed for each of those two pathways are shown on the arrows. For example, IRX3 is needed to make white adipocytes; PGC1A is needed to make beige adipocytes.
|
Underneath the precursor cell and between the arrows, there is FTO, with the name of a particular mutation. Below that it says "C risk allele" in red at the left, and "T allele" in black at the right. That is about the mutation. The mutation is a single base change, at a particular site, from T to C. T is normal, C is the mutated "risk allele". People with the C have a propensity to be obese.
Further, those red and black colors are important. Black is normal. Red tells you what happens when the FTO mutation is present. For example, the level of IRX3 increases, leading to more white adipocytes; note the upward arrows on both of those. On the other hand, PGC1A decreases, leading to fewer beige adipocytes; downward arrows.
The right side of the figure shows a myocyte (muscle cell) precursor cell differentiating into a brown adipocyte. This is another kind of brown fat, not directly related to the current story.
This is Figure 5D from the article.
|
The combination of evidence is important. There is an association of a particular mutation with obesity in humans, and there is now some understanding of how it works. FTO seems to be a gene that helps control the development of one kind of brown fat. Overall, the work strengthens the case for the importance of beige fat, and develops some of the details of how it is regulated.
Among the details... The scientists modified cells to change their FTO from one allele to another, by making directed single base changes. To do this, they used the emerging CRISPR tool.
We might wonder whether people with the mutant allele could be treated. That is for the future. The more immediate importance is that the work enhances our understanding of fat metabolism and obesity. The work does imply that an intervention to promote the development of beige fat might be useful; that has not escaped the attention of the pharmaceutical industry. But we caution... drug development is a long and slow process, and may meet unexpected hurdles. It is best to think of the current article as one step toward understanding a complex process.
News story: Obesity breakthrough: Metabolic master switch prompts fat cells to store or burn fat. (Science Daily, August 19, 2015.)
* Editorial accompanying the article. It may be freely available: Unraveling the Function of FTO Variants. (C J Rosen & J R Ingelfinger, New England Journal of Medicine 373:964, September 3, 2015.)
* The article, which may be freely available: FTO Obesity Variant Circuitry and Adipocyte Browning in Humans. (M Claussnitzer et al, New England Journal of Medicine 373:895, September 3, 2015.) Check Google Scholar for a copy.
A good background post on brown fat: Brown fat: different kinds respond differently to cold (September 20, 2013).
Another gene for obesity: A gene for obesity (May 7, 2011).
More...
* Treating obesity: A microneedle patch to induce local fat browning (January 5, 2018).
* Olfaction and obesity? (July 18, 2017).
CRISPR: an overview (February 15, 2015). Includes a list of Musings posts on the gene editing tool CRISPR; I will try to keep the list complete.
For more about fat, see the section of my page Organic/Biochemistry Internet resources on Lipids. The list of Musings posts there includes more on brown fat and on obesity.
September 30, 2015
Fish make their own sunscreen
September 29, 2015
Briefly noted...
Many organisms have a chemical that acts as a sunscreen; after all, they are in the sun, and need protection from ultraviolet irradiation. Some make their sunscreen; some get it from their diet. (And some buy it at the supermarket.)
A recent article shows that a fish makes a sunscreen, called gadusol. This came as something of a surprise... Vertebrates were not known to have the genes for making it, and it was suspected -- even assumed -- that fish got it from their diet.
The discovery was made first in the zebrafish, a small fish commonly used for lab work. The scientists identified specific zebrafish enzymes for making gadusol. Analysis of genome databases showed that the gadusol genes were found in many fishes, and also in amphibians, reptiles and birds, but not mammals.
To show that the fish genes for making the sunscreen were intact, the scientists transferred them to yeast -- which then made the compound. This might be the basis of a commercial system for making gadusol. Beyond that, the article raises interesting questions about how the gadusol genes got to vertebrates and why they are not in mammals.
News story: Fish and other animals produce their own sunscreen: Copied for potential use in humans. (Science Daily, May 12, 2015.)
* News story accompanying the article; it is freely available: Shedding light on sunscreen biosynthesis in zebrafish -- Zebrafish can synthesize a sunscreen compound called gadusol, which was previously thought to be acquired only through the diet. (C A Brotherton & E P Balskus, eLife 4:e07961, May 12, 2015.)
* The article, which is freely available: De novo synthesis of a sunscreen compound in vertebrates. (A R Osborn et al, eLife 4:e05919, May 12, 2015.)
Previous fish post: The opah: a big comical fish with a warm heart (July 13, 2015).
More zebrafish:
* Scoliosis: an animal model (July 22, 2016).
* The answer is cereblon (March 16, 2010).
Other posts about sunscreens include...
* How some tardigrades are resistant to ultraviolet light (October 27, 2020).
* How do you know if you have been in the sun too long? (August 5, 2016).
* How can the mantis shrimp see so many colors of UV? They use filters (August 30, 2014). One of the filters discussed there is the same compound, gadusol. (The post does not name the specific compound, but refers to its roles.)
* A possible hazard of using compact fluorescent light bulbs (November 13, 2012).
* Geoengineering: a sunscreen for the earth? (February 20, 2010).
The quality of citizen science: the SOD Blitz
September 28, 2015
We have an article that tests how well citizen science works. The context is sudden oak death (SOD), an infectious disease that is raising havoc with oak trees in California. SOD is caused by a "water mold" called Phytophthora ramorum.
Monitoring trees for signs of the disease is important, but expensive. A few years ago, SOD scientists developed a program to include citizen scientists as a central part of the monitoring operation. It is the SOD Blitz program.
A recent article reports how well they did; the following figure summarizes some of the results.
What happens here is that observers send in leaf samples that they think might represent SOD. The samples are properly tested in the lab.
Look at the lower part of the figure, for 2012. Look at the column labeled "success rate". The success rates for professionals (green hat) and non-professionals -- the citizen scientists -- (yellow hat) are essentially the same.
For 2011 (upper part of the figure) the non-professionals actually did better than the professionals. However, the numbers are smaller, especially for the professionals; we won't make any more of this.
This is part of Figure 3 from the article. (The full figure shows data for one more year. It also shows some statistics, which seem excessive.)
|
The conclusion is that the program to use non-professional volunteers to collect information about spread of a disease is working well. The volunteers are trained by professional scientists working on SOD; you can't just send in your leaves.
The article is interesting because it actually compares the quality of data from the professional and non-professional sources. That is, the scientists don't just use the citizen scientist data; they have validated its quality.
News story: Citizen science helps predict spread of sudden oak death. (Phys.org, May 1, 2015.)
The article: Citizen science helps predict risk of emerging infectious disease. (R K Meentemeyer et al, Frontiers in Ecology and the Environment 13:189, May 15, 2015.) Check Google Scholar for a copy.
A post about another plant disease caused by another Phytophthora ... Tracking the pathogen of the Irish potato blight (June 25, 2013). This post briefly discusses what kind of organism Phytophthora is.
Recent post on "citizen science"... Using your smartphone to detect cosmic rays (April 7, 2015). Links to more.
More... Finding Planet 9: You can help (March 13, 2017).
More about trees: At what wind speed do trees break? (April 2, 2016).
My page Biotechnology in the News (BITN) -- Other topics includes a section on Sudden Oak Death.
Transmission of Alzheimer's disease in humans?
September 27, 2015
This is a story that may seem scary. But set that aside; it is a fascinating biology story, about our increasing understanding of an important disease. The practical implications are not clear, but probably less than we might fear.
Alzheimer's disease (AD) is a progressive neurodegenerative disease, with increasing prevalence with age. There is nothing in the traditional knowledge of the disease to suggest it can be transmitted from one person to another.
We have learned a lot in recent years about AD at the molecular level, although the story is still incomplete. Interestingly, that increased understanding has led scientists to wonder whether AD might in fact be transmissible, at least under special circumstances. It "should" be transmissible.
Central to the AD story is a small protein called AB or AB-42; that stands for amyloid beta 42, the number giving the size (number of amino acids) of the protein. This protein aggregates into what are called amyloid plaques, a characteristic feature of the disease. Much attention has been devoted to figuring out how these plaques form and what they do. One point is that small aggregates serve as "seeds" to promote further aggregation.
This feature of a protein forming aggregates, and serving to seed aggregate development, reminds us of another type of disease: the prion diseases, such as bovine spongiform encephalopathy (BSE) and Creutzfeldt-Jakob disease (CJD). That comparison makes us think about another characteristic of prion diseases: they are transmissible, at least sometimes. Transfer of the aggregated protein from one animal to another can lead to the disease in the recipient. In the lab, this transfer is often done by direct inoculation into the brain. Some prion diseases can be transmitted orally. (One form of CJD is acquired by eating beef that has the BSE prion.)
If AD is, in some ways, like prion diseases, is it possible that AD can be transmitted? The question forces itself on us. In fact, experimental transmission of AD in lab animals has been shown. This was first done by direct inoculation of the protein aggregate into the brain, and it led to disease symptoms in the recipient. In follow-up work, the AD aggregate was injected into the abdominal cavity, with the same result. This was discussed in an earlier post [link at the end]; I encourage you to go back and review that post somewhere along the way here.
We now have an article suggesting that transmission may occur for humans. Of course, no one intentionally inoculates AD proteins into humans. However, it has happened accidentally, and we now have some information on the consequences.
What kind of accident led to people being given AD protein? Human growth hormone (hGH) is a useful drug. hGH used to be prepared from tissue from human cadavers. Such preparations of hGH benefited many, but we now understand that they may have also transmitted disease. In fact, a couple hundred cases of a prion disease, CJD, are attributed to transfer of prions by such cadaver-derived hGH.
Perhaps you can guess where this is going. In new work, scientists have examined the brains of people who died of CJD long after receiving such cadaver-derived hGH. They found that some of those brains had evidence of AD pathology. They had levels of AB plaque higher than expected for their age.
Did they have AD? There is no evidence for that. These people had reported no signs of the cognitive decline that is characteristic of AD in a living person. However, they died rather young. It is plausible, though not certain, that these people were on the way to AD.
That's about it. Some people who received fairly crude preparations of human brain protein show some evidence for AD pathology. It is suggestive, but incomplete. The limitations include that there are only a small number of samples, that the people did not have "real" AD, and that there may be alternative explanations for the results. Nevertheless, it is suggestive, and needs follow-up.
What are the implications? One is that we might expect a burst of AD from others who received this treatment, as they age. That's bad, but it is limited, as the treatment is no longer done. (All hGH is now made using recombinant DNA technology, and is highly purified.) Another implication is that we need to take care that surgical instruments do not transmit AD.
Most importantly, if the suggested interpretation holds up, the evidence for AD transmission helps us to understand the disease. Both this work and the broader AD story are incomplete, so any conclusions are tentative at this point.
The following figure shows an example of their results. This figure is not directly related to any of the points made above, but is interesting.
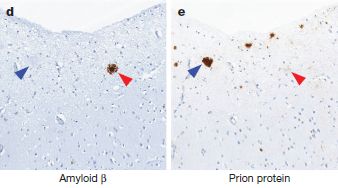
|
The idea here is to see whether the Alzheimer protein (AB) and the prion protein are at the same place in the tissue. In the two frames, consecutive thin slices of tissue are stained for each of the two proteins. The brown regions show where that protein is found. You can see that it is different for the two proteins; the arrows are at the same locations in both frames to help you see that different regions are staining.
|
If the two proteins were found in the same region, it might suggest some interaction between the two diseases. The results provide no evidence for that.
This is Figure 1 parts d & e from the article.
|
News stories. Both of the following stories give good overviews of the work, including its limitations.
* Autopsies reveal signs of Alzheimer's in growth-hormone patients. (A Abbott, Nature News, September 9, 2015.)
* Alzheimer's Transmission Between People? Amyloid Plaques in Hormone Recipients Hint at Prion-like Spread. (AlzForum, September 10, 2015.) This news story was added to replace one that is no longer available.
* News story accompanying the article: Neurodegeneration: Amyloid-β pathology induced in humans. (M Jucker & L C Walker, Nature 525:193, September 10, 2015.)
* The article: Evidence for human transmission of amyloid-β pathology and cerebral amyloid angiopathy. (Z Jaunmuktane et al, Nature 525:247, September 10, 2015.)
Background post about the transmission of AD-like disease in mice: Is Alzheimer's disease transmissible? (February 4, 2011).
More AD:
* The gut microbiome and Alzheimer's disease (April 12, 2024).
* Evidence for transmission of Alzheimer's disease by medical procedures (April 9, 2024).
* Transmissibility of Alzheimer's disease? (June 1, 2016). Overview.
* BRCA1 (the breast cancer gene) and Alzheimer's disease? (February 8, 2016).
My page for Biotechnology in the News (BITN) -- Other topics includes a section on Alzheimer's disease. It includes a list of related Musings posts.
For more about prions, see my page Biotechnology in the News (BITN) - Prions (BSE, CJD, etc). It includes a list of related Musings posts.
How flippase works
September 25, 2015
We know how a chicken crosses the road, even if we aren't sure why. But with sugar chains attached to a lipid carrier, it is the other way around: we know why they cross the cell membrane, but how they do it has been unclear.
What are the sugars for? They get attached to various things, typically proteins on the outside of the cell. It is common that secreted proteins are glycosylated (have sugars attached to them).
How do the sugars get attached to things outside of the membrane? The sugars are made inside the cell. Attaching them is an energy-requiring reaction -- outside the cell.
Part of the process has been known for some time. The sugar is "activated" inside the cell; it's a standard type of biological process to pay the energy bill before it is due. And the sugar is attached to a lipid. The problem is, how do you get the activated sugar outside the cell? The sugar is hydrophilic, and won't easily cross the membrane.
The answer is an enzyme called flippase. It flips the sugar-lipid combo around; the activated sugar end goes from the inside to the outside. (We'll see a diagram in a moment.) The idea of flippase was invented before we knew what it was. Over time, genetic evidence developed that implicated certain genes as coding for the flippase enzyme. But how does flippase work? What does it really do?
A new article offers some evidence, which leads to a model for how one flippase works.
The following figure summarizes the model. Caution: wide figure...
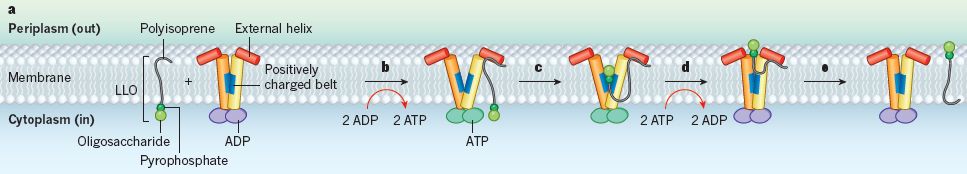
Start with the membrane (labeled at the left). You can see the basic bilayer structure.
The labeling at the left also shows you where the inside and outside of the cell are. (The term periplasm is used. That is a special term used with certain bacteria, those that are "Gram-negative". The periplasm is a compartment outside the cell just beyond the regular cell membrane.)
The first feature just past that labeling is marked as an LLO -- or lipid-linked oligosaccharide. That is that lipid with an activated sugar chain attached, which we noted above. The parts of the LLO are important... At the bottom is a greenish circle for the oligosaccharide (sugar chain). At the top is a curved dark line for the lipid part (labeled "polyisoprene"). Connecting them is a small bluish dot labeled "pyrophosphate"; that is an energy-rich connector.
Big picture... Look at that first LLO, towards the left. The sugar part (the oligosaccharide, green) is inside the cell. Now jump to the extreme right. The last thing shown at the right side of the figure is that same LLO -- but now its sugar part is outside the cell (in the periplasm). It has flipped. That's the point.
How did that happen? That's what the article is about, filling in at least some of the story. The figure shows another player (who is not named in the figure). That is the flipping enzyme, the flippase. (It is the PglK protein from the bacterium Campylobacter jejuni.) The steps along the way give an idea how the scientists think it works.
* a. In step a, we have the two players: LLO and flippase.
* b. Three things happen here. The lipid part of the LLO now binds to the enzyme. See the attachment of the upper end of the LLO to the right-hand red cylinder of the enzyme; that part of the enzyme has a hydrophobic patch, matching the lipid. Also, the enzyme opens up, in a V-shape, open at the top. The enzyme has a blue box labeled "positively charged belt". In b, that is now open. Finally, ATP binds to the enzyme, at the bottom (replacing an ADP). This binding of the energy-rich ATP is associated with the opening of the enzyme.
* c. The pyrophosphate connector of the LLO now binds to that blue box in the enzyme. That box is positively charged. The pyrophosphate is negatively charged. That's easy: the binding is by charge. (How the charged pyrophosphate gets to that binding site in the enzyme is unclear.)
* d. The enzyme closes -- and ejects the part of the LLO that was bound to it. Ejects it to the outside. This step costs energy; the bound ATP is hydrolyzed to ADP.
* e. The LLO comes off the enzyme.
The LLO is now flipped compared to where it started. Energy (ATP) was used. Overall, energy was used to flip the LLO.
This is Figure 1 from the News article in Nature accompanying the article.
|
It's a nice story. Energy is used to control the shape of an enzyme; that is a common type of process. In this case, the cycle of shape changes of the enzyme promotes binding and ejection of one end of the substrate. The ejection occurs in the opposite direction, this promoting the desired flipping reaction.
How did the scientists do all this? A key starting point was that they developed a simple model system for studying the flipping reaction. They used small membrane vesicles, to which they added the flipping enzyme. The system worked; it flipped added LLO. This allowed them to study flipping in a relatively simple well-controlled system. In addition, they were able to study the shape of the enzyme at different stages of the reaction, using X-ray crystallography. Combining the evidence from these two lines of work, and more, led them to propose the model described above.
News story: How lipids are flipped. (Science Daily, August 12, 2015.)
* News story accompanying the article: Structural biology: Lipid gymnastics. (A Verchère & A K Menon, Nature 524:420, August 27, 2015.) The figure shown above is from this news story.
* The article: Structure and mechanism of an active lipid-linked oligosaccharide flippase. (C Perez et al, Nature 524:433, August 27, 2015.)
Recent posts about the function of individual proteins of a biological membrane:
* The iron war (May 17, 2015).
* Designing a less toxic form of an antibiotic (April 19, 2015).
An unusual biological membrane: How do you make phospholipid membranes if you are short of phosphorus? (November 1, 2009).
More about lipids is in the section of my page Organic/Biochemistry Internet resources on Lipids. That section contains a list of related Musings posts.
A post about the bacterium used here, which is best known for its importance in food poisoning: Campylobacter -- how do the chickens feel? (September 6, 2014).
More about isoprene: Interaction of pollution sources: Can the whole be less than the sum of the parts? (March 9, 2019).
A confused chicken: On his right side, he is female (April 24, 2010).
Developments in X-ray crystallography: Doing X-ray "crystallography" without crystals (September 18, 2016).
September 23, 2015
How PBRs survive major earthquakes; why being near two faults may be safer than being near just one
September 22, 2015
What is a PBR? Here's one...
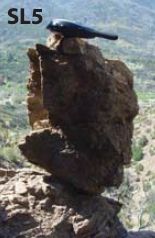
|
This is one of the rocks shown in Figure 2B of the article discussed below.
|
It is a precariously balanced rock -- or PBR. It's just a few miles from the San Andreas fault, a major earthquake fault in southern California. The rock probably has been there for several thousand years, and has been exposed to many major earthquakes.
How is it possible that such a PBR can survive major earthquakes? It has been something of a mystery, one that intrigues seismologists. We now have a new article that suggests an answer.
The simplest argument one might think of is that it's just a matter of luck. However, the numbers make that very unlikely. There are many such rocks, and many large quakes.
Importantly, PBRs near faults are not randomly distributed. They are in certain areas. Is it possible that these PBRs are in areas that, for some reason, experience less ground motion than we expect in a nearby major quake?
What's striking is that the PBRs are in regions very near two faults. That may be the key. The faults are actually connected, and energy is transferred rather directly from one to the other. The authors suggest that the direct transfer of energy between connected faults protects surface features, such as the PBRs. That is, surface motion is reduced because there is more below-surface connection.
If their suggestion holds up, there may be another consequence -- in addition to protecting some rocks. If the faults are more connected than we thought, then a major quake on one of them might cause more damage than we expect, precisely because the quake could more easily jump to the other fault.
One active field in seismology is trying to predict seismic hazards. That means understanding the strain on faults. It also involves predicting how far a quake is likely to propagate. The current work suggests that we may be underestimating that latter point, because faults are more connected than we thought. On the other hand, being right near the connection of major faults may be the safest place around.
News story: Precariously balanced rocks provide clues for unearthing underground fault connections -- San Jacinto, San Andreas interaction weakens earthquake shaking near them. (University of California, Irvine, August 4, 2015.) From the lead institution. Includes a picture of an even more spectacular PBR, though one not related to the current study.
The article: Reconciling Precariously Balanced Rocks (PBRs) with Large Earthquakes on the San Andreas Fault System. (L G Ludwig et al, Seismological Research Letters 86:1345, September 2015.) Note that the term PBR is from the authors.
A recent post about earthquakes: Fracking: the earthquake connection (June 19, 2015).
A post about earthquake predictions: Earthquake: Are the geologists responsible for the damage? (November 17, 2014).
More about earthquakes...
* Another million earthquakes for California (June 30, 2019).
* Earthquakes induced by human activity: oil drilling in Los Angeles (February 12, 2019).
* Detecting earthquakes using the optical fiber cabling that is already installed underground (February 28, 2018).
* Does the moon affect earthquakes? (October 21, 2016).
More intriguing rocks... How rocks travel (November 14, 2014).
The role of combinations of chemicals in causing cancer?
September 21, 2015
Caution... You may be intrigued by the topic here, but then disappointed by how this post ends.
Some cancer is caused by exposure to environmental chemicals. As an example, it's well accepted that tobacco smoke causes lung cancer.
How do we know if a chemical causes cancer? We test it, one way or another. There are various tests at various levels. Some tests are direct, testing for cancer. Some are indirect, testing for something that is thought to correlate with cancer. The Ames test for mutagens is an example of the latter.
There are a lot of chemicals out there, both natural and manmade. Testing for cancer is difficult and expensive. Effects of low doses of chemicals are even harder to find, because the effects are likely to be small. Then... what about combinations of chemicals? Is it possible that combinations of chemicals might be more important than the individual chemicals? Is it possible that chemicals that do not cause cancer on their own can combine to do so?
Our intuition is that there might be such effects. But how could we find them? It is hard enough to test individual chemicals for cancer. Testing combinations of chemicals would seem a daunting task. If there were 100 chemicals of interest, there would be 9,900 combinations of two chemicals. (And there are far more than 100 chemicals of possible interest.)
A new article offers a perspective that may help. Before introducing what the article does, we should emphasize that the authors have done no experiments; the article reports no new test results for any single chemical, much less combinations. It is perhaps a reflection of the state of the field that we note an article which merely offers an approach.
Despite the difficulty that suggests, the idea is simple enough. We have come to understand that the development of cancer requires several steps. A cancer-causing agent may act by enhancing any one of those steps. If two agents act to enhance different steps, then they may have a larger combined effect. That is, the individual chemicals may increase cancer only slightly (or not at all), but the combined effect may be much greater -- and "predictably" so.
The following figure provides a framework...
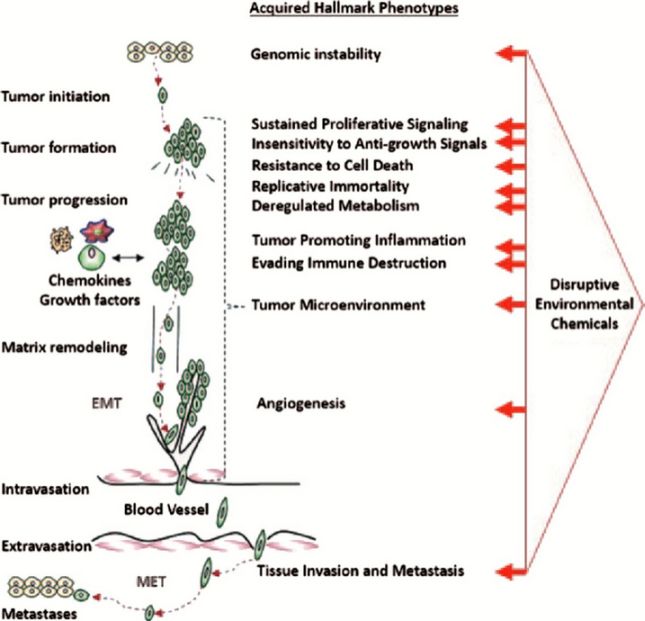
At the left are some major steps in the cancer process. They range from some initiating events on through metastasis. In the middle column are some more specific biochemical events that are associated with cancer. For example, the first two are genomic instability and sustained proliferative signaling (i.e., enhanced signaling for cells to grow). The right hand column contains some red arrows. Those arrows indicate where chemicals may have an effect; you can see that the arrows point to all those biochemical steps in the middle.
It's not important to follow what all those steps are. The point is that we can list many steps in cancer development -- and we can recognize chemicals that affect each of them. That's the framework.
The figure is from the Kurzweil news story. It is probably the same as Figure 1 from the article.
Figure legend from the article... "Figure 1. Disruptive potential of environmental exposures to mixtures of chemicals. Note that some of the acquired hallmark phenotypes are known to be involved in many stages of disease development, but the precise sequencing of the acquisition of these hallmarks and the degree of involvement that each has in carcinogenesis are factors that have not yet been fully elucidated/defined. This depiction is therefore only intended to illustrate the ways in which exogenous actions might contribute to the enablement of these phenotypes."
|
To be more specific... In one part of their analysis, the authors look at 85 chemicals that are not considered carcinogenic. They look at what is known about these chemicals; for 50 of them, there is evidence that they might promote a step in the cancer process -- that they might fit one of the red arrows above. Such analysis can help guide the choice of combinations to study.
One way to summarize the authors' proposal is to say that we use our knowledge of what individual chemicals do to help us predict which may combine together to cause greater effect. I can think of possible limitations of the approach, but remember, the goal is to prioritize testing of chemical combinations. That sounds reasonable.
News stories:
* Cocktail of chemicals may trigger cancer -- Fifty chemicals the public is exposed to on a daily basis may trigger cancer when combined, according to new research by global task force of 174 scientists. (Kurzweil, June 23, 2015.)
* Cocktail of everyday chemicals may trigger cancer. (Nanowerk News, June 23, 2015.)
The article, which is freely available: Assessing the carcinogenic potential of low-dose exposures to chemical mixtures in the environment: the challenge ahead. (W H Goodson et al, Carcinogenesis, Vol. 36, Supplement 1, S254, June 2015.)
The article is part of a special issue -- which has the same title as the current article.
The issue contains a series of reviews; the entire issue is freely available.
The article is long, and even overwhelming. News stories about it typically start by saying that a team of X scientists from Y countries have examined Z chemicals. Numbers! The title (plus subtitle) of the Kurzweil story listed above hints at this. The article itself is over 40 pages; it takes almost four pages to list the authors and their affiliations. It ends with 10 pages listing 508 references. The article tries to organize a huge body of knowledge, and offers a proposal. That's all.
Despite those comments, some may find it interesting or useful to browse parts of the article, starting with the Introduction.
A recent post on the causes of cancer... Why are some types of cancer more common than others? (February 6, 2015).
A post on a chemical that may be an environmental carcinogen... Does dry cleaning cause cancer? (November 30, 2011).
Also see: Is glyphosate (Roundup) a carcinogen? (March 6, 2016).
A post on the effects of low dose radiation: Effect of low dose radiation on humans: some real data, at long last (July 24, 2015). There are similarities in discussing low dose radiation exposure and low dose chemical exposure.
My page for Biotechnology in the News (BITN) -- Other topics includes a section on Cancer. It includes a list of related posts.
Flooding in The Netherlands: natural or manmade?
September 19, 2015
There have been 32 major floods in southwestern Netherlands in the last half-millennium. About a third of them were intentional floods created by humans in the context of war. That's a key finding of a recent article analyzing the nature and impact of flooding in that low-lying country.
The author delved into the historical record, actually for a thousand years, then focused on the last 500 years. He found floods that were natural, but also floods that were induced by man, for both offensive and defensive purposes. The use of floods, as with other weapons, sometimes turned out well, sometimes not. The most recent induced floods discussed are from World War II.
It's an unusual scientific article. You may find it fun to browse.
News story: Floods as war weapons. (Science Daily, June 9, 2015.)
The article, which is freely available: Flooding in river mouths: human caused or natural events? Five centuries of flooding events in the SW Netherlands, 1500-2000. (A M J de Kraker, Hydrology and Earth System Sciences 19:2673, June 9, 2015.)
More about flooding...
* Recovery from natural disaster: can the poor benefit? (July 22, 2011).
* How to survive flooding by making a waterproof raft (May 27, 2011).
More about war...
* Bee wars (March 1, 2015).
* Does the Christ child lead to war? (September 30, 2011). A possible war-climate connection.
Wind... Atmospheric rivers and wind (May 9, 2017).
A biodegradable agent for herding oil slicks
September 18, 2015
One approach to dealing with an oil spill on water, such as in the ocean, is to add an agent that brings the oil together. Such an agent is known as a herding agent. After the oil is herded into a compact area, it can be collected or burnt off.
Commonly used herding agents are synthetic chemicals, whose fate is unclear. Apparently, there is little evidence that they are harmful, but it is an issue of interest.
A recent article reports the development of herding agents based on an abundant natural chemical, phytol.
The following figure shows the chemical structure of one of those proposed herding agents.
The left hand end is a hydrocarbon chain, which is hydrophobic ("hates" water). The right hand end has a charged group, which is hydrophilic ("loves" water). The scientists connect the two by an ester linkage, making use of an -OH group in the phytol.
The two ends, one hydrophobic and one hydrophilic, are typical of such herding agents. One end is insoluble in water; the other end is soluble in water. That combination is called an amphiphile; it is like a detergent. It forms a monolayer on the surface of the water, effectively pushing the oil together.
The ester link makes the connection between the two ends labile, and the phytol itself is biodegradable. That would presumably be the fate of this type of herder.
This is Figure 2B from the article.
|
Here is an example of what the new herding agent can do...
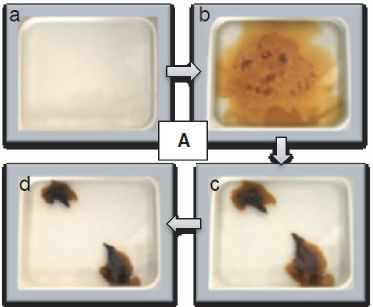
|
This is a sequence of four photographs from an actual experiment in the lab.
It starts with a dish of water (frame a). The scientists add oil, which spreads over the surface, forming a "slick" (frame b). They then add one of their herding agents. It "instantaneously" causes much of the oil to aggregate (frame c); aggregation continues over ten minutes (frame d).
This is Figure 3A from the article.
|
The authors say that their new herding agent, based on a natural product, works about as well as the synthetic ones now in use. It works in both fresh and salty water, and over a wide range of temperature. Perhaps this work deserves to be followed up.
News story: Eco-friendly oil spill solution developed. (Science Daily, June 27, 2015.)
The article, which is freely available: Sacrificial amphiphiles: Eco-friendly chemical herders as oil spill mitigation chemicals. (D Gupta et al, Science Advances 1:e1400265, June 26, 2015.)
Movie. There is a movie file posted with the article, as Supplementary material. It shows a herding experiment, such as that excerpted above. You can watch what happens. But before you do, read what is above so you have some idea of the experimental design; the movie itself has no labeling or sound. It is 5 minutes long. Everything up to 1:28' is just oil on water; most of the action is within the next few seconds (recall frame c above).
More about oil spills:
* Do oil dispersants work? Is biodegradability bad? (January 9, 2016).
* BP oil spill incident: the methane hydrate crystals (May 18, 2010).
More about oil: Oil in the oceans: made there by bacteria (January 3, 2016).
More about biodegradability... Polystyrene foam for dinner? (October 19, 2015).
More about herding... Got milk? (October 13, 2008).
More about hydrophobic materials... Water droplets on a trampoline (April 9, 2016).
September 16, 2015
Chagas: the guinea pig connection
September 15, 2015
Briefly noted...
Chagas disease is prevalent in some areas of tropical South America. Incidences as high as 40% are found in some communities.
Chagas is caused by a protozoan, Trypanosoma cruzi; it is transmitted by a beetle-like insect known as the kissing bug.
Epidemiological evidence has suggested a connection between the disease and guinea pigs. However, the role of the guinea pigs has been a mystery. A new article offers a possible explanation, at least for one village. It's about the price of alfalfa.
Here's the idea... When the price of alfalfa rises, it becomes too expensive to keep feeding the guinea pigs. So the villagers have a feast -- and eat the guinea pigs. The guinea pigs are an alternative host for the parasite. The feasting time reduces the guinea pig population. In some cases, this leads to small populations with high incidence of infection. That in turn enhances the infection of the insect vector, which transmits the parasite to humans. It's a complex web of interactions, with feedback loops that lead to enhanced transmission -- triggered by a rise in the price of alfalfa.
The evidence is mainly indirect. The proposed model is a hypothesis with limited evidence, but perhaps it is a useful start that can guide further work. It's interesting to read how the authors explored the question. And they do suggest a solution: a price ceiling for alfalfa could reduce the incidence of Chagas disease. It's testable.
News stories:
* Possible explanation for high incidence of Chagas in some Peruvian communities. (B Yirka, Phys.org, June 18, 2015.)
* Guinea pig feasts may explain high rates of deadly parasite in Peru. (L Wade, Science magazine, June 16, 2015.)
The article: Bottlenecks in domestic animal populations can facilitate the emergence of Trypanosoma cruzi, the aetiological agent of Chagas disease. (M Z Levy et al, Proceedings of the Royal Society B 282:20142807, July 2015.)
More about trypanosomes: Why African-Americans have a high rate of kidney disease: another gene that is both good and bad (August 17, 2010).
More about guinea pigs:
* Why don't black African mosquitoes bite humans? (December 19, 2014).
* and maybe Golden rice as a source of vitamin A: a clinical trial and a controversy (November 2, 2012).
Early detection of brain damage in football players? A breakthrough, or not?
September 14, 2015
Caution, this is a controversial story. If it were just science, it would be a good science story, a finding that is both exciting and preliminary. But this is not just a science story.
Athletes, such as those who play (American) football, get hit in the head. They may suffer what is called traumatic brain injury (TBI). Some people appear to be fine soon after the injury, and they return to normal competition. However, there is a risk of long term -- and cumulative -- damage. That may be called chronic traumatic encephalopathy (CTE), and is serious.
Musings briefly noted the topic long ago [link at the end]. It has since exploded into a huge issue, with major precautions being taken at all levels of football, especially for children. There has also been legal action and a major settlement involving the (US) National Football League.
The big question is, how do we tell what's going on in the person's brain -- before it gets too serious? The current diagnosis of CTE is at autopsy. It's about the same situation as with Alzheimer's disease, where simply studying the condition is hampered by the lack of diagnosis.
A recent article reports a method for diagnosis of mild TBI (or mTBI).
mTBI is a somewhat confusing term, which the article uses almost synonymously with "suspected CTE".
The method is based on a common type of procedure, a PET scan. What the authors have done is to modify the PET scan method, and then focus on certain measurements. These measurements, they claim, distinguish people with mTBI from normal controls.
The article contains plenty of PET scan images, for those who might like the raw images. More useful for most of us is a summary...
|
The PET scan yields a measurement called the distribution volume ratio (DVR). This can be calculated for various regions. The graph shows how the values for two brain regions are related for a single person. That is, each point is for one person; it shows the two measurements for that person.
There are two groups of people tested here. For now, let's just call them blue-dot people and green-dot people.
It is clear that the blue-dot people and the green-dot people give quite distinct results. With their PET scan method, the scientists can distinguish blue-dot people from green-dot people with 100% accuracy. (If you prefer... they can distinguish people with blue-dot brains from those with green-dot brains.)
This is Figure 1A from the article.
|
The graph above shows the measurements for two regions of the brain: the amygdala (y-axis) and the dorsal midbrain (x-axis). The full figure in the article includes analyses using two other brain regions; each is also compared to the dorsal midbrain. The summary is the same: complete separation of the results for blue-dot and green-dot people.
They go further. Later in the article, the scientists included red-dot people in the study. They showed that they can distinguish all three types of people (blue-, green- and red-dot people), with (almost) 100% accuracy, using their PET scan measurements.
Who are these color-coded people? Green dots are for people with mTBI. Blue dots are for "normal" controls. (And red dots are for people with Alzheimer's disease (AD). We'll largely ignore the AD part of the study, for simplicity.)
So it seems that the scientists have a method that does an excellent job of diagnosing mild traumatic brain injury. That would indeed be a welcome development.
But there is a catch. And it might even be clear from reading what is written above. The authors suggest they have a method that can diagnose mTBI with 100% accuracy. However, mTBI (or "suspected CTE") is currently not diagnosable. How do the scientists know who has mTBI if there is no current way to diagnose it? Fishy, isn't it? And it is a big part of why the work is controversial.
The authors are, of course, aware of the concern. They go to great care to explain their choice of subjects for the study. That is really where this article comes under scrutiny, and it is hard to know. The authors have been bold in classifying the subjects. Perhaps they are largely right, and their boldness has allowed them to make progress. Or perhaps they aren't right. Only further work can sort that out.
The article also raises concerns about possible conflicts of interest. You can read the original and corrected statements, and you will see it discussed some in the news coverage. But be careful. A conflict of interest is a source of possible bias. It does not make the work wrong. The classification of the subjects in this work is an issue, and it is enhanced by possible conflicts of interest. But the solution is further work. That includes thorough discussion of the classification of subjects, an issue that is inherently difficult. And of course it includes replication of the findings. Ultimately, the work will rise or fall based on its merit; it may take a while to find out.
News stories:
* Characteristic pattern of protein deposits in brains of retired NFL players who suffered concussions. (Science Daily, April 6, 2015.) Based on a press release from the lead institution. The top of this page shows examples of the PET scan images for the three types of people studied.
* FDA says no to marketing FDDNP for CTE. (The Neurocritic, April 26, 2015.) A story that emphasizes concerns about the work, beyond the article itself. Useful for context. Be sure to make the distinction between research work and getting a medical procedure officially approved.
The article: In vivo characterization of chronic traumatic encephalopathy using [F-18]FDDNP PET brain imaging. (J R Barrio et al, PNAS 112:E2039, April 21, 2015.) The article has a "Correction"; if you get the pdf file, it is the first page. The correction involves the conflict of interest statements. You might also read the original conflict of interest statement, in the footnotes on the first page of the article.
FDDNP, in the article title? It's an abbreviation for the imaging agent used in their PET scan work. The F is for fluorine, and the [F-18] in front of the name shows that the chemical contains this specific isotope of fluorine. F-18 emits positrons; that is what is detected in a PET scan. The particular imaging agent has been developed to identify regions of protein aggregates.
Background post: This topic was briefly noted in an earlier post... Athletes: Head injuries (October 5, 2009).
For more on PET scans:
* Traumatic brain injury: long term effects? (October 8, 2019).
* Can we predict the proper treatment for depression? (June 24, 2013).
* Effect of cell phone on your brain (April 11, 2011).
More on fluorine: Breaking C-F bonds? (October 26, 2018).
More on brain injury from football: Evidence for brain damage in players of (American) football at the high school level (August 23, 2017).
A post on rapid detection of brain injury... Measuring brain injury after head trauma? (April 25, 2016).
More about tau: Alzheimer's disease: What is the role of ApoE? (November 6, 2017).
Some sections of my page Biotechnology in the News (BITN) -- Other topics are relevant here. Each has a list of related Musings posts.
* Brain (autism, schizophrenia).
* Alzheimer's disease.
* Ethical and social issues; the nature of science.
There is now an extensive list of sports-related Musings posts on my page Internet resources: Miscellaneous under Sports.
More positrons: The major source of positrons (antimatter) in our galaxy? (August 13, 2017).
Hydrogen sulfide and superconductivity -- update
September 12, 2015
Original post: What's the connection: rotten eggs and high-temperature superconductivity? (June 8, 2015). On July 15, we added a brief note at the end, with some new information.
Briefly, the story is that hydrogen sulfide has been shown to act as an electrical superconductor at higher temperatures than found previously for any substance. It seems likely that the actual superconducting material is not H2S itself, but a reaction product under the high pressures used, likely H3S.
The work has generated much excitement, but so far all we have had are preprints posted at ArXiv. We now have a formally published article. The more recent article posted at ArXiv, noted in the July 15 addendum, has now been published in Nature. There is no new content, but the news stories are new. The one from Nature News notes the very limited independent replication of the work so far, based on informal inquiry of those likely to be able to do so. I should add that the information on this point here is somewhat different from what the same author said in his previous news story. A caution to keep in mind.
I am listing the new items here, but will also add them to the original post as another addendum. Remember, if you cannot access the Nature article, the versions posted at ArXiv are freely available. The news stories in Nature are freely available; they link to the ArXiv items.
News stories:
* New temperature record: Hydrogen sulfide becomes superconductive under high pressure at minus 70 degrees Celsius. (Phys.org, August 18, 2015.)
* Superconductivity record sparks wave of follow-up physics. (E Cartlidge, Nature News, August 17, 2015.) Includes a useful list of references to the related articles.
* News story accompanying the article: Superconductivity: Extraordinarily conventional. (I I Mazin, Nature 525:40, September 3, 2015.)
* The article: Conventional superconductivity at 203 kelvin at high pressures in the sulfur hydride system. (A P Drozdov et al, Nature 525:73, September 3, 2015.)
Penidiella and dysprosium
September 11, 2015
Penidiella is a fungus. It's similar to common molds you might see on some bread or cheese; this mold has the interesting feature that it grows well under quite acidic conditions.
Dysprosium (Dy) is chemical element #66. It's in that group of elements often shown as a "footnote" at the bottom of the periodic table, the lanthanoids. Biologists may not have even heard of Dy; in fact, the whole group of lanthanoids is commonly considered non-biological.
Terminology... Lanthanoids are also called lanthanides. The first term is now preferred, but both are used. The term rare earth elements includes the lanthanoids plus two chemically similar elements above them in the periodic table: scandium and yttrium.
What happens if you put Penidiella mold in a solution containing dysprosium? Let's look at what was reported in a recent article...
|
The graph shows the concentration of Dy in the solution (y-axis) versus time (x-axis).
Look at the solid curve (filled symbols). The concentration of Dy starts at 100 mg/L; over about 3 days, it is reduced to about half.
A control sample, with no mold, showed no significant change. That's the dashed line (open symbols).
The Dy was provided in the form of a soluble salt, dysprosium(III) chloride, DyCl3.
This is Figure 4 from the article.
|
Analysis of the mold, called strain T9, showed that is was about 50% Dy! Imagine that, a mold that is half dysprosium.
How did the scientists find this mold? They actually went looking for something that would accumulate Dy under acidic conditions.
Why would they want such a thing? Well, Dy has become quite a valuable metal, and the supply is low. The idea of using a biological process to aid in recovering Dy has some appeal. This could apply either to mining Dy from natural sources, or to recovering it during recycling operations.
Dysprosium is an interesting magnetic material, used in various devices of our modern world, including hard drives and electric vehicle motors. The Wikipedia page for the element summarizes its story, including its uses -- and concerns about an impending shortage as demand increases. Wikipedia: Dysprosium.
Why would the mold do this? What's in it for the mold? There in no information on this at this point. It may be that the Dy3+ ions are just binding to the outside of the cellular material.
If it is just ionic bonding to the cell surface, wouldn't it bind all sorts of metal ions? Interesting question. It depends on what it is binding to. What we need is some data... The scientists tested some other metal ions. The strain did bind most of the other lanthanoids that were tested. However, it did not bind the ions of aluminum, gallium, manganese, cobalt, zinc, or copper. If that is all really true, it's rather encouraging. There are production issues with most of the lanthanoids; a material that accumulates many of them, and separates them from non-lanthanoids, could be useful.
This is an incomplete story, as so often for a novel finding. Is it likely that the Penidiella mold will be useful in the recovery of dysprosium or other lanthanoids? The results here are sufficiently encouraging to warrant further work. Ultimately the choice of a process depends on economics, so this would compete against alternatives. We might add that the work here could be taken as encouragement to go back to nature and look for more candidates. The article opens our eyes to the possibility that there is more biology of the lanthanoids than we suspected.
News story: On Lanthanum & Co. (M Schaechter, Small Things Considered (American Society For Microbiology), May 3, 2015.) In this delightful item, Schaechter goes beyond the article at hand and discusses other recent work on the biology of the lanthanoid elements. In one case, it was found recently that an enzyme requires a lanthanoid ion. A novel finding!
The article: A New Fungal Isolate, Penidiella sp. Strain T9, Accumulates the Rare Earth Element Dysprosium. (T Horiike & M Yamashita, Applied and Environmental Microbiology 81:3062, May 2015.)
Previous posts about dysprosium: none. (That may hold for all the lanthanoids.)
Subsequent posts about REE:
* Extraction of rare-earth metals: a bacterial assist (February 8, 2022).
* Briefly noted... A terbium detector (January 19, 2022).
* Y-Y: the first (May 5, 2019).
* Information storage: One atom, one bit (May 15, 2017).
* Coal: a new source of rare earth elements? (April 6, 2016).
This post is listed on my page Introductory Chemistry Internet resources in the section Lanthanoids and actinoids. This section was added more recently, and is maintained as 'complete'.
Previous posts about Penidiella: none.
However, there have been some recent posts about other molds of the same broad group of fungi as Penidiella. It is an ascomycete fungus, as are the subjects of the following posts:
* On genome duplications (September 10, 2015). Saccharomyces, the common yeast. This is the post immediately below.
* What's the connection: blue cheese, rotten coconuts, and the odorous house ant? (August 24, 2015). Penicillium, here in the context of two of the things listed in the title of the post.
More about hard drives: Progress toward an ultra-high density hard drive (November 9, 2016).
Also see...
* Bacteria that make atomic copper (May 8, 2021).
* Manganese(I) -- and better batteries? (March 21, 2018).
On genome duplications
September 10, 2015
When the genome of the common yeast, Saccharomyces cerevisiae, was sequenced, it was found that some parts of the genome appeared double. Somewhere along the line, the genome apparently had undergone a complete duplication. In fact, such "whole genome duplications" are found in diverse organisms, including vertebrates. It's a "quick" way to get more genes; the extra copies are free to take on new functions, or to get lost.
How does genome duplication occur? In general we don't know, but two scenarios are plausible...
1) The genome, literally, doubled, because of some unusual cell division event. (Remember, genome duplication occurs during every cell cycle. But genome duplication is quickly followed by cell division, restoring the original genome in each cell.)
2) Two organisms with similar genomes hybridized, and for some reason ended up forming a new organism with a combined, doubled genome.
In neither case do we understand why the event might have happened; both scenarios involve some unusual event.
So, which was it? As you might imagine, we have no direct evidence on the matter. For reasons that aren't very important, scenario 1 has become widely accepted.
A new article now provides evidence for scenario 2. It's based on an interesting prediction about the consequences of the scenarios.
Consider the initial cell of the new organism with the expanded genome. There is an interesting difference in its genetics under those two scenarios. In scenario 1, the duplication leads to a cell with two identical copies of everything. In scenario 2, the fusion leads to a cell with two similar copies of things, but no specific prediction beyond that. That is, in scenario 2, the two genomes are merely "similar", but how similar depends on the details.
Why do they have to be "similar"? Because the two genomes seem to be compatible enough to form a viable hybrid. You don't buy that? That's fine. Maybe they don't have to be so similar. That doesn't change the basic idea; in fact, it expands the range of possibilities.
What's the new evidence? Detailed analysis of duplicated genes in yeast suggests that the genes are older than the organism. That is, the genes had already diverged when the duplication occurred. That's consistent with scenario 2, but not scenario 1.
How strong is the data? Well, people will quibble about that. Estimates of age from genetic data often have huge uncertainties. Perhaps what this article does is to make us re-examine scenario 2.
Scenario 2 has an interesting "advantage". Since the initial organism with the duplicated genomes has gene sets that have already diverged, there really are (or, at least, may be) new genes when the hybrid forms. If they are beneficial to the organism, they could show their benefit right away. In scenario 1, the gene sets are identical at the time of genome expansion; any benefit would come later. It's important to note that this argument proves nothing. It certainly does not prove what happened. It simply notes a difference in how the two scenarios could play out.
Does the argument apply to other genome duplications? That must remain an open question, pending some data. There is nothing that precludes both scenarios from operating.
News stories:
* In a Rethink of Yeast's Double Genome, Ancient Mating Is an Idea on the Rise. (GEN, August 10, 2015. Now archived.)
* Studying yeast provides new insight to genome evolution. (Centre for Genomic Regulation (CRG), Barcelona, August 7, 2015.) From the lead institution. The page links to a press release that is available in English, Spanish, and Catalan.
* News story accompanying the article. It is freely available: Origin of the Yeast Whole-Genome Duplication. (K H Wolfe, PLoS Biology 13(8):e1002221, August 7, 2015.) Good overview of the work and its implications. If you want more than the news stories, give this a try, even if you skip some of the more technical parts.
* The article, which is freely available: Beyond the Whole-Genome Duplication: Phylogenetic Evidence for an Ancient Interspecies Hybridization in the Baker's Yeast Lineage. (M Marcet-Houben & T Gabaldón, PLoS Biology 13(8):e1002220, August 7, 2015.)
A post that notes the issue of genome duplications: Who is #1: the most DNA? (March 7, 2011).
* Previous post about yeast:
Do human genes function in yeast? Yeast-human hybrids. (August 21, 2015).
* Next: How to confuse a yeast -- a sensory illusion (January 15, 2016).
More ascomycetes... Penidiella and dysprosium (September 11, 2015). This is the post immediately above.
There is more about genomes and sequencing on my page Biotechnology in the News (BITN) - DNA and the genome. It includes an extensive list of related Musings posts.
September 8, 2015
An exoskeleton that assists with walking but does not require an external energy source
September 8, 2015
We have noted development of exoskeletons intended to assist humans [link at the end]. Such devices can help people with muscular disabilities, but they can also give a boost to "normal" people. In fact, one of the first applications of the exoskeleton was for use by the military.
The exoskeleton devices discussed so far have included a power supply. We now have a report of an exoskeleton without a power supply. It captures energy we don't use the first time, and uses it later. It makes us more efficient.
The figure at the right shows the device attached to each leg of a person.
This is Figure 1b from the article.
|
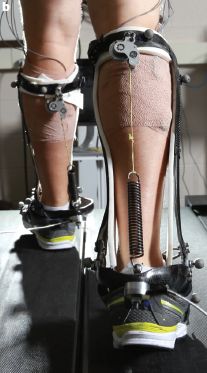
|
Those springs are the key to the device. The springs are closely coupled to the leg muscles, but only during part of the walking cycle, because of a clutch. One key to making the device work is getting the spring stiffness right.
Here are some results, showing how the energy requirements of a person can be reduced by the device, with properly adjusted springs. In the test, people walked on a treadmill, with or without the exoskeleton device. When wearing the device, they were tested with a range of spring stiffnesses.
|
The graph shows the metabolic rate (y-axes) vs the spring stiffness (x-axis). The results shown are the averages from nine able-bodied individuals.
We'll fill in some details in a moment, but the big picture is that there is a minimum, at intermediate stiffness. At this minimum, people are walking with about 7% greater efficiency.
|
To clarify the graph...
There are two y-axis scales, but it is all the same data, just labeled two ways. The left axis shows the "net" metabolic rate for walking, in watts per kilogram. (Net? It's the measured metabolic rate during walking, minus the basal metabolic rate not walking. It is thus the metabolic rate for walking.) The right scale shows this as a percentage change from the base case.
The two bars at the left are controls. The bar labeled NE means "no exoskeleton". The bar labeled zero means that the person wore the device but with the spring removed. The results for these two controls are essentially the same.
This is Figure 3 from the article.
|
A 7% increase in efficiency may seem small. It's like removing 10 pounds (4 kilograms) from your backpack. (The device weighs about a pound per leg.) Under some circumstances, the small improvement may be useful.
There is another message from the work: the efficiency of human walking can be improved. Nature has not optimized it. Of course, this story may be incomplete. Perhaps Nature has optimized it, but in another way, which we don't recognize. Or perhaps the current work can be extended to yield further improvement. As so often, a scientific development leads to more questions.
News stories:
* Springing ahead of nature: Device increases walking efficiency. (Science Daily, April 1, 2015.)
* Exoskeletons: Reducing the Energy Costs of Human Walking. (S Strander, Dartmouth Undergraduate Journal of Science, April 12, 2015. Now archived.) Posted by a student; nicely done!
Movies:
* There is a nice video overview of the work, narrated by one of the authors. It is linked to the end of the Science Daily news story. (3 minutes.)
* There are two short movie files posted with the article as Supplementary Information. Video 1 shows the general operation of the device; video 2 focuses on the details of the clutch. (Video 1: 30 seconds. no sound. Video 2: 1 minute, narrated.)
The article: Reducing the energy cost of human walking using an unpowered exoskeleton. (S H Collins et al, Nature 522:212, June 11, 2015.) Check Google Scholar for a freely available copy of the preprint.
Background post about exoskeletons for human use: Berkeley Bionics: From HULC to eLEGS (October 22, 2010).
More... Personal optimization of an exoskeleton (September 22, 2017).
Also see my Biotechnology in the News (BITN) page for Cloning and stem cells. It includes an extensive list of Musings posts in the fields of stem cells and regeneration -- and, more broadly, replacement body parts, including prosthetics.
More about walking: An animal that walks on five legs (February 3, 2015).
More exoskeletons: How do you breathe while changing your skeleton? (October 31, 2014).
After Ebola, what next? and how will we react?
September 5, 2015
The West Africa Ebola outbreak seems to be winding down. It's not over, and we're not sure where virus is hiding, but the current case count is tiny. Liberia has just been declared Ebola-free -- for the second time. Mop-up will continue, but it is a time for optimism.
It has been the worst Ebola outbreak in recorded history. It was enhanced by being in an area with no previous experience with the disease, and with a higher population density than in previous outbreaks. Response was slow, both locally and from the international community.
What have we learned? What will we do in the next disease outbreak?
Next outbreak of what? That is the first interesting question, and one that we cannot answer. The Ebola outbreak took us by surprise; the next disease outbreak probably will, too. If the same outbreak occurred again, we would deal with it much better, because of the experience, and the additional tools such as the new vaccine. But we don't know what or where the next disease outbreak will be. We can only make a list of candidates, at least candidates that we know about. We can prepare for some of them. We can also make generic plans for how to deal with outbreaks that catch us by surprise -- as they surely will. How do deal with them quickly.
A recent issue of the journal Nature had a section "Ebola: Did we learn?"; it was featured on the cover. Nature is not alone in addressing these questions, while the waning Ebola is still on our mind. (How quickly will we forget?) I encourage you to look over the section.
Here is one of the stories in that feature section, perhaps the central one on the theme of learning and preparing. You can browse the table of contents of the issue for more. All are freely available, I think.
* The next time: The world is ill-prepared for the next epidemic or pandemic. But the horror of the Ebola outbreak in West Africa may drive change. (D Butler, Nature 524:22, August 6, 2015.)
A recent post on Ebola: An Ebola vaccine: 100% effective? (August 7, 2015).
More: Ebola survivors: are they a risk to others? (June 5, 2016).
A recent post on one of those other diseases that might worry us: In the shadow of Ebola: The story of Lassa virus (August 26, 2015).
One major player...
* WHO: We need to prepare for Disease X (May 13, 2018).
* The role of WHO: the view of its director (December 1, 2015).
There is a section on my page Biotechnology in the News (BITN) -- Other topics for Ebola and Marburg (and Lassa). That section links to related Musings posts, and to good sources of information and news. There is also a section there on Emerging diseases (general).
Autism in a dish?
September 4, 2015
We can now make stem cells from the skin cells of an individual. These are iPSC: induced pluripotent stem cells, capable of differentiating in the lab into various cell types. We can now take those iPSC and develop mini-organs, called organoids.
If you take skin cells from people with autism, and use those in the lab to make iPSC and then mini-brain organoids, those organoids show characteristics of autism.
Here is an example...
|
This graph shows the number of a certain type of synapse formed in the organoids from normal and autistic donors. (The autistic donors are referred to here as probands. The term can be taken to mean person with the condition.)
It is clear they are very different.
This is Figure 3 part I from the article.
|
There are very few samples here: only two donors in each group. I chose to show this graph because the result is so clear. This graph just gets us started; it is an example. The article contains tests of various characteristics, and uses four donors overall. (And the controls were the fathers of the patients.) The result shown here is typical: organoids from control and autistic donors have characteristic differences.
The cause of the donors' autism is not known, but the cases are independent, and are likely to have independent causes. They do all share one feature: they are from cases of autism with an enlarged brain. That is, they represent one sub-class of autism; otherwise, they seem to be independent cases. However, the resulting lab-derived brain organoids show similar features.
Some of the features found in the organoids from autistic donors seem autism-related. For example, the synapses counted in the graph above are a type of inhibitory synapse that is enhanced in autism; the organoids recapitulate that enhancement. More detailed study shows they share specific molecular changes, even though there is nothing in the known genetics to suggest why. In fact, reducing the expression of one over-expressed regulatory gene reduces the imbalance in neuron types that was seen with the autism-derived organoids. That could be a clue about what is going on during brain development.
It's an intriguing development, made possible by work with stem cells and organoids. Special lab cultures derived from people with independent cases of autism seem to show common autism-related features. Perhaps this will be a useful system for studying autism. The current result is for one sub-class of autism; how it extends to other types of autism is an open question for now.
News stories:
* Miniature brain organoids made from patient skin cells reveal insights into autism. (Kurzweil, July 16, 2015.)
* Mini Brains Model Autism -- Patient-derived organoids reveal autism spectrum disorder-associated anomalies. (R Williams, The Scientist, July 16, 2015.)
The article: FOXG1-Dependent Dysregulation of GABA/Glutamate Neuron Differentiation in Autism Spectrum Disorders. (J Mariani et al, Cell 162:375, July 16, 2015.)
Previous post on autism: Can we make sense of the many genes involved in autism? (January 16, 2015).
Next: The autism-Angelman connection: a single enzyme involved in two brain disorders (November 9, 2015).
Previous post on brain (or "cerebral") organoids: Artificial brain-like structures grown from human stem cells in the lab (October 1, 2013).
And then... How much would it cost to make a brain? (November 1, 2015).
More organoids (and such):
* Multi-organ lab "chips" (April 14, 2018).
* Human heart organoids show ability to regenerate (May 2, 2017).
* An organoid for the gut: at last, a culture system for norovirus (October 30, 2016).
My page for Biotechnology in the News (BITN) -- Other topics includes a section on Autism. It includes a list of related posts.
Also see my BITN page for Cloning and stem cells. It includes an extensive list of Musings posts in the field.
Effect of artificial lighting on the environment
September 3, 2015
Sometimes we express concern that human activity affects "nature". For example, there is concern that use of underwater sonar may affect marine animals, such as whales.
Have you ever thought about how artificial lighting affects other animals? Does the lighting in a harbor affect the animals in the water? A new article reports that it does.
The scientists developed a controlled test, though it was done in a natural environment (Menai Strait, UK). They put standard surfaces under the water at a particular position. They provided controlled lighting, at levels similar to what is found in well-lit harbor areas. After a period of time, they examined the surfaces. Depending on the organism, the scientists either counted the number of organisms attached or the surface area that was covered by attached organisms. They examined a variety of invertebrates.
Here is a sample of what they found...
|
The graphs here show the effect of artificial lighting on the attachment of marine animals to surfaces in the water.
Each graph is for one type of animal.
The three bars are, left to right: no lighting (dark gray), low lighting (light gray), high lighting (clear).
The examples shown here include cases where lighting increases attachment, decreases attachment, or has little effect. The asterisks indicate that the result is statistically different from the control with no lighting.
This is the lower left part of Figure 1 from the article. The full figure contains results for nine species; there is more in Figure 2.
|
Conclusion: artificial lighting may affect how marine invertebrates attach to underwater surfaces. The effect may be in either direction, depending on the animal.
That general conclusion should not be a surprise. It is well known that many of these organisms are affected by light. Now it is documented, in the context of artificial lighting. Further, the test system can be the basis for further work, perhaps testing the effect of suggested changes in lighting procedures.
An interesting comment in the article is that LED lighting may be a particular concern. It has a wider spectrum that lights commonly used before. Further, the lower energy consumption may encourage additional lighting.
So... Do we light the bridge because it improves traffic safety? because it looks pretty?
News stories. They include some discussion of the possible consequences.
* Harbour light 'attracts ship-damaging creatures'. (R Morelle, BBC, April 29, 2015.)
* Coastal light pollution disturbs marine animals, new study shows. (Science Daily, April 29, 2015.)
The article: Night-time lighting alters the composition of marine epifaunal communities. (T W Davies et al, Biology Letters 11:20150080, April 2015.)
A post about the effect of sonar on whales: Effect of simulated sonar on whale behavior (March 16, 2014).
A post about a possible use of underwater lighting: Why might it be good to put lights on fish nets? (September 9, 2013).
A post that raises the issue of the effect of lighting on us: Does it matter when you eat? Or whether you leave a light on at night? (December 1, 2010). Use of artificial lighting may affect humans, too. It disturbs our natural circadian rhythm. The implications are not clear, but are of concern to some. (Artificial lighting is a serious problem for astronomers, because they depend on a dark sky for some of their observations.)
Posts about lights include:
* Effect of LED street lights on insects (September 4, 2021).
* How to light a cave (August 30, 2021).
* CFL and LED lights: energy-efficient, but toxic (March 3, 2013). The current work used LED lights. They chose that in part because they considered it the most likely lighting type for the future.
Light pollution... A world atlas of darkness (July 29, 2016).
More on pollution: Deaths from air pollution: a global view (October 23, 2015).
My page of Introductory Chemistry Internet resources includes a section on Lighting: halogen lamps, etc.
How rice leads to global warming, and what we might do about it
September 2, 2015
Growing rice is a significant source of the potent greenhouse gas methane. Why? Because rice diverts a substantial amount of its productivity to the roots, and much ends up outside. In the water-laden environment associated with traditional rice growing, oxygen is depleted, and the organics get converted to methane by microbes.
What if we could get rice to put more of it resources into the above-ground parts, including the starch grains we eat, and less into excessive root materials?
A new article reports doing just that.
Here are two rice plants...

|
The one on the left is a common rice used in agriculture.
The one on the right has been modified to grow better,
It does. And the article contains quantitative data to support the claim.
This is from the news story listed below. It is probably the same as Figure 2a from the article.
|
Methane? Here are some data, for those two strains...
|
The graph shows methane emission for the parent and new strains of rice, at three times.
At each time point, the left (blue) bar is for "Nipp", the parental strain. The right (reddish) bar is for SUSIBA2-77, the new strain.
The bar height represents the methane emission. [It is in mg/(m2h). m2 of what? Not sure; I don't think it says.]
I'm also not sure what "heading" means, but it is clearly an early time point. For the other two times, "daf" apparently means "days after flowering".
|
The results are clear: in each case, the new strain produces less methane than the parental strain. Much less.
This is part of Figure 1a from the article.
|
The results above establish that the idea is sound. It is possible to make a rice that allocates its resources to make more of what we want (starch) and less of what we don't (leading to methane).
How did the scientists do this? In this case, they moved a regulatory gene from barley to rice. The gene was thought to have the desired effect in barley; it was a good question whether the effect would carry over if it were moved to rice. It worked.
Is this a good idea? Is the current strain a good candidate for field use? Modifying plants or animals so they do more of what we want has been routine for thousands of years. In this case, the scientists suggest a goal, and show that it can be achieved. What are the limitations or consequences? Are there conditions under which the new strain does less well than the traditional strain? No concerns are evident in this work, but further work must examine those questions. What this article does is to open up a pathway for further work.
News story: Researchers engineer first low-methane-emission, high-starch rice; benefits for GHG control, food and bioenergy. (Green Car Congress, July 30, 2015.) Excellent.
* News story accompanying the article: Sustainability: Bypassing the methane cycle. (P E Bodelier, Nature 523:534, July 30, 2015.)
* The article: Expression of barley SUSIBA2 transcription factor yields high-starch low-methane rice. (J Su et al, Nature 523:602, July 30, 2015.) Check Google Scholar for a freely available preprint.
Previous post about rice: How rice recognizes a Xoo infection (August 28, 2015).
Posts about the characteristics of various rice strains...
* A perennial rice (March 4, 2023).
* Rotavirus: passive immunization via food (January 10, 2014).
* DEEPER ROOTING leads to deeper rooting -- and to drought tolerance (August 16, 2013). This post and the current one may seem to be at odds. This post is about the advantages of having more roots, whereas the current one aims for less roots. Different questions, different answers.
* Golden rice as a source of vitamin A: a clinical trial and a controversy (November 2, 2012). The article behind this post has been retracted, but the topic stands.
* What to do if you are about to drown (September 23, 2009).
Previous post about the microbial production of methane: More from the artificial forest with artificial trees (August 31, 2015). In that post, methane production was the goal; in the current case, it is to be minimized. Context matters.
A recent post about methane as a greenhouse gas: Boston is leaking (February 13, 2015).
Posts about climate change include...
* Was there a significant slowdown in global warming in the previous decade? (May 30, 2017).
* Is the weather getting better or worse? (May 23, 2016).
More about agricultural biotechnology is on my Biotechnology in the News (BITN) page Agricultural biotechnology (GM foods) and Gene therapy. It includes a list of related Musings posts.
Top of page
The main page for current items is Musings.
The first archive page is Musings Archive.
E-mail announcements -- information and sign-up: e-mail announcements. The list is being used only occasionally.
Contact information
Site home page
Last update: June 3, 2026