Home
> Musings: Main
> Archive
> Archive for May-August 2015 (this page)
| Introduction
| e-mail announcements
| Contact
Musings: May-August 2015 (archive)
Musings is an informal newsletter mainly highlighting recent science. It is intended as both fun and instructive. Items are posted a few times each week. See the Introduction, listed below, for more information.
If you got here from a search engine... Do a simple text search of this page to find your topic. Searches for a single word (or root) are most likely to work.
Introduction (separate page).
This page:
2015 (May-August)
August 31
August 26
August 19
August 12
August 5
July 29
July 22
July 15
July 8
July 1
June 24
June 17
June 10
June 3
May 27
May 20
May 13
May 6
Also see the complete listing of Musings pages, immediately below.
All pages:
Most recent posts
2026
2025
2024
2023:
January-April
May-December
2022:
January-April
May-August
September-December
2021:
January-April
May-August
September-December
2020:
January-April
May-August
September-December
2019:
January-April
May-August
September-December
2018:
January-April
May-August
September-December
2017:
January-April
May-August
September-December
2016:
January-April
May-August
September-December
2015:
January-April
May-August: this page, see detail above
September-December
2014:
January-April
May-August
September-December
2013:
January-April
May-August
September-December
2012:
January-April
May-August
September-December
2011:
January-April
May-August
September-December
2010:
January-June
July-December
2009
2008
Links to external sites will open in a new window.
Archive items may be edited, to condense them a bit or to update links. Some links may require a subscription for full access, but I try to provide at least one useful open source for most items.
Please let me know of any broken links you find -- on my Musings pages or any of my regular web pages. Personal reports are often the first way I find out about such a problem.
August 31, 2015
More from the artificial forest with artificial trees
August 31, 2015
A Berkeley group has been developing a system for artificial photosynthesis. An important part of their system is its modularity. We have noted the basic system and some of its modules in two previous posts [links at the end].
A new article reports further developments, which we just note briefly. Once again, the developments are best thought of as modules. That is, the general system can be developed in various ways.
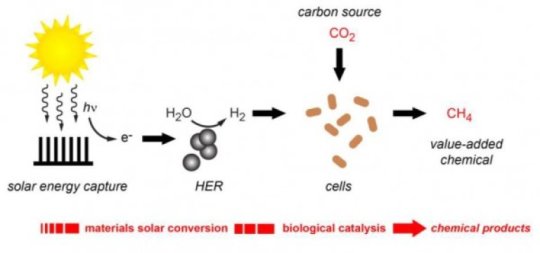
Here is the general scheme for the new work...
From the left...
* Light energy is used to excite electrons.
* The electrons are used to split water, and make hydrogen, H2. (HER? That's the "hydrogen evolution reaction".)
* The H2 is used to reduce CO2. The result is methane, CH4. This is a biological process, using the bacterium Methanosarcina barkeri. Methane is a useful product.
This is from the news story listed below. It is probably the same as Figure 1 from the article.
|
If you compare what the group did in the three articles (and posts)... All involve using solar energy to split water; that is the artificial photosynthesis aspect. The first process simply produced hydrogen gas. The second used the electrons of the hydrogen to make acetate. The new article uses the H2 to make CH4. In the two cases that go beyond the original H2, they couple the artificial photosynthesis with a microbe (bacteria or archaea). This requires that the chemical parts of the system are compatible with the biological parts; that's not trivial, and they have made it work.
As before, the work is lab scale. They are developing the basic system. It's not ready for the real world yet. At some point, someone needs to take their system and focus on one practical goal. That includes careful economic analysis.
News story: Another milestone in hybrid artificial photosynthesis. (Science Daily, August 24, 2015.)
The article: Hybrid bioinorganic approach to solar-to-chemical conversion. (E M Nichols et al, PNAS 112:11461, September 15, 2015.)
Background posts...
* The artificial trees in the artificial forest are now fixing CO2 (and making high-value products) -- naturally (May 13, 2015).
* An artificial forest with artificial trees (June 7, 2013).
Another artificial photosynthesis system: Growing food with artificial photosynthesis? (July 9, 2022).
A post about improving ordinary photosynthesis: Improving photosynthesis by better adaptation to changing light levels (February 27, 2017).
More about the microbial production of methane: How rice leads to global warming, and what we might do about it (September 2, 2015).
There is more about energy issues on my page Internet Resources for Organic and Biochemistry under Energy resources. It includes a list of some related Musings posts.
More about trees and forests:
* The downside of nitrogen fixation? (November 4, 2017).
* At what wind speed do trees break? (April 2, 2016).
What do chimpanzees think about cooking food?
August 30, 2015
They like the idea, according to a recent article.
Why would we study what chimps think about cooking food? Well, cooking is an important part of human culture. It may be an important part of our biology; cooking typically releases more nutrients from food. So, we might want to know how we got started cooking. We know very little about that. Can we learn something about how humans might have started cooking by studying a related animal that does not cook? What traits do we see in them that might lead toward cooking? What traits do they lack?
In Experiment 1 of the current article, the scientists tested whether the chimps preferred a food raw or cooked. The chimps were offered the usual raw food and a version that was cooked. They got to choose, either after a taste test or by odor. The chimps preferred the cooked food -- overwhelmingly. Each chimp tested preferred it to some extent.
That experiment lays the groundwork for the other experiments. Since the chimps prefer the food cooked, the scientists explored various aspects of the preference. For example, how much effort are the chimps willing to spend to get their food cooked?
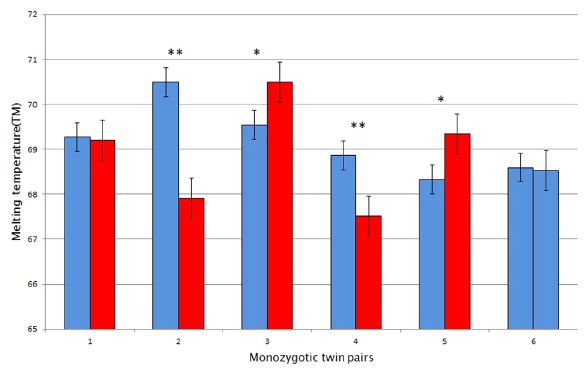
Here is another of the experiments. The general purpose here is to see if the chimps understood what to cook. The two parts are similar, but the way the results are presented is a bit different, so be careful.
|
In part a, the chimps were given various things. The scientists observed whether the chimps cooked it or ate it. The darker bar at the left of each set shows the frequency of cooking the item; the lighter bar (right) shows the frequency of eating it.
You can see that the chimps usually cooked the raw potatoes, cooked carrots about half the time, and usually did not cook the potatoes if they were already cooked.
|
In part b, the basic experimental design was the same. In this case, the graph shows only the frequency of cooking. High for potato, low for wood.
What it means to say that the chimps cooked the food is explained in the article, but not important here. Note that the labeling on the graph refers to a cooking device.
In part a, the two bars are for alternative responses to the same situation. One might expect the two bars in a pair to total 100%. They are close; apparently, a few chimps didn't yield a result. In part b, the two bars are for the same response to different situations.
This is Figure 3 from the article.
|
There is a risk of over-interpreting here, so I won't try to explain the results further. I'll just suggest that the results "make sense".
There is much more, a total of nine experiments, each focused on one question. It's an intriguing article. The list of questions the scientists developed is interesting. And the results are intriguing. Does the work begin to provide some insight about the origin of cooking food?
News stories:
* The naked chef? Chimpanzees can 'cook' and prefer cooked food - study. Findings suggest chimpanzees have the intellectual abilities required for cooking, which could have an impact on our view of human evolution. (H Devlin, Guardian, June 2, 2015.)
* Cooking up cognition: Study suggests chimps have cognitive capacity for cooking. (Phys.org, June 3, 2015.)
The article: Cognitive capacities for cooking in chimpanzees. (F Warneken & A G Rosati, Proceedings of the Royal Society B 282:20150229, June 2015.) I strongly encourage you to at least read the abstract, and I hope some readers will go on and read more.
Recent post about chimpanzees... Can chimpanzees learn a foreign language? (March 10, 2015).
A post about why we cook food (at least, one reason): Killer chickens (December 2, 2009). Also see posts linked there.
More about carrots: Carrot allergy (October 25, 2020).
More apes... Do apes say "hello"? (September 14, 2021).
How rice recognizes a Xoo infection
August 28, 2015
|
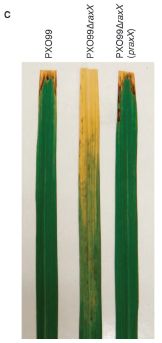
The figure shows three rice plants, all of which have been infected with bacteria.
The middle plant shows extensive signs of the infection. The ones on the left and right show signs of the infection only near the tip. They have been largely protected from the infection by the immune system of the rice plant.
The infection was with the bacterium Xanthomonas oryzae pv. oryzae, or "Xoo". (pv? It stands for pathovar, or pathogenic variety. Something like sub-species.) Xoo is an important pathogen of rice.
This is Figure 1C from the article.
|
A new article explains how the immune response works. More specifically, it identifies the part of the bacterium that the rice plant is sensing.
What's going on with those three rice plants in the figure? The key variable was that the scientists infected them with various strains of Xoo.
* The left-hand plant is for an ordinary infection. It's labeled PXO99; that's their strain name for the bacterium.
* The middle plant was infected with PXO99ΔraxX. That means the original strain, but with a deletion (Δ) of the gene raxX.
* The right-hand plant was infected with PXO99ΔraxX(praxX). That's like the middle one, but with praxX. That means there is a plasmid (p) that carries the raxX gene.
The pattern is simple... If the Xoo bacteria carry the raxX gene, the rice are protected (left and right). If that gene is missing, the rice suffers (middle). Somehow, the rice senses and responds to the protein from the raxX gene, and that protects them from the infection. But if the bacteria infect without sending that signal, then the rice suffers.
The infection at the right is a control. In the middle, the scientists removed a gene; at the right they added it back. It is possible that something went wrong in the middle test; maybe the strain caused an active infection for some other reason. Adding back the gene we thought was involved is a test to see if things were as we thought.
What does the RaxX protein do? It interacts with a rice protein, and that activates the rice defense system. This part of the story had been worked out previously. What's new here is identifying the bacterial signal.
Various species of Xanthomonas are important pathogens for a wide range of plant crops. The authors found that the raxX gene is common among these bacteria. The broader implications of the finding remain to be investigated.
I referred to this as an immune response of the rice. Is that a proper usage? Presumably we would agree it is part of a defense system, but is it part of an immune system? Well, we now understand that the human immune system has two distinct (but interacting) parts. One is the adaptive immune system, which makes antibodies to match a particular invader. The other, more recently understood, is the innate immune system. The innate immune system works by recognizing general features of pathogens, and responding with a generic defense. It's very much like what the rice does here.
News stories:
* Unlocking the Rice Immune System -- Joint BioEnergy Institute Study Identifies Bacterial Protein that is Key to Protecting Rice against Bacterial Blight. (L Yarris, Lawrence Berkeley National Laboratory, July 24, 2015.) From one of the institutions involved in the work.
* Research in Focus: Recognizing pathogens, and recognizing errors. (M Williams, Plant Science Today (blog at American Society of Plant Biologists), August 19, 2015.) More depth on some interesting questions. The two-part title of this item refers to a back-story. The lab reporting this discovery reported that they had found the signal once before. That report proved wrong, and they retracted it. The scientific community has generally given them good marks for how they handled the error. In any case, it is a reminder that a single report should not be taken as "the answer".
The article, which is freely available: The rice immune receptor XA21 recognizes a tyrosine-sulfated protein from a Gram-negative bacterium. (R N Pruitt et al, Science Advances 1:e1500245, July 24, 2015.)
A post about a toll-like receptor, or TLR, which recognizes general pathogen signals in the mammalian innate immune system: Why vaccine effectiveness may vary: role of gut microbiome? (February 27, 2015).
And the similar phenomenon in plants... How the tomato plant resists the Cuscuta (November 4, 2016).
Posts about rice include...
* A perennial rice (March 4, 2023).
* How rice leads to global warming, and what we might do about it (September 2, 2015).
* Rice and arsenic: rice syrup, baby food, and energy bars (April 23, 2012).
* What to do if you are about to drown (September 23, 2009).
A post about CRISPR, which is something of an adaptive immune system in bacteria: CRISPR: an overview (February 15, 2015).
Another example of the control test discussed above, where the gene of interest is added back to make sure one has the right gene... CRISPR: What's it doing to help bacteria carry out infections? (September 8, 2013). This kind of test is called complementation. Note that the post linked here is somewhat analogous to the current post, and it also involves CRISPR.
More about sulfated tyrosine: Modifying bacteria, with help from a bird, so they can make and use an unusual amino acid (October 8, 2022).
August 26, 2015
In the shadow of Ebola: The story of Lassa virus
August 26, 2015
Ebola has caught our attention over the past two years. However, arguably, Lassa virus is more important. It causes a hemorrhagic fever with a high fatality rate, somewhat like Ebola. And it kills 5000 or so each year, far exceeding the death toll from Ebola for every year except for the current, waning, Ebola outbreak. It occurs in a region of west Africa that overlaps that of the current Ebola outbreak.
A new article begins to give Lassa virus the attention it deserves. We'll note it briefly.
The scientists obtained an extensive collection of Lassa samples, from around the region where Lassa is common. They sequenced the viral genomes. Then they did what modern biologists do with a collection of genomes: they tried to make a family tree. And, using estimates for how fast things change, they estimated how far back the Lassa tree goes.
The current work involved sequencing 194 samples of Lassa virus. (These were mostly from infected people, but also included 11 samples from the rats that are the major reservoir for the virus.) That is 15 times more than all previous Lassa work. The viral genome itself is tiny, even by virus standards. It's only about ten kilobases, coding for four proteins. (That's on the order of 1/1000 a common bacterial genome.) However, the sequencing is not easy. They started not with clean virus samples, but crude clinical samples. Only a small fraction of the sequencing "reads" were Lassa virus. This is an example where high-throughput "next-generation" sequencing is so important.
The conclusion? The family tree suggests that Lassa originated in the Nigeria area, about a thousand years ago.
The scientists inferred something else from the collection, something that enhances our understanding of how Lassa is transmitted... If the virus were transmitted between humans, one would expect viruses in cases at about the same time and place to be similar. They aren't. Therefore, it is likely that most cases of Lassa originate from independent infections "from the wild", with very little human-to-human transmission. This contrasts with Ebola, where an outbreak is presumably caused by a single infection from the wild, but then is maintained by transmission between humans.
The sequence information for a collection of Lassa strains may help guide development of diagnostics and therapeutics. For example, the authors suggest that the Lassa in Sierra Leone has diverged enough that it might need distinct tools. This is only suggestive at this point; the current work provides some information, but it does not lead to definitive conclusions.
News stories:
* Study establishes genomic data set on Lassa virus. (Science Daily, August 13, 2015.)
* International Team Discovers the Ancient Origins of Deadly Lassa Virus. (Scripps Research Institute, August 13, 2015. Archive copy.) From one of the institutions involved in the work.
Video. (YouTube, 6 minutes.) This is a "video abstract" of the article, produced by two of the participating institutions, and provided by the journal. Two of the authors narrate the story. There are lots of pictures, but no real explanation of them. So it's something of an audio presentation of the highlights of the work, but does not really take advantage of the video medium. Try it if you want, but don't expect too much, beyond meeting the scientists and seeing some pictures.
The article, which may be freely available: Clinical Sequencing Uncovers Origins and Evolution of Lassa Virus. (K G Andersen et al, Cell 162:738, August 13, 2015.)
Recent post about Ebola: An Ebola vaccine: 100% effective? (August 7, 2015). There has been experimental work on a Lassa vaccine, but there is no approved vaccine. The current article may help with getting a Lassa vaccine by providing a better sense of the variability of the virus. Perhaps more importantly, the recent Ebola experience may help us get over the barrier of inertia and complacency for other diseases.
Also see: After Ebola, what next? and how will we react? (September 5, 2015).
There is a section on my page Biotechnology in the News (BITN) -- Other topics for Ebola and Marburg (and Lassa). That's my old section on Ebola, now expanded to include Lassa. (I may re-think how that is organized.) That section links to related Musings posts, and to good sources of information and news.
There is more about genomes and sequencing on my page Biotechnology in the News (BITN) - DNA and the genome. It includes an extensive list of related Musings posts.
The denial of irisin: a rebuttal
August 25, 2015
Original post... Measuring the level of a non-existent hormone (April 10, 2015).
Irisin is an interesting hormone, which may be involved in weight control. It may mediate the effect of exercise. However, a recent article challenged its very existence. A key part of the argument was showing that antibodies used to detect irisin were not specific. That article was the subject of the "original post" listed above.
We now have a rebuttal, from the group that has been at the forefront of developing the irisin story. As before, we'll skip the details, and simply note the dispute.
What should we believe? I don't know. We have groups of scientists who disagree. In part, they get conflicting results. In part, they are using different methods, and are trying to figure out what works. Such a debate is good science. Let it play out. Over time, we'll see what people agree on. The rebuttal goes some way to addressing the concerns that had been raised. For example, the analyses in the new paper do not use antibodies. Nevertheless, the ultimate test is whether independent workers can replicate the findings.
News story: Irisin Redeemed -- Researchers who first identified irisin quantitate levels of the hormone in human blood and show it is released during exercise. (A Azvolinsky, The Scientist, August 13, 2015.) A good overview both of the science and the dispute.
The article: Detection and Quantitation of Circulating Human Irisin by Tandem Mass Spectrometry. (M P Jedrychowski et al, Cell Metabolism 22:734, October 6, 2015.)
What's the connection: blue cheese, rotten coconuts, and the odorous house ant?
August 24, 2015
Caution... If you are eating some blue cheese, you might not want to read this right now. In fact, if you like blue cheese, you might not want to read this at all. Unless you are interested in chemistry.
There is an interesting kind of ant known as the odorous house ant, Tapinoma sessile. Squish one, and it smells. Smells like... Well, people say various things.
A new article reports analyses of the odor of these ants, along with some of the things it is compared to. This leads to an amusing side story.
Here are the main analyses reported. In each case, the analysis was done on the headspace: the gas around the object. The results are shown here as chromatograms; the x-axis is the time at which each compound comes through the analysis. The main compounds of interest are shaded and labeled.
Starting at the top...
The analysis of the gas around the ant shows one major peak. It's labeled on the graph. The main point is that it is a 2-ketone: it has a carbonyl group (>C=O) at the 2-position of the chain.
Next, blue cheese. Three of the peaks, including the biggest one, are identified as 2-ketones.
Coconut. Fresh. Not much there.
Coconut. Not so fresh. Three peaks. They are 2-ketones, the same ones seen with the blue cheese.
This is Figure 2 from the article. (I wish they had better balanced the size of the lettering on the figure with the graphs. It would be fine to reduce the graphs, but I can't without losing the labeling.)
|
The first conclusion is that the ant odor seems due to the same type of compound as found in blue cheese or rotten coconut. Not the same specific compound, but the same type. Since these compounds may have similar, though different, odors, this result can help to explain why some people make the connection. (It would be interesting to have analyses for some of the other things the ant is compared to.)
The second finding is that the rotten coconut analysis is similar to that of the blue cheese. How did they get this rotten coconut? The scientists buried some coconut in the ground. When they dug it up, it was covered with mold -- perhaps similar to the Penicillium mold used to make blue cheese.
The type of chemical discussed here, 2-ketones, is easily made from fats (lipids). Such chemicals are common enough, and have been found in ants before. What's novel here is that this ant makes an unusually large amount of the chemical, thus leading to a strong odor, one that even humans can detect.
The article starts with a little discussion of how people perceive the odor. The authors note that most web sites they found refer to these ants as smelling like rotten coconut. However, in a test at a local bug event, they found that more people identified the odor as blue cheese.
News story: The Ants That Smell Like Blue Cheese -- Or Is That Pine-Sol? (G Pearson, Wired, June 8, 2015.) This actually has most of the content of the article.
The article: The True Odor of the Odorous House Ant. (C A Penick & A A Smith, American Entomologist 61(2):85, Summer 2015.) (A 21 MB pdf, for a three page article -- perhaps because of the high resolution half page picture of an ant.)
Previous post about ants: The advantage of washing with formic acid (August 8, 2014).
Next... Who cleans up the forest floor? (November 3, 2017).
Previous post about coconut: The octopus and the coconut (December 28, 2009).
Previous post about cheese: The oldest known piece of cheese (April 25, 2014).
More cheese (and fungi): Cheese-making and horizontal gene transfer in domesticated fungi (January 19, 2016).
More ascomycetes... Penidiella and dysprosium (September 11, 2015).
* Previous "What's the connection" post: What's the connection: rotten eggs and high-temperature superconductivity? (June 8, 2015).
* Next... What's the connection: Narcolepsy and the flu vaccine (or getting the flu)? (October 3, 2015).
More about odors: Copper ions in your nose: a key to smelling sulfur compounds (October 10, 2016).
There are sections of my page Organic/Biochemistry Internet resources on Aldehydes and ketones and on Lipids. They list related Musings posts.
Ancient DNA: an overview
August 22, 2015
The Scientist magazine recently posted a feature news story on the broad issues of working with ancient DNA. It includes historical perspective, as well as recent developments. It's good; have a look. Lots of pictures, too.
News story: What's Old Is New Again -- Revolutionary new methods for extracting, purifying, and sequencing ever-more-ancient DNA have opened an unprecedented window into the history of life on Earth. (B Grant, The Scientist, June 1, 2015.) It's the cover story of the June issue, but is available as a web page. Very readable overview.
A recent post on ancient genomes: A person who might, just possibly, have met his Neandertal ancestor (June 30, 2015).
The following pair of old Musings posts are interesting for perspective. They are from 2010. One presents what is thought to be the ninth human genome to be sequenced. The other, later that same year, suggests that the number of sequenced genomes is in the thousands, and will soon exceed ten thousand. Now, just five years later, we see individual articles presenting many many ancient genomes.
* Inuk, a 4000 year old Saqqaq from Qeqertasussuk (March 1, 2010).
* How many human genomes have been sequenced? (November 30, 2010).
There is more about genomes and sequencing on my page Biotechnology in the News (BITN) - DNA and the genome. It includes an extensive list of related Musings posts. Many of those are on ancient genomes. A quick check of the first 10 references from the current story says that references 1, 4, and 9 have been the subject of Musings posts.
And ancient proteins... Blood vessels from dinosaurs? (April 22, 2016).
Do human genes function in yeast? Yeast-human hybrids.
August 21, 2015
A new article provides an interesting update on an old story.
What goes on in cells is similar in many ways in all organisms. For example, cells generally need the same amino acids, and use the same basic pathways to make them. And all cells undergo cell division. The question is whether the proteins that carry out these tasks can function in another organism. Same task, different organisms.
People have been testing this for decades -- for individual genes. What's new is the scale of the current experiment, a systematic test of hundreds of genes. Human genes in yeast. Two organisms that diverged a billion years ago.
Here is the basic plan for the experiments... Take a mutant yeast with a defect in an essential gene. By essential gene, we mean that when the gene is defective the yeast cannot grow. Now add the human version of the same gene. If the strain now grows, it shows that the human version of the gene can substitute for the yeast version.
The test is often called complementation. The question is whether the added gene can complement, or compensate for, the defect of the host strain.
There are various technical points that make these experiments practical. It is no accident that yeast is the host organism. It is a eukaryote, but one that is simple and fast growing. There are good genetic tools to make the manipulations practical. For example, there is already a library of mutants with defects in individual genes. Further, it helps to be able to turn genes on and off under the control of the experimenter. It is hard to grow mutants that can't grow, so scientists use a little technical trick: it's called a conditional lethal. What that means is that the experimenter can turn the gene on and off as needed. One, classic, type of conditional lethal is a temperature sensitive mutation. At low temperature, the gene behaves fine and the organism can grow. Raise the T and the gene (more typically, the gene product) becomes inactive, and the strain can't grow if the gene is essential.
Is the test about genes or about proteins? It's about both -- as a practical matter. The main intent is to see whether the proteins can substitute. However, it is much easier to do the test with genes. A successful complementation requires that the gene function and that the resulting protein function. The technical design of the experiment helps to emphasize the role of the protein rather than gene issues, but the latter cannot be completely eliminated.
As noted, some such tests have been done over the years. Sometimes it works, sometimes it doesn't. In the new work, the scientists systematically test a collection of 414 yeast strains, each mutant in one essential gene. In each case, they add the corresponding human gene, and see whether the yeast can grow.
The human gene works in about half the cases they test. After a billion years of divergence, half of our genes still function reasonably in one of the simplest eukaryotes. (That "half" is a little misleading. It's not really half of our genes. It's half of those tested. And the ones tested were those where human and yeast had corresponding genes. Both organisms have genes that are unique to that organism. They are not an issue here.)
The authors go beyond that and ask why some genes work and some don't. Are there common features of genes that can be successfully transferred from human to yeast?
The following figure summarizes one of their analyses...
|
The authors group the genes by type of function. (This is a standard classification of genes.) For example, the first group (upper left) is "metabolism of cofactors and vitamins".
The pie chart shows that 92% of the genes tested from this group were "replaceable" (yellow). Only 8% were "not replaceable" (blue).
|
The results for six groups of genes are shown here. (It's just a sample of all the groups they looked at.) They are in order, from highest % replaceable (upper left) to lowest (lower right).
There is a pattern, an interesting pattern...
The three groups in the top row, with high % replacement, are for basic biochemical functions involving small molecules, such as the amino acids and vitamins.
The three groups in the bottom row, with low % replacement, are for more complex processes, typically involving proteins interacting with each other.
The full set of groups, shown in the article, fits with the pattern I have suggested here.
This is part of Figure 3C from the article. The full figure shows results for 12 groups of genes.
|
The pattern makes some sense. In the first group, the proteins act independently and carry out individual biochemical steps. The first protein might make chemical "A"; the second converts A to B. So long as the first one can make A and the second one can make B, they are likely to work together. For the second group, let's take the ribosome as an example. It includes many proteins that form a complex. The proteins interact with each other. If one protein is a bit different, it may be unable to interact with its neighbor.
The pattern they found is not surprising. What's new here is having data that tests what we expected. But it is striking that about 90% of genes for basic biochemical functions are sufficiently conserved that they can be successfully transferred from human to yeast.
An interesting follow-up would be to learn why individual failures occur. Also of interest will be exploring why some proteins in complexes can be transferred; the article presents some analysis of one such case.
News story: Human Genes Can Save Yeast -- Replacing yeast genes with their human equivalents reveals functional conservation despite a billion years of divergent evolution. (R Williams, The Scientist, May 21, 2015. Now archived.)
The article: Systematic humanization of yeast genes reveals conserved functions and genetic modularity. (A H Kachroo et al, Science 348:921, May 22, 2015.) Check Google Scholar for a copy.
An example of complementation: CRISPR: What's it doing to help bacteria carry out infections? (September 8, 2013).
An example of using temperature sensitive mutants: "Moonwalkers" -- flies that walk backwards (May 28, 2014).
On making other organisms more human...
* Developing a monkey with a gene for a human brain protein (July 6, 2019).
* As we add human cells to the mouse brain, at what point ... (August 3, 2015).
More about yeast: On genome duplications (September 10, 2015).
Also see:
* Cataloging gene knockouts in humans (July 10, 2017).
* Ribosomes with subunits that are tethered together (October 5, 2015).
August 19, 2015
Update: ethics-tainted trial of golden rice retracted
August 18, 2015
Original post: Golden rice as a source of vitamin A: a clinical trial and a controversy (November 2, 2012).
In the original post we noted a report of a trial of rice that had been genetically engineered to produce a high level of vitamin A; this rice is commonly called "golden rice". The post discussed the scientific findings, but also noted that there were ethical questions about the trial. In a follow-up, we noted that investigations confirmed that there were ethics violations. Now, the article has been retracted, by the journal, because of the ethics violations.
This update, along with some discussion and supporting links, has been added to the original post, at the top, as a retraction box.
Quiz: What is it?
August 17, 2015
There is an important follow-up post, listed at the end.
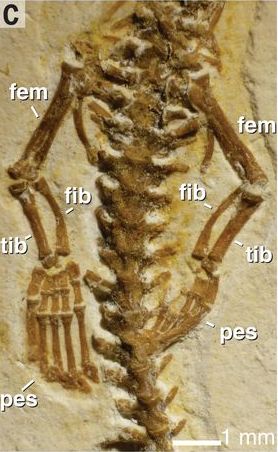
|
That's "it". What kind of animal do you think this fossilized skeleton is from?
Caution... If you decide to count the vertebrae, you should realize that only a small part of the vertebral column is shown.
There is a scale bar at the lower right, but size per se is not helpful here.
This is Figure 4C from the article listed below.
The answer is below. But first, what do you think, and why?
|
Answer and discussion...
Well, that wasn't hard, was it? Especially after I gave a big hint. It's a snake with "hands". Or with limbs, to be more general. You can't tell from this excerpt from the animal, but it's a four-legged snake -- and there are 272 vertebrae (160 before the tail).
Modern snakes don't have legs. Fossil snakes with two hind-limbs have been found. The current fossil is the first known four-legged snake. We presume that snakes developed from something like lizards, by elongation and loss of legs. The snake reported here is perhaps a transitional state. We caution, however, that we do not know where this snake fits in. As so often with fossil finds, there is insufficient evidence to make a strong case how it fits in. We look forward to more specimens.
It's about 110 million years old, and is a beautifully preserved specimen. It's apparently a very young snake. It's called Tetrapodophis, which means four-legged snake.
Interestingly, the limbs here appear to be quite functional, not degenerate. The authors suggest that they were more likely used for grasping than for walking.
News story: Four-legged snake fossil found. (Science Daily, July 23, 2015.)
Video. (YouTube, 3 minutes.) It's a nice introduction to the story, narrated by the lead author. He is good at pointing out features in the skeleton. Highly recommended.
* News story accompanying the article: Paleontology: Four legs too many? -- A long-bodied fossil snake retains fore- and hindlimbs. (S Evans, Science 349:374, July 24, 2015.)
* The article: A four-legged snake from the Early Cretaceous of Gondwana. (D M Martill et al, Science 349:416, July 24, 2015.)
There is an important follow-up post: A dispute about an issue in a Musings post: the four-legged snake (December 5, 2016).
More snakes:
* Poisonous snakes and their mimics (August 15, 2016).
* How to climb a pile of sand (November 7, 2014). Elizabeth.
* Previous quiz... Quiz: What is it, and ... ? (July 7, 2015).
* Next: Quiz: what is it? (April 5, 2017).
Gondwana? See How were the Gamburtsevs formed? (December 7, 2011).
The energy landscape: looking ahead
August 16, 2015
Briefly noted...
The world is in something of an energy crisis. Perhaps it always seems that way, but a dominant concern now is providing the energy human society needs (wants?) without increasing global warming. In short, we need to "decarbonize" the energy supply.
That raises a lot of issues. The current article makes an interesting contribution. It provides a thorough analysis of the long term effects of a transition from fossil fuels to solar energy. It is what is called a life cycle analysis; the authors suggest it is the most comprehensive yet done in the field.
As an example of the issues they address... Based on current knowledge, production of energy from low-carbon sources (such as solar) is likely to require increased amounts of other resources. Is this a good trade-off?
The authors conclude that the effects are favorable. That is a short statement about a complex article. I suspect that there is much in the article to argue about; there are a lot of assumptions in the analysis. That's fine. As more analyses are done, we'll see which conclusions hold and which don't. The article itself is difficult reading; I think what's important here is simply to note that they have done this -- and that it looks encouraging.
News story:
* Low-carbon energy future is clean, feasible. (Science Daily, October 6, 2014.) Overview.
* Life-Cycle Study Confirms Global Environmental Benefit of Low-Carbon Energy Technologies. (R Kilisek, Breaking Energy, October 10, 2014.)
The article: Integrated life-cycle assessment of electricity-supply scenarios confirms global environmental benefit of low-carbon technologies. (E G Hertwich et al, PNAS 112:6277, May 19, 2015.)
The article is part of a special feature section in this issue of the journal. (That's probably why it took so long from the announcement of the article, reflected in the dates of the news stories above, to the print publication.) The section is called Industrial Ecology: The Role Of Manufactured Capital For Sustainability. There is an introductory article, with that title, plus more. They may be all freely available, if you'd like to browse.
A news story on the feature section: Towards a new industrial revolution: studying societies' metabolism. (Potsdam Institute for Climate Impact Research, May 19, 2015.) From a group involved in coordinating the feature. Useful overview, provocative.
A recent post on the development of solar energy: The artificial trees in the artificial forest are now fixing CO2 (and making high-value products) -- naturally (May 13, 2015).
There is more about energy issues on my page Internet Resources for Organic and Biochemistry under Energy resources. It includes a list of some related Musings posts.
Using your phone to find Loa loa
August 14, 2015
This post is about using phone-based cameras for medical applications, such as diagnosing parasites; this was introduced in an earlier post on the CellScope [link at the end]. We now have a field trial of a device for a specific application.
Some background... Two important diseases in parts of central Africa are onchocerciasis (river blindness) and lymphatic filariasis (leading to elephantiasis). These worm infections can be treated, using the drug ivermectin. However, there is a problem. The use of ivermectin is good -- unless the person also carries Loa loa, in which case the drug becomes quite toxic.
Loa loa is a tiny worm, which causes loiasis. By itself, it is often a minor infection. What is important here is that it interferes with the use of ivermectin for the other diseases. Therefore, it is important to screen those being given the drug for Loa.
The common screening for Loa is slow. It requires a trained observer to examine a blood sample. A new article offers a smartphone-based test, which is quick and easy -- and highly automated. The article reports a field trial of the device.
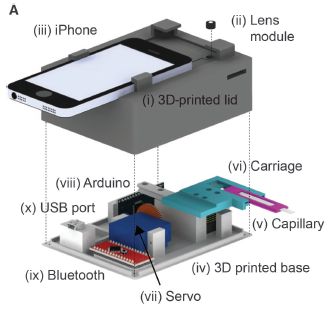
Here is the device, called CellScope Loa...
|
The top part of the figure shows the device; the bottom part shows the innards.
The phone is used for its camera and computer. Blood is taken from the person directly into the capillary (v, in the lower frame). The capillary is inserted into the slot on the right side of the device.
The user presses a button on the phone screen. The rest is automatic. The device takes pictures, analyzes them, and reports the count of "little things that move" -- the Loa loa. No treatment or staining of the blood is needed.
You can see it in operation in the video files listed below.
This is Figure 2A from the article.
|
Here is a summary of the results from a recent field trial, in Cameroon...
|
The graph shows a scatter plot comparing the results for the two methods. The y-axis shows the results from the new device; the x-axis shows the results by the traditional procedure, using a sample of blood that has been stained and read by a trained observer.
The axes are labeled with the units mf/ml. The mf stands for microfilariae, that is, the worms of interest.
You can see that the results for the two methods generally agree well.
Let's look more closely; it gets more interesting.
|
The graph is divided into four quadrants. The dashed lines show the cutoffs: 26. That's 26,000 worms per mL of blood. If a person is below that level, they get the drug; if they are above it, they don't.
Many of the points are in the white lower left quadrant. This means that the assay is below the cutoff by both methods. A couple of points are in the white upper right quadrant. This means they are above the cutoff by both methods. So far, so good.
There are two points in the blue quadrant (upper left). This means that the new phone-based assay says they are above the cutoff, whereas the traditional test says they are not. The new assay is reporting something that is not true by the traditional test, considered the "gold standard". These are false positives. There are no points in the pink quadrant (lower right); these would be false negatives.
This is Figure 4B from the article.
|
It's good to follow that discussion of the graph; it is typical of how one compares two analysis methods.
However, there is perhaps more to it. In pointing out more, I'm not trying to criticize the new method or the authors, but to point to some complexities that, at some point, need some attention. The current study is small; it's not surprising it leaves some questions.
For example, we might note that of the values above the cutoff by the new method, half (two of four) seem to be false positives. In fairness, the false positives are just barely across the line. But the big point is that there are very few samples here with high values.
In doing the comparison, the traditional method is considered the "gold standard"; it is taken as correct. But we don't really know that for sure -- especially when the discrepancies are small.
Why is there a simple cutoff? A single number, applicable to all people: below it you're ok, above it, you're not. Our state of knowledge may be that simple, but real biology usually isn't.
Questions, questions. Typical of real world medical issues. If the new method ends up proving to be simpler to use, perhaps it will allow better analysis of some of those questions.
In the article, the authors discuss some of the development that has gone into getting to the current device. They note the challenges of getting a device that is "correct" and also easy to use and inexpensive. The current test was "in the field", under conditions they consider close to the real intended application.
News stories:
* New smartphone microscope able to detect blood parasites quickly. (J McIntosh, Medical News Today, May 7, 2015.)
* Smartphone video microscope automates detection of parasites in blood. (S Yang, UC Berkeley, May 6, 2015.) From the lead institution.
Video. (YouTube, 30 seconds, narrated.) Brief overview of how the device works. This video is included in the UC Berkeley news story, listed above.
There are also three videos posted with the article at the journal web site, as Supplementary Materials. Of particular interest...
* Movie S1 shows you Loa in the blood. They are the little wriggling things. (5 seconds.)
* Movie S2 is a longer version of the narrated description of how the device works (2 minutes.)
The article: Point-of-care quantification of blood-borne filarial parasites with a mobile phone microscope. (M V D'Ambrosio et al, Science Translational Medicine 7:286re4, May 6, 2015.)
Background post about the CellScope: Connecting a cell phone and a microscope (September 2, 2009).
Also see a section of my page Internet resources: Biology - Miscellaneous on Microscopy.
More you can do with your phone:
* Can you detect the SARS-2 virus with your phone? (March 2, 2021).
* Testing for lead in drinking water: a quick and inexpensive test using a smartphone (October 20, 2018).
* Using your smartphone to detect cosmic rays (April 7, 2015). Note that the current device, for parasites, requires both hardware and software beyond the phone. The cosmic ray device requires only software; it can be done with your phone without further equipment.
More from Cameroon: Lakes that explode (October 13, 2009).
More worms... Could a tapeworm with cancer transmit the cancer to its human host? (November 16, 2015).
Also see: Nobel notes (October 13, 2015).
August 12, 2015
Evaluating the world's water resources
August 11, 2015
Fresh water is an essential resource for humans. It is increasingly being recognized as a scarce resource.
One type of water source is ground water. Our understanding of ground water resources is quite limited; after all, they are hard to measure. We may realize that wells have to be dug deeper in order to be useful, but we typically do not know how much water is available.
A new tool for studying ground water has become available in recent years. It's gravity. Measurement of gravity can be related to the water content. In particular, changes in gravity at a particular place over time can be interpreted in terms of changes in water -- whether visible or underground. The visible, or "surface", water is easy enough; it is the underground part, called ground water, that is the main focus here.
Gravity measurements and their use for estimating water have been introduced in previous Musings posts. Other ground water issues have also been raised. [Links at the end.]
A pair of new articles bring together several years of gravity measurements from satellites, and put together a story about water resources on a worldwide basis.
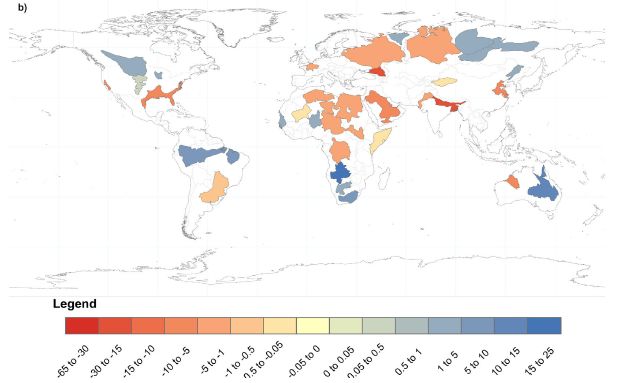
Here is an example of what they found...
The colored regions on the map are major aquifers -- the 37 largest aquifers in the world. They are color-coded by the rate of change of the water level, as measured by the GRACE satellite system.
Red colors are for negative values; these show that the level of water in the aquifer is decreasing. Blue values show that the aquifer level is increasing.
The numeric values shown on the color key are in millimeters per year.
This is Figure 6b from article 2.
|
The articles contain a huge amount of information, with many maps such as that shown above. They can easily overwhelm you. Remember, the purpose is to analyze Earth's water supply. If you are interested in a particular region, you can focus on that. But otherwise the best way to deal with these articles is to look for some big ideas.
The biggest idea is the methodology. The scientists -- or rather, the satellites -- measure gravity around the world. Changes in gravity are likely to be due to changes in water supply. This allows a direct measurement of something not possible a few years ago.
There are, of course, other estimates of water supplies. One can estimate withdrawals and sometimes sources. But these are all difficult, with big uncertainties. Gravity-based measurements of water have significant uncertainties, too, but overall, are probably an improvement. Some of the discussion in the articles is comparing the methods -- and discussing the big uncertainties.
The authors present estimates of how long aquifers will last, using map figures like that above (Figures 5 & 6 of article 1). Three things are striking. The time scales of the estimates range from decades to millions of years. Estimates vary widely -- by orders of magnitude -- between traditional analyses and the authors' new ones. Their new estimates are typically much shorter.
If you live near a region shown in red, above, you might want to look further. Even if you don't, water is a resource of economic -- and hence geopolitical -- importance.
News story: A third of the world's biggest groundwater basins are in distress. (Science Daily, June 16, 2015.)
There are two articles, both freely available:
1) Uncertainty in global groundwater storage estimates in a Total Groundwater Stress framework. (A S Richey et al, Water Resources Research 51:5198, July 2015.)
2) Quantifying renewable groundwater stress with GRACE. (A S Richey et al, Water Resources Research 51:5217, July 2015.)
Background posts on gravity measurements and water resources include...
* Groundwater depletion in the Colorado River Basin (October 3, 2014).
* Groundwater depletion in the nearby valley may be why California's mountains are rising (June 20, 2014). This aquifer is shown on the map; it is the little one near the west (left) coast of California. It's quite red, indicating it is being depleted.
* NASA weighs India, finds it deficient (October 2, 2009). An introduction to GRACE.
More...
* Making hydrogen fuel from water -- from seawater (May 28, 2019).
* Earth: RSSA (September 18, 2018).
* Regional changes in sea level: evidence from gravity measurements (February 26, 2016).
Monitoring the wildlife: How do you tell black leopards apart?
August 10, 2015
In general, telling leopards apart is easy enough. You look at the pattern of spots.
However, in Malaysia there is a problem, as shown in the following figure:
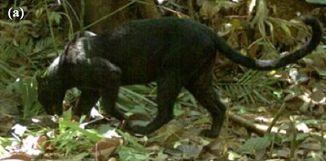
|
An ordinary color photo of a leopard.
This is Figure 1a from the article.
|
In some areas of Malaysia, most of the leopards are melanistic. In plain English, black. You can't see the spots.
A new article reports a trick. Click here [link opens in new window]. The top part is the same photo as above. The bottom part is a photo taken with an infrared (IR) flash. You can see the spots. (The linked figure is the full Figure 1 from the article. These are two different animals and scenes. I wonder why they didn't publish two shots of the same animal, with the two types of lighting.)
Scientists have been aware that that the black leopards actually have spots; sometimes one can see them, depending on the angle of the lighting. The new work provides a practical way to see the spots during routine daytime photography.
Their system for monitoring leopards in the wild uses automated camera trap stations. Apparently, the traps routinely take color pictures in daylight, and IR pictures at night. What the scientists did here was to cover the light sensor, forcing the station to take IR pictures at all times.
The scientists were able to identify the individual leopard in 94% of the photos, with two observers agreeing. This is higher identification than achieved by any previous method for black leopards.
It is important that conservation biologists be able to track individual animals. Now, they can study the leopards in Malaysia. In fact, the article presents an estimate of the density of leopards in the area, probably the first such measurement.
News story: Mysterious black leopards finally reveal their spots. (Science Daily, July 13, 2015.)
The article: Melanistic Leopards Reveal Their Spots: Infrared Camera Traps Provide a Population Density Estimate of Leopards in Malaysia. (L Hedges et al, Journal of Wildlife Management 79:846, July 2015.)
More on cat coats: Big cat, little cat: Taqpep determines coat pattern (December 27, 2012). Links to more about cats.
More on melanin: The story of the peppered moth (July 9, 2012).
More from Malaysia: Who cleans up the forest floor? (November 3, 2017).
Also see:
* Using drones to count wildlife (May 15, 2018).
* Re-introducing captive animals into the wild: an orang-utan mix-up (June 27, 2016).
* Leopard horses (December 2, 2011).
An Ebola vaccine: 100% effective?
August 7, 2015
The world has been gripped by the most serious outbreak of Ebola ever recorded, one that afflicted more people than all previous outbreaks combined. It has not been a time of good news.
Even the waning of the epidemic brought a kind of bad news: there were so few cases that it was hard to test drugs or vaccines -- an ironic twist. (In fact, some trials were canceled for lack of cases.)
Last week brought some genuinely good news: results from a phase III clinical trial of a vaccine, with the key result that it is "100% effective". The trial is still in progress; the new article is a progress report. Let's look. A question-and-answer format seems helpful...
What is the vaccine? It's an engineered vaccine, with a gene from the Ebola virus inserted into a carrier virus. The gene codes for a protein found on the surface of the Ebola virus. This is a common type of vaccine system, intended to induce immunity but not disease.
What was known about the vaccine before this trial? It was tested in animals, including monkeys. And it had received small trials in humans. The animal trials showed that it was safe and effective. The early human trials were mainly to establish basic safety. Remember... many agents pass these tests, then fail in phase III trials in humans.
How was the trial done? The common approach to a clinical trial is that a target group is split into two sub-groups. One group gets the treatment, the other does not. What was novel here is the nature of the target group. Most Ebola is acquired by transmission from someone already infected (rather than from the environment). Thus with an Ebola vaccine, it makes sense to focus on contacts of known cases, and others very close to those people. That approach gives this kind of trial its nickname: ring vaccination. That is, vaccination is focused where there might be the greatest need, rather than vaccinating the general population.
The set of contacts around a single case of Ebola is referred to as a cluster. For half of the clusters, the vaccine was administered immediately upon defining the cluster. The other half of the clusters served as a control.
The control groups were given the vaccine 21 days later; this is referred to as delayed vaccination. This procedural detail has little impact on the main analysis at this time.
This was not a double-blind trial. There was no placebo vaccine. Each person knew whether they were in the immediate or delayed vaccination groups. However, those monitoring and treating the people later did not know which group a person was in.
How was the primary evaluation of the trial done? As always, one compares what happens in the treated group vs the control group. But deciding exactly how to do that is not a small matter. In this case, they decided to count Ebola cases that occurred at least 10 days after the vaccination. That is, they allowed 10 days for the vaccine to become effective; disease within that 10 day window "doesn't count". Importantly, the criterion is chosen prior to doing the trial. It is not proper to use the trial data to figure out what the best evaluation is.
10 days? That's the incubation period for the virus. Cases that appear within 10 days after vaccination are probably due to infections acquired before the vaccination. The 10 day period is also time for the vaccine to induce immunity.
And they found? 16 cases in the control group, zero in the vaccine group. That is the basis of the statement that the vaccine was 100% effective.
There were about the same number of people in each group, so it's fair to compare the raw numbers.
100%? Really? Well, a reduction from 16 cases to 0 is 100% reduction.
Those are small numbers. 16 cases in the control group. Taking that number at face value... had they found one case in the vaccine group, that would be 6% (or 94% reduction). Using their statistical tools, the authors give a 95% confidence interval for the reduction as 75-100%.
Of course, no one really believes the vaccine is literally 100% effective. That's the current number based on data so far. Whatever the numbers, it seems that the vaccine is highly effective. (A highly touted vaccine against malaria is about 30% effective. That's unusually low for an acceptable vaccine, but this one is likely to get approved.)
More detail?
The figure shows the accumulation of Ebola cases over time. There are two curves, one for each "arm" of the trial.
The number of cases is shown here as a percentage. That's fine; just look at the general nature of the curves. (There are about 2000 people in each group.)
Day 0 is the day a cluster was officially started, and designated to be either immediate or delayed vaccination. For an "immediate" vaccination cluster, it was the day of vaccination. The "delayed" vaccination clusters were vaccinated on day 21. The red arrows indicate those times of vaccination.
For the immediate vaccination group (dashed line), you can see that the curve rises for a while, then levels off. The early cases are in people who were vaccinated; they are marked with a *. Day 10 is the cutoff for official analysis; there are no new cases after day 10.
For the delayed vaccination group (solid line), the curve continues to rise. This group got vaccinated at day 21. You can see that some people who were vaccinated developed Ebola -- again marked by the *. All such cases were within a few days of the vaccination. It seems likely that this curve is leveling off a few days after vaccination. More about this later, but it is not part of the main analysis.
This is Figure 3A from the article. I have added the labels on the x-axis, showing the time scale.
|
It's simple... No one who was vaccinated got Ebola after a 10 day window. That applies to the immediate vaccination group, of primary concern. It also applies to the delayed vaccination group. It may be that the vaccine is effective within about 6 days.
If the incubation period is 10 days and the vaccine is effective in 6 days, does that mean the vaccine may act against infections that have already started? That's a logical inference. It's also biologically plausible. The numbers here are soft, and I wouldn't press the point for now.
Can we make things more complicated? Sure. Look at the graph above. Remember that the delayed vaccination group got vaccinated on day 21. Why, then, are there further cases of Ebola among unvaccinated people? Cases among vaccinated people are marked with *. The graph shows cases without a *, so these must be unvaccinated -- even though everyone has been vaccinated.
If you're confused, skip this part if you want. But you (or whoever laid out the questions) asked for complications.
In the real world, not everyone shows up. Some people who were included in a cluster did not get vaccinated, for one reason or another. We don't need the detail, but it does confuse the evaluation.
One way to take into account those who missed vaccination is to calculate the results on a population basis. That is, consider that there was a population that was supposed to get vaccinated. What was their Ebola rate compared to a control population? This takes into account how well the vaccine worked, but also takes into account that some people don't get vaccinated. It's a "conservative" estimate of how well the vaccination program worked.
The authors report a couple of such conservative estimates of the overall effectiveness. Both numbers are about 75%, with very big uncertainties. We won't worry about this for now. As more numbers come in, presumably the error bars will shrink; hopefully the effectiveness will remain high. But it is a reminder that having a good vaccine is just one part of a successful vaccination program.
Do the results for the immediate vaccination group, in the graph above, also include unvaccinated people? Good question. But the answer is no. Their figure legend says, "(A) All vaccinated individuals assigned to immediate vaccination versus all eligible individuals assigned to delayed vaccination (primary analysis)." I added the underlining to emphasize two words. That is, for the first 21 days, the primary analysis is simply vaccinated vs unvaccinated; that is the major point of the figure.
What about adverse events? Numerous adverse events were reported. Many of these were presumably unrelated to the vaccine. There was one serious adverse event thought to be vaccine-related; the person fully recovered. This issue will be followed; the tentative sense is that it does not appear to be a major concern at this point.
The rules for reporting adverse events during a trial are strict. Everything gets reported. (Three people in the trial were seriously injured in traffic accidents. There is no reason to suspect these injuries are related to the vaccine, but they get reported as adverse events.) Sorting out which are treatment-related and which are serious is part of the analysis that follows. Since this step has a potential for abuse, it is important that all adverse events be documented, for the record, even though most will not have any relevance.
There has been some concern about "minor" reactions to the vaccine. This is not talked about in the current article, and we won't go into it here. We note it mainly as a reminder that things may not be as simple as the headlines.
Summary? Good news, with the main reservation being the limited amount of data so far. The study deserves note not only for apparently showing a good vaccine but for use of the ring vaccination strategy.
In the authors' own words, from the article summary: "Interpretation -- The results of this interim analysis indicate that rVSV-ZEBOV [the "name" of the vaccine] might be highly efficacious and safe in preventing Ebola virus disease, and is most likely effective at the population level when delivered during an Ebola virus disease outbreak via a ring vaccination strategy."
The future? The trial is still in progress; this is a preliminary report. But let's assume the results continue to be favorable. Work with this vaccine will continue; the ring vaccination strategy is well suited to Ebola. The vaccine can be used with front-line personnel, such as health care workers, and with others deemed at high risk, such as contacts of known cases. The history of Ebola is that it occurs in sporadic outbreaks; it is reasonable that the vaccine could be introduced early in such an outbreak. Whether the vaccine should be administered to the general population is a question that will be considered later.
Both news stories listed below discuss the future of the vaccine.
News stories:
* High effectiveness found in Guinea Ebola ring vaccination trial. (CIDRAP, July 31, 2015.)
* Ebola: Getting closer to an Ebola vaccine. (MSF, July 31, 2015.) Interview with Dr. Bertrand Draguez, Médecins Sans Frontières (MSF) Medical Director. Draguez summarizes what was done, and suggests how we should proceed. MSF was a co-sponsor of the trial.
If the links given below don't lead to free access to the items, go to the CIDRAP news story, above; it includes direct links to the pdf files (for the editorial and the main article).
The article was posted online on July 31; it includes results through July 20.
* Editorial accompanying the article: An Ebola vaccine: first results and promising opportunities. (Lancet 386:830, August 29, 2015.)
* "Comment" accompanying the article; it is freely available: Interim results from a phase 3 Ebola vaccine study in Guinea. (P R Krause, Lancet 386:831, August 29, 2015.) Good overview of the trial and what we learned. Includes discussion of the limitations.
* The article, which is freely available: Efficacy and effectiveness of an rVSV-vectored vaccine expressing Ebola surface glycoprotein: interim results from the Guinea ring vaccination cluster-randomised trial. (A M Henao-Restrepo et al, Lancet 386:857, August 29, 2015.)
Update, with the final report for the trial: Update: Ebola vaccine trial (January 24, 2017).
* Previous Ebola post: Fallout from the Ebola outbreak: more measles? (April 28, 2015).
* Next: After Ebola, what next? and how will we react? (September 5, 2015).
There is more about Ebola on my page Biotechnology in the News (BITN) -- Other topics in the section Ebola and Marburg. That section links to related Musings posts, and to good sources of information and news.
A post about a malaria vaccine: A vaccine against malaria -- with 100% efficacy? (October 20, 2013). The claim of 100% effectiveness is, again, based on very small numbers. The vaccine discussed in this post is experimental, and is not the one mentioned above.
Some Lassa: In the shadow of Ebola: The story of Lassa virus (August 26, 2015).
A post about a novel type of cell-surface glycans: A new role for RNA (August 3, 2021).
Also see...
* Is it worthwhile to require flu vaccination for health care workers? (March 6, 2017).
* How the MERS virus spread in Korea: role of super-spreaders (November 3, 2015).
August 5, 2015
Do babbler birds construct words?
August 4, 2015
Consider the words "at" and "cat". The second word includes the sound of the first word, but there is no relationship between the meanings of the two words. That is, the sound of "at" is an abstraction of language that means completely different things depending on its language context.
A new article reports that a common Australian bird known as the chestnut-crowned babbler (Pomatostomus ruficeps) uses sounds in a way that is very much like that. That is, the bird constructs different "words", with different meanings, from the same sounds.
The work started with analyzing the sounds made by the birds. Later, the scientists did playback experiments. The birds responded to playing artificially constructed sounds the way the scientists expected.
The authors claim that this is the first example of finding such word construction in non-human animals. It is tempting to look at it as a step toward language. Is there any connection between what these birds are doing and what the first humans might have done in acquiring language?
An article such as this teases us. If offers something new, something surprising. Be cautious. Nothing is served by trying to reach a conclusion at this point. We have a new finding about vocalization and communication by these birds. It leads to suggestions (ideas, hypotheses) and further work. Let's try to understand what the birds can -- and can't -- do. What can other animals do, now that the idea has been raised? The role of an article such as this should be to expand the exploration of how non-human animals communicate.
News story: Key element of human language discovered in bird babble. (Science Daily, June 29, 2015.)
The article, which is freely available: Experimental Evidence for Phonemic Contrasts in a Nonhuman Vocal System. (S Engesser et al, PLoS Biology 13(6):e1002171, June 29, 2015.) It's a long article, but generally readable. You might find it interesting to look over the introductory parts, even if you don't want to get into the more technical parts.
More on language... Can chimpanzees learn a foreign language? (March 10, 2015).
As we add human cells to the mouse brain, at what point ...
August 3, 2015
A few months ago an article appeared in which the scientists added human cells to a mouse brain; the striking result was that the mice did better in certain tests.
It is a type of work that gets done a lot; it has the general goal of trying to find out what certain genes do, and how organisms differ. But this particular example got some attention of a different kind. It at least provoked the question of what the limits of such experiments should be. A recent commentary in The Scientist addressed the issue; it's worth a look. I do not suggest that we reach a quick conclusion. More important, I think, is that we are alert to the concerns.
News story: When Does a Smart Mouse Become Human? -- Ethical issues attend the creation of animal-human chimeras. (J D Loike, The Scientist, July 1, 2015. Now archived.)
An example of such work... Mice with human brain cells (April 13, 2013).
A recent post on another, perhaps related, ethical question... CRISPR and editing of the human germline: the ethical line? (May 4, 2015).
Two sections of my page Biotechnology in the News (BITN) -- Other topics are relevant here:
* Brain (autism, schizophrenia).
* Ethical and social issues; the nature of science.
Each includes a list of related Musings posts.
More about chimeras formed with human cells in embryos of other animals: Using human stem cells to make chimeras in pig embryos (February 25, 2017).
On making other organisms more human...
* Developing a monkey with a gene for a human brain protein (July 6, 2019).
* Do human genes function in yeast? Yeast-human hybrids. (August 21, 2015).
Also see: A possible genetic cause for the large human brain (March 25, 2017).
How the giant panda survives on a poor diet
August 2, 2015
The giant panda is famous for its diet: bamboo. That's certainly unusual -- especially for a carnivore. A panda is a type of bear, and bears are carnivores. The specialist panda has specialized in a way that is inconsistent with its family.
If you have been paying attention to recent science, you might suggest that the panda has a gut microbiota specialized for digesting bamboo. The microbiota clearly plays a role in digesting food, and it is plausible that it might adapt relatively quickly. Perhaps the panda switched from carnivory to bamboovory (don't look that up in your dictionary, but I bet you know what it means) largely by developing a new gut microbiota. Perhaps, but recent evidence suggests it isn't true. The story is incomplete, but a first analysis of the panda microbiota suggests it isn't helping with the bamboo.
A new article offers a different analysis. The scientists measure the metabolism of the panda: it's slow. Very slow.
The following figure shows one manifestation of the slow metabolism. It shows the surface temperature of various animals.
|
Let's start with the bottom part of the figure, labeled T = 10 °C (with brown bars). Several large animals were kept at this T, and the T of the body surface was measured (x-axis). For simplicity, you might just look at the little red bars, which mark the average T of the animals. The striking finding is that the pandas are several degrees cooler than the dogs and cows.
The top part of the figure is the same kind of work, but now with the animals kept at -4 °C (blue bars). Again, the pandas are cooler than the other animals tested.
This is part of Figure 2 from the article. I have added the temperature labels within the figure. These are for the ambient T.
|
The lower surface T of the pandas, compared to other large animals kept under the same conditions, reflects that the pandas have a slower metabolism, and are thus producing less heat. That is how, apparently, they survive on a poor diet. They have reduced their energy needs to match their diet.
The authors uncover one explanation for the slow metabolism. They find that pandas carry a mutation that leads to a low level of thyroid hormone, which plays a key role in regulating metabolism. It may be that this mutation was a key step in adapting to a diet of bamboo.
Quantitative measurements of the metabolism show that the panda spends about half as much energy as a human of the same weight. Its metabolism is more like that of a sloth, an animal noted for its low metabolism. But that last point also shows that the panda metabolism is within the range known for mammals, just near the lower end.
News stories:
* Stay Cool And Eat Bamboo. (Asian Scientist, July 22, 2015.) Includes a thermal image of a panda; interesting picture! The article includes some such pictures, but they are hard to interpret.
* Pandas spend less energy to afford bamboo diet. (Science Daily, July 9, 2015.)
The article: Exceptionally low daily energy expenditure in the bamboo-eating giant panda. (Y Nie et al, Science 349:171, July 10, 2015.)
Previous panda post... The panda genome (January 11, 2010).
More...
* Pandas: When did they become specialized to eat bamboo? (March 18, 2019).
* Rewritable W-based paper and a disappearing panda (January 30, 2017).
More on thyroid issues...
* Failure to regenerate heart tissue: role of thyroid hormone (May 14, 2019).
* Did the Fukushima nuclear accident lead to a burst of thyroid cancer? (July 17, 2016).
* BPA: Effect on thyroid hormones in pregnant women and babies (December 8, 2012).
Also see:
* Low-carb diets: Long-term effects? (September 4, 2018).
* The opah: a big comical fish with a warm heart (July 13, 2015).
Handedness in kangaroos: significance?
July 31, 2015
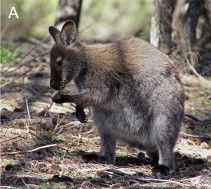
|
A red-necked wallaby, Macropus (Notamacropus) rufogriseus, in a bipedal position, using the left forelimb for eating.
This is Figure 1A from the article.
|
A team of scientists has made systematic observations of several marsupial species to see which "hand" (forelimb) they used for various tasks, such as feeding and grooming.
Here is a summary of their results...
The graph shows the overall handedness they found for seven marsupials. Each bar is for one type of marsupial; the "height" of the bar shows the handedness they found.
The y-axis is a handedness score, which they call the mean handedness index. Positive scores mean a bias toward use of the left hand; negative scores are for a right-hand bias. The bars are shown extending from zero (no bias) to whatever mean score was found for the species.
Note the vertical divider in the graph. And note that the results seem different on the two sides of that divider. What does that mean?
The four (darker) bars to the right all have values near +0.5, and all are marked as significantly different from zero. These four species are left-handed.
The three (lighter) bars to the left are all smaller, and are "NS" -- not significantly different from zero. These three species do not show a significant handedness bias.
The two sets of bars? One set is for quadrupedal marsupials, the other set is for bipedal marsupials. The bipedal marsupials show a handedness effect -- and they are left-handed. The quadrupedal marsupials do not show a handedness effect.
This is Figure 3 from the article.
|
So what do we learn from all this, assuming that the results seen here are representative and are being properly interpreted?
First, we learn that some marsupials are left-handed. This appears to be the first example of species where left-handedness is the more common bias. For now, we have no idea what the significance of this is.
The second finding is intriguing: that handedness is found in bipedal species, but not in quadrupedal species. Does this really mean that handedness develops along with the bipedal posture? It is true that the species we most commonly note for its handedness bias is indeed bipedal.
The handedness score for humans, using similar tests, is about -0.6. (This is shown in Figure 4 of the article.) Except for the opposite sign, the results are not very different from those for the red kangaroo.
News stories:
* Most kangaroos are 'left-handed'. (BBC, June 18, 2015.)
* Lefties are all right with kangaroos. (Science Daily, June 18, 2015.)
The article: Parallel Emergence of True Handedness in the Evolution of Marsupials and Placentals. (A Giljov et al, Current Biology 25:1878, July 20, 2015.) Check Google Scholar for a freely available copy of the preprint.
Other posts about handedness include...
* On handedness in humans (September 30, 2013).
* Analysis of teeth confirms that Regourdou was right-handed (September 7, 2012).
* On being ambidextrous (January 24, 2010).
More about kangaroos: An animal that walks on five legs (February 3, 2015).
and maybe... Kangaroo mother care for premature babies: start immediately (June 27, 2021).
July 29, 2015
Close-up view of an unwashed human
July 29, 2015
Briefly noted...
Here he is...

|
The figure shows the distribution of sodium lauryl ether sulfate (SLES) on his body.
The results are shown as a heat map, with redder colors indicating higher concentrations and bluer colors indicating lower concentrations. There is a key at the lower left, but it is only qualitative.
This is one part of Figure 2 from the article.
|
What's the point? The methodology for making such a "skin atlas". The authors of a new article have developed methods to allow extensive examination of the skin, for many many things. The analyses reported in the article include a variety of substances, including metabolic products from the person as well as environmental chemicals. The particular chemical above is a detergent found in shampoos.
Much of the analysis was done by sampling the skin at 400 sites with swabs, and analyzing them by mass spectrometry. They also analyze for microbes, based on ribosomal RNA sequences. In fact, one goal is to be able to correlate skin chemicals with skin microbes.
One observation from the limited work so far is that much of what is on our skin is from things we apply, such as hygienic or cosmetic products. The detergent shown above is an example. Interestingly, a good fraction of the chemicals found on the skin could not be identified.
Two individuals were sampled for this study, one male and one female. Their preparation included not bathing for three days prior to the sampling. Again, we emphasize that the primary purpose of the study was methods development, and not conclusions about what is on the skin.
News story: 3-D human skin maps aid study of relationships between molecules, microbes and environment. (Science Daily, March 30, 2015.)
* Commentary accompanying the article: Skin molecule maps using mass spectrometry. (R G Cooks et al, PNAS 112:5261, April 28, 2015.)
* The article, which is freely available: Molecular cartography of the human skin surface in 3D. (A Bouslimani et al, PNAS 112:E2120, April 28, 2015.)
More mass spectrometry...
* Hydride-in-a-cage: the H25- ion (January 22, 2017).
* Coupling the surgeon's knife to a mass spectrometer (August 13, 2013). Mass spec analysis as surgery proceeds guides the surgeon as to how much cancerous tissue to remove.
* US Army attacks colony collapse problem -- and an ethics story (October 25, 2010). Large scale mass spec analysis of bees helped to identify an infectious agent.
A post on the skin microbiota: Sharing microbes within the family: kids and dogs (May 14, 2013).
More shampoo: Nanotechnology leads to the development of a superoleophobic polypropylene -- and a better shampoo bottle (November 6, 2016).
Polio eradication: And then there were two
July 27, 2015
We'll jump the gun a bit... It looks like the number of countries with endemic polio is now down to two. The last recorded case of polio in Nigeria was July 24, 2014. As of last Friday, then, Nigeria has apparently passed the one-year mark of being polio-free; testing of recent samples still needs to be completed to make it official. That is a milestone. They did it by a serious attack on the problem over recent years.
The recent data for the two remaining polio countries is also encouraging. Further, those data, too, are supported by improved efforts to achieve the goal.
The only human disease to be eradicated is smallpox. Each disease raises different issues. The polio effort is going on in the glare of the modern world of the Internet. We have noted several steps along the way; perhaps we will all be watching as polio is eradicated -- at least the traditional polio.
News stories:
* Eradicating polio from Nigeria. (H Jafari, Director of the Global Polio Eradication Initiative, posted at The Lancet Global Health blog, July 24, 2015. Now archived.) A brief note to mark the milestone date.
* Public health: Smart shots bring Nigeria to brink of polio eradication -- The nation has embraced the latest research and innovative approaches to vaccination. (E Callaway, Nature News, July 15, 2015. In print: Nature 523:263, July 16, 2015) A nice news article about the Nigeria effort, in anticipation of the milestone date. The story notes that in 2006 (only 9 years ago), Nigeria had more polio cases than all the rest of the world combined.
Polio: Another country may be getting close to eradication (December 8, 2014). A hint this was coming.
Polio eradication: And then there were three (March 27, 2012). Three years ago -- and the story has held up.
An improved polio vaccine? (February 6, 2016).
Polio-like disease without polio virus? Follow-up (February 11, 2015). One of the complexities of the polio story is the possibility that a new virus causing similar disease may emerge. But that is a new story.
My page for Biotechnology in the News (BITN) -- Other topics includes a section on Polio. It includes a list of Musings posts on the topic. It also includes a link to a page with current polio statistics.
Making a new species in the lab
July 26, 2015
Can Man design a new species of organism?
Two organisms are considered to be different species if they are reproductively isolated, that is, if they cannot interbreed. There are complications to defining species, but that rather traditional view is useful for organisms with sexual reproduction.
It follows then... if we could engineer an organism so that it forms a new breeding population, unable to breed with the first, then we have created a new species.
A team of scientists now claims to have done just that.
The organism here is Schizosaccharomyces pombe, a yeast. It has a system of true sexual reproduction. There are two sexes, or "mating types"; they are called M and P. A cell of the M type makes a protein factor called the M-factor. The M-factor is secreted, and binds to a receptor on a P-cell. The binding of M-factor to the P-receptor is the basis of forming a mating pair. The mutual recognition of M-factor and P-receptor is the basis of species identity.
The following figure outlines the work...
|
The top part of the figure shows what happens with wild type (WT) yeast. The figure shows a WT M-cell at the left, and a WT P-cell at the right. You can see that the M-cell makes M-factor, which binds to the P-receptor, called Map3, on the P-cell. Pictorially, the square factor fits into the receptor with a square slot for it. That binding is what starts a mating event.
At the bottom, we have an M'-cell, which makes a mutant M-factor, which binds to a mutant P-receptor (mutant Map3) on the mutant P'-cell. Pictorially, the mutant factor is round (not square) and fits into a round spot on the receptor.
|
The top pair of cells is labeled as a wild type mating pair. The lower pair of cells is labeled as a novel mating type pair. Importantly, the two types cannot cross-mate; this is shown by the dashed lines in the middle, which are blocked. The two types are reproductively isolated.
That is, the two types of mating pairs shown here are for different species.
What's important here is that the novel mating type was created in the lab, by goal-directed engineering.
This is Figure 1A from the article.
|
How did the scientists do this? There are two steps. In outline... In the first step, they isolated mutant yeast that are unable to mate. They screened a collection of these, and found one that is unable to mate because it makes a mutant M-factor.
In step 2, they isolated mutants that can successfully mate with the M-factor mutants from step 1. These carry "suppressor" mutations in the gene for the P-receptor (Map3 gene), so that the mutant M-factor can now bind to the mutant P-receptor. It works. The mutant M cells from step 1 now mate with the mutant P cells from step 2. And the two types cannot cross-mate.
Here are some examples of the results showing the behavior of the two species (old and new). In these experiments two parental strains were crossed. The two parents had genetic "markers" that made it easy to follow them. In fact, in this case, the conditions were such that the two parents could not grow, but progeny from a successful mating could grow. Let's look...
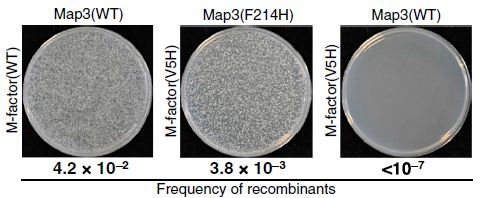
Start with the left-hand frame. This is for a cross between two members of the original species. The figure is labeled M-factor (WT) on the left and Map3 (WT) on the top. (Remember, Map3 is the P-receptor for M-factor.) There are lots of colonies on the dish; this means that the cross worked, as expected. The frequency of recombinants is given below the figure; it is about 4%.
The middle frame is a cross between two members of the newly constructed species. That is, it involves M' and P'. (The labeling shows some detail. For example, "M-factor (V5H)" means that amino acid #5 of the M protein has been changed from V (valine) to H (histidine). Again, there are lots of colonies on the plate; this cross, too, worked. The numbers say it isn't quite as good as the WT cross, but the cross worked.
The right-hand frame shows what happens in one case of a cross between members of the two species. The M-factor is that same new one, V5H, but the Map3 receptor is WT. The plate is clean; there are no colonies. From knowing how many cells they used, they can say that the frequency of recombinants is less than 10-7. That is less than 1/10,000 of the results within each species. The interspecies cross worked very very poorly -- if at all.
This is part of Figure 3 from the article. The full figure shows more such crosses. It includes the other cross between species; it gave a recombination frequency about 5x10⁻⁵.
|
That's the plan, and there are some results. Pretty good! A new species. An "artificial" species, made in the lab.
News story: How to Make a New Species. (R Williams, The Scientist, July 1, 2015. Link is now to Internet Archive.)
The article: Molecular coevolution of a sex pheromone and its receptor triggers reproductive isolation in Schizosaccharomyces pombe. (T Seike et al, PNAS 112:4405, April 7, 2015.)
The title of the article refers to a "sex pheromone". That's the M-factor. The general notion that one mating type makes something that attracts the other was described before the details were understood.
The abstract for the article concludes... "In conclusion, we have succeeded in creating an artificial reproductive group that is isolated from the WT group. In keeping with the biological concept of species, the artificial reproductive group is a new species."
Posts about the nature of species include...
* What if yeast had only one chromosome? (August 26, 2018).
* Nuclear-mitochondrial interactions -- and the definition of a biological species (June 18, 2017).
* Finding a gene behind the beak diversity of Darwin's finches (July 14, 2015).
* What if two of the world's most destructive pests spent the evening together in Fort Lauderdale? (April 4, 2015).
* Development of a new species of lizard in the lab (May 20, 2011).
Major sources of radiation exposure
July 24, 2015
The accompanying post (below) is about the effects of low dose radiation exposure. The news story that alerted me to the topic contains a resource that seems worth noting on its own.
The general idea of the following figure is that it gives the sources of radiation exposure for people in various places at various dates.
If you have trouble following the color key... The bars are in order as listed in the key. Radon is at the bottom of the key; its bar is the left-hand bar.
This is the figure from the news story listed below. I have included their header and other labeling. The source is given, over in the page margin somewhat cryptically, as "UN Scientific Committee on the Effects of Atomic Radiation".
|
Comments...
The radon bar, at the left, is one of the larger bars. Radon exposure is due to geology, and it varies a lot.
The other bar that is big and variable is for medical exposure. In fact, a major point of the figure is to show how this has increased dramatically in the United States over two decades. The recent data shown for US and Germany says that medical exposure to low dose radiation is, on average, half of our total exposure.
As an example... A single abdominal CT scan exposes the patient to 10 millisieverts (mSv). That is more than any of the bars in the figure above. Is it worth it to get a 10 mSv CT scan? Well, that is the question -- and it is one that really should be asked. We should at least recognize the risk. It may well be worth it, but what about cases where the scan is merely a precaution? Where would we draw the line?
News story: Medical research: Researchers pin down risks of low-dose radiation -- Large study of nuclear workers shows that even tiny doses slightly boost risk of leukaemia. (A Abbott, Nature News, June 30, 2015 (Corrected July 8, 2015). In print... Nature 523:17, July 2, 2015) This news story is also included with the following post.
The post immediately below is related: Effect of low dose radiation on humans: some real data, at long last (July 24, 2015).
For some cross-links to other Musings posts and such, see that post.
Effect of low dose radiation on humans: some real data, at long last
July 24, 2015
Radiation causes cancer. And the more radiation, the more cancer; the effect is proportional to the dose. That's all easy enough.
But there is a limit to what we can measure. At low doses of radiation, the effect -- if any -- is so small that it is almost impossible to measure. Yet, we are all exposed to low dose radiation, from various sources. (The accompanying post, immediately above, is about this.) We honestly don't know what the effect is; worse, there is active debate about it, because there are a variety of reasonable models.
Here are two models for what we might expect from low dose radiation. These are simple models, and are perhaps the major models that get discussed.
1) The linear relationship holds for all doses.
2) At low doses there is less effect than expected from the linear relationship, because we can adapt to it, or can repair some level of damage. That is, this model says that biology intervenes and protects us from some level of radiation; at higher doses, our protection is overwhelmed and we get the "real" effect.
What now? Some data. A new article measures low dose radiation exposure of 300,000 people over many years -- over 8 million person-years of exposure, and also looks at the incidence of cancer (leukemia) in the group.
Where does one get such a remarkable data set? From workers in the nuclear energy field, who wear radiation badges (dosimeters) that record their exposure. It has long been recognized that such workers may have an increased exposure to radiation. Thus they have long been monitored (and they are subject to restrictions). The article collects records for such workers in the US, UK and France.
Here is a summary of the findings...
|
The graph shows the risk of death from leukemia as a function of radiation dose to the bone marrow. The risk is shown as relative risk (y-axis), with the risk at zero dose taken as 1.
Zero dose here means zero as recorded by the dosimeters when the people are at work. They are still exposed to the normal background radiation.
|
There are three curves. Each shows the best-fit line based on a particular dose range, along with the 90% confidence limits. For example, the short red line at the left is for exposure of less than 100 milligrays (mGy).
The general observation is that the three lines are, statistically, all the same. The effect (risk of getting leukemia) seems to be linearly proportional to dose over the entire dose range. Further, the slope of the line here is about the same as has previously determined with higher doses. This supports model 1; there is no evidence for anything special going on at low doses.
This is the figure from the article.
|
For perspective... The average dose for these workers was 1.1 milligray per year. If a person received that dose for an entire lifetime, say 100 years, they would get about 100 mGy exposure. That would give them about a 30% increased risk of getting leukemia over the lifetime.
More specifically... In the population studied here, a population with a high exposure to radiation, 531 people died of leukemia. The authors estimate that 30 of those leukemia deaths, about 6%, could be statistically attributed to the occupational radiation exposure.
In both cases, we see that the increased risk of leukemia is small. But it is real. It can be hard for the public to digest what those statements mean. There is no inconsistency between saying that a risk is real but small. There is no inconsistency between saying "don't worry" while at the same time considering how we might reduce the exposure. However, if the risk is small, then we might ask if it is worth spending much effort reducing it. One answer to that is that the risk is not spread evenly. Understanding the risk, trying to minimize it, including trying to minimize accidents, can help reduce exposures in the long run.
Do we need to re-think our safety standards for radiation? The short answer is probably not. Standards are currently set using the linear dose response assumption (model 1), which is the more conservative model. The results here support that model.
Is this the last word? There is no last word in science. But this article is the best evidence we have so far about the effects of low dose radiation in humans.
A couple other studies, of similar scope, are in progress. We'll see if they all agree.
There are various questions one can raise about the details of this study. For example, the data suggest that the effect may be different for different cancers. In one case, they even found a negative effect -- with radiation dose reducing cancer. It is likely that some of these differences are simply due to the smaller sample size when looking at more specific types of disease. In any case, the big picture for now is to treat this as one answer: risk is proportional to dose, as far as we can measure it.
News story: Medical research: Researchers pin down risks of low-dose radiation -- Large study of nuclear workers shows that even tiny doses slightly boost risk of leukaemia. (A Abbott, Nature News, June 30, 2015 (Corrected July 8, 2015). In print... Nature 523:17, July 2, 2015) This news story is also the basis of the preceding post.
* "Comment" story accompanying the article; it is freely available: The merits and limits of pooling data from nuclear power worker studies. (M Blettner, Lancet Haematology 2:e268, Published Online, June 22, 2015.) If you want to get serious about the study, read this.
* The article, which is freely available: Ionising radiation and risk of death from leukaemia and lymphoma in radiation-monitored workers (INWORKS): an international cohort study. (K Leuraud et al, Lancet Haematology 2:e276, Published Online, June 22, 2015.)
The post immediately above is related: Major sources of radiation exposure (July 24, 2015).
Measuring radiation: The banana standard (April 17, 2011). This post introduces the confusing issue of how radiation is measured. You will note that the current work uses two units: the gray and the sievert. The gray is a real measurement; it is what the dosimeter measures. The sievert is an attempt to estimate the effective dose. Don't get lost in all that. The authors note that in this work they take 1 Gy as equivalent to 1 Sv.
Does radiation treatment of cancer cause new cancers? (April 8, 2011). An example of dealing with the trade-off of medical radiation.
More leukemia... Why some viruses may be less virulent in women (March 1, 2017).
More cancer... The role of combinations of chemicals in causing cancer? (September 21, 2015).
My page for Biotechnology in the News (BITN) -- Other topics includes a section on Cancer. It includes a list of related posts.
My page of Introductory Chemistry Internet resources includes a section on Nucleosynthesis; astrochemistry; nuclear energy; radioactivity. That section contains some resources on the effects of radiation. It also includes a list of related Musings posts.
July 22, 2015
Using wood-based material for making biodegradable computers
July 21, 2015
Briefly noted...
We have a new article about how to build computers. It is from the Forest Products Laboratory of the US Department of Agriculture (USDA) (and others). The proposal is to build computers (and consumer electronics in general) out of wood, rather than silicon. As a result, the computer would be biodegradable.
The proposal addresses a widely recognized concern: electronic waste is a big problem. There is a lot of it, and much of it is toxic.
To be clear, the scientists are not replacing the electronic circuitry with wood; they are replacing the substrate the circuitry is laid onto. In fact, this is the bulk of the material. What they use is a wood-derived product, cellulose nanofibril (CNF) paper.
The use of CNF-paper also leads to reductions in the use of toxic materials. As an example, the scientists explored making the component used in cell phones for transmitting the wireless signals; it contains gallium arsenide, GaAs. They show that using their CNF-paper substrate would lead to using less than 1% of the amount of arsenic used now in a standard phone.
The article is an interesting lead toward making more "eco-friendly" electronics.
News story: A 99% biodegradable computer chip. (Kurzweil, May 29, 2015.)
The article, which is freely available: High-performance green flexible electronics based on biodegradable cellulose nanofibril paper. (Y H Jung et al, Nature Communications 6:7170, May 26, 2015.)
Another approach... Silk-clothed electronic devices that disappear when you are done with them (October 19, 2012). The article discussed here is reference 17 of the current article. The current authors acknowledge this as work with a similar goal; they claim that the performance of the CNF material is better.
And... Biodegradation of an implant in the brain (April 5, 2016). This is a follow-up to the work reported in the post listed above.
And... A new way to recover valuable metals from discarded electronics (October 12, 2021).
More about toxicity of common electrical devices: CFL and LED lights: energy-efficient, but toxic (March 3, 2013).
More about wood and electronics: Wooden transistors (June 20, 2023).
More about wood: Building with wood: might it replace steel and concrete? (June 14, 2017).
More about cellulose nanofibrils... The strongest bio-material? (May 30, 2018).
Can the naked human eye measure distance to nanometer accuracy?
July 20, 2015
The human eye can typically see things as small as about 0.1 millimeter (1 mm = 10-3 m). A good light microscope lets us see things about a thousand-fold smaller, down to about 0.1 micrometer (1 µm = 10-6 m). A bacterial cell about 1 µm across is clearly visible with the microscope, though one can see little detail.
A new article reports getting humans to measure things much smaller than such bacteria, and without even using a microscope. The human observers are measuring distances to the nearest nanometer (1 nm = 10-9 m).
At first glance, that may seem remarkable. But perhaps what is as remarkable as anything is that it isn't really very remarkable. The scientists did not discover any new laws of physics or biology, or develop any fancy apparatus. The principle behind the new work is well known, and skilled users have been making use of it. What the new work does is to press the limits; the key tool they used was extreme care.
The new work involved measuring the thickness of some small pieces of film made out of titanium dioxide, TiO2. (The choice of material isn't important, except that it is easy to make well-defined thin films from it.)

|
This figure shows the seven thin films used. Photographs of the actual films are shown in the bottom row. The top row shows examples of the computer screen images that have been adjusted to match.
This is Figure 1 from the article.
|
Let's play for a moment... Can you tell the difference in the colors of the seven disks in the figure above? (By the way, this test -- and what they did in the article -- requires normal color vision.) With possibly one exception, I suspect you can. The thicknesses of the disks are given in the table (below, but it is not clear which disk is which in the figure). One pair of disks differs by only about 10 nm. Another pair differs by about 20 nm. Other pairs differ by about 40 nm. So, if you can tell the differences in most of these colors, you could tell the thickness of such a disk to within 20-40 nm. That's already rather good.
The actual test is a formalized version of that. Here is what the panel of observers in the article found...
|
The table lists the seven films, with two types of measurements. For each, there is d, the average thickness reported, and σ, the standard deviation. All values shown are in nm.
One type of measurement is what the observers recorded "by eye". The other is an instrument measurement; for convenience, we'll consider that to be the "correct" value. The column headers for the two types of measurements are shown with subscripts b and e, respectively.
|
An example, to make that clearer... The first row, sample #1... The observers reported a mean thickness db of 46.6 nm (with standard deviation σb 2.6 nm). The instrument reported a mean thickness de of 47.9 nm (with standard deviation σe 0.1 nm).
You can see that the mean for the observers was 1.3 nm less than the instrument value.
Look at the other rows, and the big message is the same. The observers are usually within about 1 nm of the instrument value. (The worst case is sample 6.)
This is part of Table 1 from the article. (The additional columns, omitted here, contain a couple other measurements; they are interesting, but do not change the basic story. Perhaps most interesting is that the electron microscope did poorly in this test; in fact, it had trouble seeing the samples at all.)
|
The results above show that the observers were able to estimate the thickness of each disk to within about 1 nm. Impressive.
What did they actually do? They matched the colors. But how? Here is a brief version... The thin film itself was placed on the computer monitor. The observer then adjusted the color of a nearby circular disk on the screen to match. For example, one pair of buttons allowed the observer to adjust the red-greenness to match the sample. Having the object being measured right on the screen helped to ensure consistency of lighting. The settings the observer used to match the color were compared to a standard curve -- thus giving the observer's measurement of the thickness. The measurements were fairly easy to make. An observer typically took less than two minutes to measure a thickness, which is in the same ball park as the instrument procedure.
The scientists are not suggesting that this is the proper way to make such measurements. For one thing, the relationship between color and thickness depends on the material. As much as anything, they were curious to see how well the human observers could do. Not bad, it seems.
Have you ever noticed the colors in a soap bubble? The colors are due, in part, to the thickness of the soap film making the bubble. That's the idea underlying these measurements. For a specific material, the relationship between color and thickness is well-defined and reproducible.
Are you concerned that the observers aren't really measuring distance; they are measuring color, and figuring out the distance from the relationship? That's true, but it's fine to measure something indirectly. We use the time of an echo to measure distance. Same idea. But it is true that the trick here to measuring distance to 1 nanometer is to make direct observations of some other property -- one that we can relate back to distance.
News stories:
* Thanks To Color Vision, The Human Eye Can Distinguish Between Most Subtle Nanoscale Differences. (L Bushak, Medical Daily, July 9, 2015.)
* How to visually determine thickness at one-nanometer resolution by eye. (Kurzweil, July 10, 2015.)
The article, which is freely available: Human color vision provides nanoscale accuracy in thin-film thickness characterization. (S Peterhänsel et al, Optica 2:627, July 2015.)
More about high resolution distance measurements...
* Expansion microscopy: making an object bigger can make it easier to see (February 23, 2015).
* Characterization of carbon nanotubes (December 3, 2013).
More on human vision... The limits of the human visual system: can humans detect single photons? (October 7, 2016).
Posts on color vision include:
* Color vision: an overview (December 1, 2014).
There is a section of my page Internet resources: Biology - Miscellaneous on Medicine: color vision and color blindness. It includes a list of related Musings posts.
Increased risk of congenital heart defects in offspring from older mothers: Why? and can we do anything about it?
July 18, 2015
The incidence of congenital heart defects increases with the age of the mother. It is not understood why.
A new article reports a clever experiment that reveals part of the story -- and offers some hope for dealing with the problem.
The question the scientists asked here was whether the effect was due to the age of the mother per se or to the age of the egg cells (the oocytes). They addressed this in a model system with mice; the mice carried a mutation that increases the risk of heart defects. The scientists transplanted ovaries between young and old mice. Thus they had young mothers with old ovaries, and vice versa. They then looked at the incidence of the defects in the offspring of these mice.
The following figure summarizes the results...
|
The graph shows the incidence of heart defects (y-axis) for the two hybrid conditions. The scientists are scoring a particular type of defect, called ventricular septal defect (VSD).
Careful... The graph shows three sets of bars, but there is only one set of data here. The middle pair of bars, labeled "Observed", shows the results. The dark bar is for old mother with young ovaries; the light bar is for young mother with old ovaries. (See the key at the right of the graph.)
|
The dark bar, for old mother with young ovaries, gives the highest incidence of heart defects. That is, it is the age of the mother that matters, not the age of the ovaries (or eggs).
What about those other two sets of bars? They are the predictions, for one or the other model. You can see that the actual results (middle set) substantially match the expectations based on maternal effect (left-hand set).
This is the lower part of Figure 1 from the article.
|
So, the results show, rather clearly, that the age of the mother is the important factor here, not the age of the eggs. That's interesting, and perhaps unexpected.
Age of the mother? Physiology of the mother, perhaps? The result raises the question of whether anything can be done to reduce a mother's chances of having a child with a heart defect. One thing the scientists tried was having the mouse mothers exercise, prior to conception. Turns out this reduced the rate of heart defects in the offspring by half. That's a big effect.
Caution... This is mouse work. Mouse work using a specific mutation that increases the rate of heart defects. (It is similar to a mutation found in humans.) The findings here may or may not apply to humans, may or may not apply to other causes of heart defects. How does the exercise effect carry over to humans? Who knows? Mouse work gives us leads that can be tested in humans; sometimes that is fruitful, sometimes not.
News story: Exercise for older mouse mothers lowers risk of heart defects in babies. (Science Daily, April 1, 2015.)
The article: The maternal-age-associated risk of congenital heart disease is modifiable. (C E Schulkey et al, Nature 520:230, April 9, 2015.) Check Google Scholar for a freely available copy of the preprint.
Other heart posts include...
* A drug for heart hypertrophy? (March 4, 2016).
* The opah: a big comical fish with a warm heart (July 13, 2015).
* Can we pinpoint a specific molecular explanation for tissue damage following a heart attack? (March 24, 2015).
* Mutations that lead to reduced risk for heart disease (November 21, 2014).
* Fixing the heart with some glue and light (July 27, 2014).
A recent post on a maternal effect on the outcome of pregnancy: A gene that reduces the chance of successful pregnancy: is it advantageous? (May 18, 2015).
And...
* How oocytes limit oxygen-induced aging (August 20, 2022).
* Why human egg cells become increasingly defective as the mother ages (June 21, 2016).
A DNA test that can distinguish identical twins
July 17, 2015
It's now routine to identify individual people by their DNA. In fact, there are enough differences between people that sampling small portions of the genome is sufficient to distinguish them.
A limitation of DNA testing is that monozygotic twins, commonly called identical twins, cannot be distinguished by the common tests.
It now seems likely that even identical twins differ in a "tagging" of their DNA, called methylation. However, routine analysis of genomes for such methylation is expensive.
A new article reports a new way to uncover these methylation differences.
Ordinary DNA consists of two strands wrapped around each other. Upon heating a DNA sample, the two strands separate. That process is commonly called melting the DNA; the temperature at which it occurs is called the melting temperature (Tm) of the DNA. The exact temperature at which the strands separate depends on the nature of the DNA. The new work shows it depends on the methylation -- and can be used to distinguish the DNA of identical twins.
The effect of methylation on the melting temperature is indirect. The scientists do not measure the TM of the original DNA. Instead, they do a chemical treatment of the DNA, which itself is affected by the methylation. It is that treated DNA that they measure.
The following figure shows an example...
Adjacent bars, blue and red, represent testing one pair of identical twins. The y-axis shows the melting point of the DNA, tested for one specific gene.
Compare the two bars of each pair. In some cases, they are quite different. For pairs 2 and 4, the melting points are sufficiently different that they are marked with two stars; this means they are different at the p < 0.001 level. For pairs 3 and 5, the bars get one star; this means they are different at the p < 0.05 level. For pair 1, the results do not distinguish the two twins.
(Pair 6, at the right with two blue bars, is a control: the same individual was tested twice. You can see that the results were similar for the two tests with the same person.)
This is Figure 3 from the article.
|
A cautious interpretation is that the results show that the method might work, sometimes. That is, the results shown here are encouraging, but hardly overwhelming.
The scientists also tested the melting of another gene. Those results are similar -- in fact, a little better. Two pairs of twins got two stars, and the other three got one star. (I chose to show the results that were less good.)
The method developed here is relatively easy to carry out. Not easy, but easier than other methods offered to distinguish the DNA of identical twins. It seems to have promise. The current article establishes that it can work. It's not clear how well or how often; that will require further work. Remember, we said there is currently no good way to distinguish the DNA of identical twins. This is a useful lead.
News story: Crime scene discovery: Scientist separates the DNA of identical twins. (Science Daily, April 23, 2015.)
The article: Differentiating between monozygotic twins through DNA methylation-specific high-resolution melt curve analysis. (L Stewart et al, Analytical Biochemistry 476:36, May 1, 2015.)
More about twins...
* Identical twins: an epigenetic marker, which may allow people to tell if they are an identical twin (October 16, 2021).
* Unusual twins: neither monozygotic nor dizygotic, but... (March 11, 2019).
* Twins? A ducky? Spacecraft may soon be able to tell (August 4, 2014).
* Malnutrition: is more (or better) food the answer? (March 8, 2013).
* Twins (April 30, 2009).
Methylation of DNA is an example of an epigenetic modification: a change in the DNA that does not affect its common base-pairing properties. The role of epigenetics is a hot -- and murky -- subject. Here is another post that notes an epigenetic modification: Why the facial tumor of the Tasmanian devil is transmissible: a new clue (April 5, 2013).
There is more about genomes on my page Biotechnology in the News (BITN) - DNA and the genome. It includes an extensive list of related Musings posts.
July 15, 2015
Finding a gene behind the beak diversity of Darwin's finches
July 14, 2015
Briefly noted -- an update to a story from the mid-19th century.
Darwin's finches are an icon of the story of evolution. Briefly, Darwin found diverse finches in the Galapagos Islands; each had some special adaptation that made it specialized for a particular feeding habit. In particular, the finches had a variety of beak structures, each allowing it to eat a particular type of food. One could imagine that a single type of ancestral finch had come to these remote islands long long ago, and diversified to fill a variety of niches on the islands. Since the various finches seemed to not interbreed, one could infer that new species of finch had arisen, each with a specialized feeding adaptation.
We now have an article reporting genome sequences of many of the finches from the Galapagos Islands. The genome work reveals the genetic basis of the differences that Darwin observed.
In some sense, there is nothing particularly exciting in the new article. After all, the differences were known; there must be a genetic basis, and now we see what it is. The big story here is the closure, finding the explanation behind this legendary 19th century finding.
But it's also true that the genetic findings were not simple. The story is more complex than Darwin imagined. That, too, is not surprising; that's typical as we learn more about a system.
Let's note a couple of the findings, one relatively simple -- and one not.
One gene was of particular importance. Differences in the gene ALX1 were clearly related to beak type. ALX1 is involved in making facial bones; in humans, mutations in the corresponding gene lead to deformities such as cleft palate.
The species distinctions are not as simple as it had seemed. At least some of the finches that had been considered distinct species are probably interbreeding, at least occasionally.
News stories:
* Genomes reveal Darwin finches' messy family tree. (J Webb, BBC, February 11, 2015.)
* DNA Reveals How Darwin's Finches Evolved -- A study finds that a gene that helps form human faces also shapes the beaks of the famously varied Galápagos finches. (W Cornwall, National Geographic, February 11, 2015. Now archived.)
* Two news stories in the journal:
- A brief item in the same issue as the article: Evolution: Finches sequenced. (M Skipper, Nature 518:308, February 19, 2015.)
- A news story, the week before the print version of the article (may be freely available): Evolutionary biology: Darwin's finches join genome club -- Scientists pinpoint genes behind famed beak variations. (G Marsh, Nature 518:147, February 12, 2015.)
* The article: Evolution of Darwin's finches and their beaks revealed by genome sequencing. (S Lamichhaney et al, Nature 518:371, February 19, 2015.) Check Google Scholar for a freely available preprint pdf.
Posts about Darwin and Darwinism include...
* UCA passes test (June 6, 2010).
* Evolution of the end of Origin (November 30, 2009).
More finches... Are urban dwellers smarter than rural dwellers? (August 2, 2016).
A book, which is listed on my page of Books: Suggestions for general science reading... Weiner, The Beak of the Finch: A story of evolution in our time (1994). Note a related book linked there; it is by Rosemary and Peter Grant, who are co-authors of the current article. Also, see books by Jones and by Stott for a couple of other books with unusual takes on Darwin.
More about the nature of species: Making a new species in the lab (July 26, 2015).
There is more about genomes and sequencing on my page Biotechnology in the News (BITN) - DNA and the genome. It includes an extensive list of Musings posts on the topics.
The opah: a big comical fish with a warm heart
July 13, 2015
We'll focus here mainly on the warm heart (and some related issues).
Fish are typically ectotherms; the common term is cold-blooded. Their body temperature is substantially that of their surroundings. In contrast, birds and mammals are endotherms (warm-blooded); they produce excess heat and maintain their body at a temperature higher than that of the surroundings.
Things need not be that simple. There is no requirement that any particular type of animal fit into one of two distinct categories. And there is no requirement that any particular species has all the common characteristics of its group. We have noted these points before, in discussions of whether dinosaurs were warm- or cold-blooded. One view is that they were perhaps intermediate -- like some fishes [link at the end].
A recent article is about a little-studied strange-looking fish, the opah, Lampris guttatus; it is also known as the moonfish. The scientists present data showing that this fish is not cold-blooded.
Here is an example of their results...
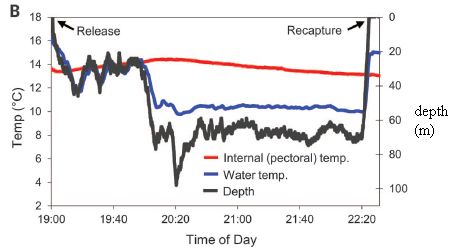
|
The graph reports measurements for a fish swimming in the ocean. The x-axis shows the time.
Start with the black curve -- the lowest one for much of the figure. This shows the depth of the fish in the ocean; see the y-axis scale at the right.
|
Then look at the blue curve, just above the depth curve. This shows the water temperature (T); see the y-axis scale at the left.
You can see that the water T closely follows the water depth.
And now, the important part... look at the red curve. It is for the fish body T. More specifically, it is the T of the pectoral muscle; the fish had been fitted with a thermocouple, and allowed to swim freely (though on a leash). You can see that the fish T is substantially constant, about 14 °C, throughout the time measured. The fish spends substantial time at two different depths, with different water T, but the body T remains 14 °C.
This is Figure 1B from the article. I have added the label for the right-hand y-axis, which is, oddly, missing in the article.
|
In summary, the figure above shows that the fish maintains a pectoral muscle T very near 14 °C, regardless of the water T. That's about 5 degrees above the cold water T experienced for an extended time. That's what warm-bloodedness (endothermy) means. At least within the limits of this experiment, the opah appears to be an endothermic fish.
In another experiment, the scientists measure the T over the entire body of a freshly killed specimen. That whole body T profile shows that the whole body is warm. One thing that stands out is the region of the heart, which is unusually warm. Keeping the heart warm allows the animal to swim better in the cold water.
How does the fish do it? Well, the scientists do some anatomical work. A fish, like any animal, is exposed to the environment, at the surface and where the environment intrudes. For a fish, that is the gills. The opah has an unusual arrangement of blood vessels. Blood that gets cooled in the gills is quickly reheated by being passed near warm blood. Engineers would call such a process "counter-current heat exchange." This heat exchange is done right in the gills; the cold blood is not allowed to cool the animal body. The opah not only keeps its body warm, and its heart extra-warm, but we can begin to see how it adapts to achieve its own form of warm-bloodedness.
It's an interesting study. Limited endothermy in fish has been noted before, with some parts of the body kept warm; this is called "regional" endothermy. But the opah is perhaps the most endothermic fish yet found, with its whole body kept warm. The warm heart is striking and novel. As typical of new observations, there is much more we would like to know. For example... Is the fish still able to maintain the same body T in even colder water? Does its ability to maintain T limit its range?
News story: First fully warm-blooded fish: The opah or moonfish. (Science Daily, May 14, 2015.) Includes a picture of a person holding an opah; that will give you an idea of the size and appearance of the fish (and of the lead author of the article). The fish shown is not a particularly large specimen; apparently, some can be two meters across.
Video. There is a short video associated with the article, as supplementary material. The video shows underwater footage of an opah swimming. It is also available at YouTube. (30 seconds; no sound)
The article: Whole-body endothermy in a mesopelagic fish, the opah, Lampris guttatus. (N C Wegner, Science 348:786, May 15, 2015.) Check Google Scholar for a freely available pdf; there is one from NOAA, the government agency where this work was done.
Background post about endothermy: Were dinosaurs cold-blooded or warm-blooded? (August 23, 2014). This post suggests that dinosaurs were mesotherms -- intermediate, as are some fishes.
More: Facultative endothermy: a lizard that is warm-blooded in October (February 1, 2016).
Another comical fish... CO2 emissions threaten clowns (September 20, 2010).
Also see:
* The oldest known dog leash? (January 23, 2018).
* The role of mutation in heart disease? (April 25, 2017).
* A drug for heart hypertrophy? (March 4, 2016).
* Fish make their own sunscreen (September 29, 2015).
* How the giant panda survives on a poor diet (August 2, 2015).
* Increased risk of congenital heart defects in offspring from older mothers: Why? and can we do anything about it? (July 18, 2015).
A new botulinum toxin -- and a story of how we deal with dangerous things
July 11, 2015
There is a little science story here, but perhaps more important is the story of how it was handled. We'll note the science briefly, and then go on to the latter.
A couple years ago, a novel form of botulinum toxin was discovered -- in a sick kid. Of particular interest, none of the available antibodies used to neutralize botulinum toxin could neutralize the new toxin. Since botulinum is one of the most potent toxins known, the new finding was of concern; a potent toxin without an antidote.
Terminology... Botulism is the name of the disease. It is caused by a neurotoxin known as botulinum, which is made by Clostridium botulinum bacteria.
A new article reports further analysis of the new toxin. It is indeed somewhat novel. However, in the new work scientists found that one of the existing anti-botulinum antibodies did neutralize the new toxin. (Exactly why the first group did not see that is not clear, but is not particularly important for the moment.)
That's the science story. Now, what is the story behind this story? It is the issue of how we deal with scientific findings that may be dangerous. The botulinum toxin work is an example of what we call dual-use research. It is important that science study the new toxin, so we understand its source and learn how to neutralize it. But it is something that also could be put to ill use. (Don't confuse this with "classified" research, in organizations where research is kept secret as a matter of course.)
Science is based on transparency. If anything, the trend nowadays is to emphasize that. All data and materials are to be made publicly available. Does that mean that the people who found the new toxin and sequenced its gene should publish all that information? Should we make public the gene sequence for what, arguably, might be the most dangerous toxin known? If you find that particular question easy to handle, be careful. The field is broad, and all sorts of questions come up. Governments and scientists are trying to hash out what the rules should be. There are tentative policies, but only limited agreement on what they should be.
The main point here, whether you have much interest in the new toxin or now, is to read the story as an example of how a specific case of dual-use research was handled. Both the news story from CIDRAP and the editorial in the journal discuss various aspects of this. I make no claim that anything in particular was done right, or not -- and neither do they. Read these materials for the questions they raise.
News story: Study: Novel botulinum toxin less dangerous than thought. (R Roos, CIDRAP, June 17, 2015.)
* Editorial accompanying the article; it is freely available: A novel botulinum neurotoxin and how it tested our scientific institutions. (P Keim, Journal of Infectious Diseases 213:332, February 1, 2016.)
* The article, which is freely available: A Novel Botulinum Toxin, Previously Reported as Serotype H, has a Hybrid Structure of Known Serotypes A and F that is Neutralized with Serotype A Antitoxin. (S E Maslanka et al, Journal of Infectious Diseases 213:379, February 1, 2016.)
More botulism: A treatment for botulism -- using a modified botulinum toxin (February 8, 2021).
A post about another toxin-forming Clostridium: Fecal transplantation as a treatment for Clostridium difficile: progress towards a biochemical explanation (February 8, 2015).
Recent post about a toxin... Is the lychee (litchi) a toxic food? (May 11, 2015).
My page for Biotechnology in the News (BITN) -- Other topics includes a section on Ethical and social issues; the nature of science. It includes a list of related Musings posts.
A simpler way to make styrene
July 10, 2015
Styrene is a major commercial chemical. Most famously, it is used to make the common and useful plastic polystyrene. A new article offers a new way to make styrene.
The following figure serves as a framework for our discussion. It outlines the current and proposed pathways to make styrene.
Start at the left. The figure shows the starting materials, benzene + ethylene.
Ethylene is shown as a =. That follows common organic chemistry shorthand, even though seeing it used for something so simple may seem odd. The = is for a double bond. There is a C at each end, and H as needed. Thus, that = represents H2C=CH2.
The current pathway for making styrene is shown at the top; the new pathway, proposed from the current work, is at the bottom. Styrene is that chemical shown at the end of each pathway. It looks like ethylene attached to the benzene ring. If only it were so easy to actually do!
A couple of observations to get us started...
1) Fewer steps in the new process.
2) Lower temperature in the new process. The new process is done at "≤200 °C"; the three steps of the current process all require higher T, with one shown as ≥550 °C.
This is Figure 1 from the article, with the original legend included.
|
The key to developing the new process was finding a good catalyst. Such work typically involves a lot of trial and error building on previous experience. Catalysts are often expensive metals, and the ability of the catalyst to survive for a long time without degradation is critical to the economics. Here, the scientists found a catalyst based on rhodium that appeared quite stable over the periods tested; that was a big improvement over previous work with platinum.
In fact, they had made the change from Pt to Rh because they predicted that Rh would work better. The Pt catalyst, which contained oxidized Pt, was reacting to form Pt metal, effectively eliminating the catalyst. Rh is less likely to react this way; their results confirm the prediction.
Ultimately, the choice of a process is largely driven by economics, and further work will be needed to address that seriously. For now, the new process looks promising. As noted above, it is simpler and need less energy. It makes fewer by-products; this has two advantages: it increases the efficiency of use of the benzene (a fossil fuel resource), and it simplifies purification of the product. On the other hand, the reaction rate so far is probably not good enough, and the reaction has been studied only at lab scale.
News story: Novel catalyst used to make styrene in one step. (H Zeiger, Phys.org, May 5, 2015.)
The article: A rhodium catalyst for single-step styrene production from benzene and ethylene. (B A Vaughan et al, Science 348:421, April 24, 2015.)
If you're curious... The rhodium compound used as the catalyst is (FlDAB)Rh(TFA)(η2-C2H4), where FlDAB is N,N'-bis(pentafluorophenyl)-2,3-dimethyl-1,4-diaza-1,3-butadiene and TFA is trifluoroacetate. There is a drawing of the structure in the article; it is compound 1 in Figure 3.
Posts about catalyst development include...
* A tunable catalyst (July 25, 2022).
* Low temperature treatment for auto exhaust? (February 18, 2018). Lonks to more.
* 2 + 2 = 4: Chemists finally figure it out (October 9, 2015).
* Turning lignin into a useful product (April 11, 2015).
* Photosynthesis that gave off manganese dioxide? (July 21, 2013).
* Hydrogen cars? (June 24, 2009). Go on to the discussion on the supplementary page.
More about polystyrene: Polystyrene foam for dinner? (October 19, 2015).
More about plastics...
* A "greener" way to make acrylonitrile?
(January 6, 2018).
* History of plastic -- by the numbers (October 23, 2017).
* Shark skin inspires design of a new material to reduce bacterial growth (March 13, 2015).
* Degradable polyethylene isn't (October 17, 2011).
This post is listed on my page Introduction to Organic and Biochemistry -- Internet resources in the section on Aromatic compounds.
July 8, 2015
Skinny jeans: How tight is too tight?
July 8, 2015
Perhaps when they cause rhabdomyolysis and peroneal and tibial neuropathies. So we might infer from a case report just published in a medical journal.
After four days of treatment, the patient was able to walk unaided.
News story: Fashion Victim In Tight Pants Experiences Nerve And Muscle Damage: Medical Conditions Caused By Skinny Jeans. (S Olson, Medical Daily, June 22, 2015.)
* Press release from the journal, posted with the article: Squatting in 'skinny' jeans can damage nerve and muscle fibres in legs and feet.
* The article: Fashion victim: rhabdomyolysis and bilateral peroneal and tibial neuropathies as a result of squatting in 'skinny jeans'. (K Wai et al, Journal of Neurology Neurosurgery & Psychiatry 87:782, July 2016.)
More about jeans:
* Using old clothes as building materials? (February 5, 2019).
* A better way to make (the dye for) blue jeans, using bacteria? (March 5, 2018).
Also see... Can you get sick from the street cleaning truck? (December 10, 2017).
Quiz: What is it, and ... ?
July 7, 2015
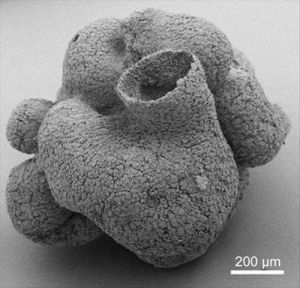
|
1. What is it?
2. How old is it?
You may well be able to guess what kind of animal this skeleton is from. As to age... Well, if we bothered to ask...
Answers below.
This is reduced from the figure in the news story listed below. It is probably the same as Figure 1A from the article.
|
Answers and discussion...
The picture shows a sponge. The picture was taken by scanning electron microscopy (SEM).
As to its age... Well, it is old. In fact, it is the oldest known sponge, as reported in a new article. It's about 600 million years old. That dates it to about 60 million years before the start of the Cambrian era, which was marked by an explosion of animal diversity.
Molecular biologists estimate that animals appeared at least 700 million years ago, but physical evidence for them is weak. The sponges are one of the oldest groups of animals. This specimen gets us a little closer to the beginning of Animalia.
The article shows many more images, both from SEM and X-ray analyses (CT scans). Some are at much higher resolution than this one. The specimen is in excellent condition. The overall anatomy is very clear, and many cell types are apparent.
The authors name this novel sponge Eocyathispongia qiania.
News story: Oldest known sponge found in China. (B Yirka, Phys.org, March 10, 2015.)
The article, which is freely available: Sponge grade body fossil with cellular resolution dating 60 Myr before the Cambrian. (Z Yin et al, PNAS 112:E1453, March 9, 2015.)
Previous post about a sponge: Theonella's secret: Entotheonella (March 18, 2014).
A post about simple animals: A novel nervous system? (July 20, 2014). This post is about comb jellies; it links to other posts about the simplest animals.
* Previous quiz: Quiz: What are they? And are they a threat to you? (October 20, 2014).
* Next: Quiz: What is it? (August 17, 2015).
Our Loki ancestor? A possible missing link between prokaryotic and eukaryotic cells?
July 6, 2015
Bacteria, archaea, eukaryotes. Three domains of equal rank, all coming from a shared ancestor. In recent decades that has been the dominant view of the top level of classifying organisms. However, an alternative view has been put forward: that the eukaryotes are more a branch off the archaea than they are a domain of equal rank. Sometimes this seemed little more than speculation, but some significant supporting evidence has emerged in recent years. Both the traditional three-domain view and the eukaryotic-branch view have been noted in Musings posts [links at the end]. In any case, we do not really understand how the eukaryotic cell arose.
We now have a report of a newly discovered microbe that may help us understand the origin of eukaryotes. It is a microbe -- an archaeon -- that is more like a eukaryote than any other known microbe. (We use "microbe" here to refer to the bacteria and archaea, collectively called the prokaryotes.) Let's look at what we know -- and don't know -- about this novel bug.
The heart of the story is based on sequencing DNA from sediments in the Arctic Ocean near a thermal vent. Preliminary analysis suggested there were some novel organisms, so sequencing was continued. The result was a fairly complete genome, with some interesting features. It is an archaeal genome; in fact, it is very near the group of archaea that has already been suggested to be closest to the eukaryotes.
Importantly, this new archaeal genome contains numerous genes that are characteristically eukaryotic-like. For example, the genome seems to code for proteins that might relate to phagocytosis, a process of cells taking up things by surrounding them with a membrane. This is a process typical of eukaryotic cells, but not of prokaryotes. Not only might this reveal the origin of phagocytosis, it could be useful for some of the suspected early steps in making the first eukaryotic cells, by taking up other bacteria, destined to become mitochondria. The scientists also got partial sequences for two other archaea that seem to be related.
The scientists have tentatively named this new microbe Lokiarchaeum. Along with the related partial sequences, it is the founding member of a suggested new phylum, the Lokiarchaeota. Interestingly, their best fit to a good family tree placed the eukaryotes with this Lokiarchaeota group.
|
A new family tree for diverse archaea, incorporating the Lokiarchaeota, which are newly reported here.
|
Focus on the yellow-shaded block. It includes the three Loki genomes (one complete and two partial) noted above; these are collectively labeled Lokiarchaeota. That yellow block also contains the Eukarya -- closer to the Lokiarchaeota than to anything else.
Also note the label TACK at the right. This brackets a group of archaea that had previously been suggested to be eukaryotic-like. The new Lokiarchaeota group is within TACK, and is the closest archaea to the eukaryotes yet known.
This is Figure 2b from the article.
|
A picture of this new bug? We don't have one. In fact, the scientists have not seen it at all. They have not isolated it. They have inferred its existence by analyzing the DNA in an environmental sample. They find pieces of DNA that seem to connect together to make the chromosome with the properties described here. This is a common approach nowadays; it is made possible by rapid inexpensive DNA sequencing, which allows samples to be sequenced even though we do not have the organisms. The approach is called metagenomics.
What are we to believe? We have genome evidence for a novel and interesting microbe. It is a lead. It may help the scientists find the organism that goes with this genome. It may lead to finding other genomes, related or similar. When (if?) more evidence becomes available, this could lead to a better understanding of how eukaryotes arose. However, even if the current article correctly describes the new microbe, there is no assurance that it has anything to do with the ancestry of eukaryotes. Perhaps there are many other eukaryotic-like archaea out there, yet to be discovered; the current work is a reminder that there is more to discover.
This article provides some novel and tantalizing evidence, on which we can build all sorts of speculations -- and future work. An intriguing story.
News stories:
* Newly found microbe is close relative of complex life. (P Rincon, BBC, May 6, 2015.) Includes a picture of Loki's Castle, after which the new bug is named. (If you want to know who Loki was, check Wikipedia.)
* Prokaryotic Microbes with Eukaryote-like Genes Found -- Deep-sea microbes possess hallmarks of eukaryotic cells, hinting at a common ancestor for archaea and eukaryotes. (J Madhusoodanan, The Scientist, May 6, 2015. Link is now to Internet Archive.)
* News story accompanying the article: Evolution: Steps on the road to eukaryotes. (T M Embley & T A Williams, Nature 521:169, May 14, 2015.)
* The article: Complex archaea that bridge the gap between prokaryotes and eukaryotes. (A Spang et al, Nature 521:173, May 14, 2015.) Check Google Scholar for a freely available preprint pdf.
Background posts about the three-domain model and the origin of eukaryotes:
* Origin of eukaryotic cells: a new hypothesis (February 24, 2015). Another model.
* Are there really three domains of life? (January 12, 2013). Discussion of the possibility that eukaryotes arose from within the archaea. Compare the family tree shown above with the one in this post.
* Carl Woese and the archaea (January 12, 2013). Discovery of the archaea.
Major follow-up posts (Loki is an Asgard):
* An Asgard in culture (February 4, 2020).
* The Asgard superphylum: More progress toward understanding the origin of the eukaryotic cell (February 6, 2017).
There is more about genomes and sequencing on my page Biotechnology in the News (BITN) - DNA and the genome. It includes an extensive list of Musings posts on the topics.
This post is noted on my page Unusual microbes.
Book... See my page Books: Suggestions for general science reading: Forterre, Microbes from Hell (2016). Forterre addresses the nature of Loki, which was published just as he was finishing his book.
Magnetic turtles
July 5, 2015
Animal migrations are fascinating. Some involve very long distances. How do the animals know where to go? Some migrations span many years, making them all the more mysterious -- and harder to study.
A new article offers a clue about sea turtle migrations. These animals are born on land, spend many years at sea, and then return to land to reproduce. Remarkably, they return to their birthplace. The new work exploits what is usually considered a difficulty of the system: the migratory cycle is very long.
It has been suspected that the turtles use some magnetic sense to find their birthplace. That hypothesis leads to an interesting prediction... Magnetic fields change. In some places, the magnetic field lines are converging over time: they are becoming closer together. In other places, they are diverging: becoming further apart. The prediction is that if the magnetic field lines are converging, the density of nesting turtles will become higher over the years.
Think about... If the magnetic field lines are converging, it means that two places that were a certain distance apart, magnetically, when the turtles were born are now closer together. In the extreme case, two places that were separate when the turtles were born may now be in essentially the same place. So when the turtles come back and look for their birthplace, they end up closer together, or, in the extreme, in the same place.
The following figure shows the data...
|
The graph reflects how the density of nesting turtles has changed during the study period for regions of converging and diverging magnetic isolines.
An isoline is a line between places of a particular value of the magnetic field.
Exactly what the y-axis shows is unclear. I think it is the average of all the changes observed for two-year steps.
This is Figure 2 from the article.
|
It's clear: the density of nesting turtles has been increasing in regions of converging magnetic isolines. The observation supports the hypothesis.
It is a simple and elegant experiment. It does not require collecting data about individual turtles from birth to return. (It merely requires checking the records, both of nesting sites and magnetic lines.) We also caution, as always... this is a piece of evidence, not a proof. Nevertheless, for now, one can imagine that a baby turtle is imprinted with the magnetic address of its birthplace. When it returns from the sea years later, it looks for that same magnetic address. How either of those steps is done is open.
News story: For sea turtles, there's no place like magnetic home. (Science Daily, January 15, 2015.)
* News story accompanying the article: Animal Navigation: Memories of Home. (J L Gould, Current Biology 25:R104, February 2, 2015.)
* The article: Evidence for Geomagnetic Imprinting and Magnetic Navigation in the Natal Homing of Sea Turtles. (J R Brothers & K J Lohmann, Current Biology 25:392, February 2, 2015.)
It was already known that these turtles had a magnetic sense, which they used for navigation. What's new here is showing that it plays a key role in returning to the birthplace to form a new nest.
Other posts about migrations include...
* Anne's journey across the Pacific (July 6, 2018).
* Offering the monarch butterflies milkweed may not be good for them (May 5, 2015).
* The First Americans: the European connection (February 8, 2014).
More about magnetic fields...
* The nature of a bio-compass? (June 10, 2016).
* Can blind rats learn to use a geomagnetic compass? (June 29, 2015).
* What if your compass pointed south? (October 24, 2014).
More about sea turtles...
* Red color vision in dinosaurs? (October 17, 2016).
* What did Osedax worms eat before there were whales? (May 30, 2015).
* Why might it be good to put lights on fish nets? (September 9, 2013).
* Where is turtle #92587? (February 22, 2011). Part of a project to track individual turtles.
July 1, 2015
A person who might, just possibly, have met his Neandertal ancestor
June 30, 2015
Analysis of human genomes in recent years has made it clear that modern humans throughout most of the world, except sub-Saharan Africa, contain about 2% of their genome from Neandertals.
It seems likely, then, that some time ago, a Neandertal and a "modern human" (Homo sapiens) interbred, resulting in a hybrid child. Over time, that child and his descendants bred with modern humans; the amount of Neandertal DNA in the genome decreased over the generations, and the size of regions of Neandertal DNA became smaller. (Of course, many scenarios were possible; this is just to give the big trend. Neandertals died out.)
A new article reports a genome sequence from a person estimated to be about 40,000 years old -- from about the time the Neandertals were dying out. This genome contains more Neandertal DNA and larger blocks of Neandertal DNA than any other sample of modern human DNA yet analyzed.
Here is an example of the results...
Analysis of chromosome 5. The analysis looks at sites where the reference Neandertal genome is distinctively different from that of modern humans. That is, it looks at sites that are diagnostic as Neandertal.
The vertical blips show spots where the sequence of the sample agrees with that of the reference Neandertal genome.
The top row, labeled O, is for the current specimen, called Oase 1. (The specimen was found near Pestera cu Oase, Romania.) The other rows are for various other human samples, for comparison.
You can see that there is a region densely packed with such agreements between Oase 1 and the Neandertal reference. That region is marked with a gray bar. There is another such region about the same size on chromosome 12. These are regions that are probably unbroken Neandertal DNA; they are the longest such regions found in any human samples.
This is part of Figure 2 from the article. The complete figure contains the analysis of the entire chromosome set.
|
The authors estimate that this person was 4-6 generations away from the original modern-Neandertal hybrid. Using the larger end of that range, the authors suggest that this person lived within 200 years of the hybridization. Using the smaller end of the range, he had a great-great-grandparent who was a "pure" Neandertal. Some people know a great-great-grandparent; it is possible that the person sequenced here knew that Neandertal ancestor. (That point is for perspective on the time scale; it is not intended to be a claim of fact.)
More notes about the person analyzed here...
* The specimen bears physical features of both modern humans and Neandertals.
* Analysis of the specific Neandertal genes carried by this person suggests that he did not contribute much to modern Europeans. Implications? There must have more than one original modern-Neandertal hybrid.
* He? Indeed. The specimen yielded DNA sequences from both the X and Y chromosomes.
This is difficult work. (It would have been impossible even five years ago. Methods development in the field of ancient DNA is amazing.) Error bars for some of the analyses are large; the authors note this, and often give wide 95% confidence intervals for their results. Whether the analysis reported here will hold up remains to be seen. But what we can safely predict is that more data will come. More samples will be found, more will be analyzed.
The key point of this article is that it provides further evidence that Neandertals and moderns interbred. Not so many years ago that was a matter of active debate, with perhaps most scientists doubting that it happened -- and very little good evidence on either side. Genome analysis has revealed the Neandertal genome, and the Neandertal contribution to the modern human genome. The person analyzed here has the characteristics we would expect of someone not far removed from such an inter-breeding event.
It's an exciting time for understanding the human line.
News stories:
* Neanderthal-Human Hybrid Unearthed -- DNA from the 40,000-year-old bones of a modern human found in Europe contains Neanderthal genes. (B Grant, The Scientist, June 22, 2015.) Features a picture of the jaw of the person analyzed here. Both the title and the subtitle of this page are poor.
* An early European had a close Neandertal ancestor. (Max Planck Institute, June 22, 2015.) From one of the lead institutions.
The article: An early modern human from Romania with a recent Neanderthal ancestor. (Q Fu et al, Nature 524:216, August 13, 2015.)
Recent posts that address differences in the genomes of modern humans and Neandertals:
* A gene that reduces the chance of successful pregnancy: is it advantageous? (May 18, 2015).
* Genes that make us human: genes that affect what we eat (February 18, 2015).
Ancient DNA: an overview (August 22, 2015). Perspective.
There is more about genomes on my Biotechnology in the News (BITN) page DNA and the genome. It includes an extensive list of Musings posts on sequencing and genomes.
A book, which is listed on my page of Books: Suggestions for general science reading... Pääbo, Neanderthal Man -- In search of lost genomes (2014). Author Pääbo is one of the senior authors of the current article.
Can blind rats learn to use a geomagnetic compass?
June 29, 2015
We use our senses to inform us about the environment. Using a sense involves detecting the signal, then integrating it, using our brain, so that we make use of the information. For example, our eyes detect light; they send a signal to the brain, which decides what to do with the information.
An earlier post showed that rats can make use of a novel sensory system [link at the end]. A new article presents another example.
In the new work, the rats were equipped with a geomagnetic compass, located on the head and connected to the brain. The rats learned to use the compass as information about absolute direction.
The following figure shows some examples of the results. In these experiments, blind rats were to find a food pellet in one arm of a simple T maze. The y-axis shows the percentage of successful trials vs day of testing.
|
In Part B (upper)...
The blue curve shows the results for blind rats. They showed about 50% success over the entire time period. That is what is expected if they are making random choices about which direction to go.
The red curve shows the results for the blind rats that got to use the compass. The compass sensor was ON (sending a signal) at certain time periods, as shown by the bars at the top. You can see that when the sensor was turned on, the rats quickly learned which direction to go. When the sensor was turned OFF, they lost their sense of direction. When it was turned back ON, they quickly regained their sense of direction.
|
Part C (lower) shows another experiment. The rats again learned to find the food by using the compass sensor. In this case, the position of the food was switched to the other arm of the maze after day 6. At that point, the high success rate turned to a high failure rate. Remember, the compass provided information about absolute direction. The rats had learned to "go east"; now, "east" was not useful, but the rats still did it. They quickly learned, and a high success rate was soon re-established.
This is part of Figure 2 from the article.
|
It works. Rats can use a compass. Blind rats now have a sense of direction.
Now, we need to emphasize that this does not mean that the rats understand what a compass does. The rats are responding to a signal received in the brain, and associating it with food success (or failure). But isn't that the heart of how sensory signals work? Do rats understand how odor receptors work even as they use them to find their food? Did ancient man?
Would this work for humans? Why not? Would it be good for blind people to have a compass wired into their brains? Perhaps, though there may be good alternatives for solving the particular problem. Would this be useful for sighted people? But those questions are too narrow. The present work is another example showing how much potential the mammalian brain has. It is another example of how we can develop new inputs to the brain, correcting existing defects, or adding new capabilities.
News story: Geomagnetic compass hooked to the brain allows blind rats to 'see'. (Kurzweil, April 3, 2015.)
The article: Visual Cortical Prosthesis with a Geomagnetic Compass Restores Spatial Navigation in Blind Rats. (H Norimoto & Y Ikegaya, Current Biology 25:1091, April 20, 2015.)
Background post, on adding a sensory skill: Can rats touch infrared light? (February 25, 2013). The article discussed here is reference 10 of the current article.
Is this related? Can one rat know what another rat is thinking? (April 8, 2013). Note that there is a linked post about similar work with humans.
The use of magnetic field information by animals is not, per se, novel. What's new here is how a non-natural sensor has been integrated into the rat brain. A post on magnetic field detection by animals: Magnetic field perception (June 16, 2010).
More...
* The nature of a bio-compass? (June 10, 2016).
* Magnetic turtles (July 5, 2015).
More about brains is on my page Biotechnology in the News (BITN) -- Other topics under Brain (autism, schizophrenia).
Who's been genetically engineering the sweet potatoes?
June 28, 2015
A recent article presents an interesting discovery about sweet potatoes. The authors note a "political" implication. Let's stick with the science for now, and note the politics at the end.
The sweet potato is an important food crop. There are many strains of the cultivated plant, and related "wild" plants are known (although the history of domestication is not clear).
During the course of their work, the scientists noted that their sweet potato line had some bacterial DNA in the genome. The DNA was from bacteria of the genus Agrobacterium. That is a well-known group; we will come back to its significance in a moment. This finding led them to look further; they surveyed a large collection of both wild and domesticated sweet potato strains for Agrobacterium DNA.
The survey showed that sweet potatoes, as a group, contained two regions of Agrobacterium DNA. One region was present in all domesticated strains studied, but was in none of the wild strains. That's intriguing. Is it possible that the addition of Agrobacterium DNA was part of the pathway for domesticating sweet potatoes? They don't know at this point. There are several Agrobacterium genes, and they seem to be intact. They seem to be expressed, at least at the RNA level. Attempts to find any correlation between the presence of the bacterial genes and function have not yielded anything conclusive yet (though they note one clue they think should be followed up).
The second region of Agrobacterium DNA they found was in some strains, both wild and cultivated. Beyond that, there is nothing useful to say at this point.
That's the basic story. The heart of the story is that bacterial DNA -- Agrobacterium DNA -- is in the genomes of some sweet potato strains. These are examples of horizontal gene transfer (HGT) -- the transfer of DNA to an organism from a donor other than a parent. (Transfer from a parent is considered "vertical", reflecting the way we commonly draw a genealogy chart.) HGT is widespread among microbes. It has long been considered rare -- and difficult -- in higher organisms. Maybe so, but more and more examples are being found -- as the flood of genome sequences provides us more information. The current work provides evidence for horizontal transfer of genes from Agrobacterium to sweet potato.
It would be a nice little story in any case. Each example of HGT in higher organisms gets attention, and this example certainly opens up interesting questions about the role of these genes. That one of the bacterial DNA regions found in sweet potatoes is found only in cultivated strains makes one wonder whether it is doing something useful.
But this isn't just any HGT; it's HGT from Agrobacterium. Agrobacterium is the bacterial agent that is often used to transfer genes into plants by the process oddly called genetic modification. Agrobacterium is used because it has a natural ability to transfer its DNA into plant cells. Scientists have learned to use the Agrobacterium DNA transfer system to transfer the genes they want transferred; that is the basis of using Agrobacterium to make "GMO"s.
Such transfer occurs in nature. Occasional examples of Agrobacterium DNA stably incorporated into plant genomes have been found; the current work adds sweet potato to the list. What's new is finding Agrobacterium DNA in the genome of a food plant, perhaps even associated with domestication of the plant. The authors note, then, that their finding is an example of a natural modification of a food plant by Agrobacterium. They even suggest this might affect public perception of GMOs. Really? If we want that GMOs are judged on merit, this doesn't seem a helpful point.
That sweet potatoes contain Agrobacterium DNA is interesting. Most interesting will be to understand the role of the bacterial genes in the plant.
News stories:
* Researchers find the genome of the cultivated sweet potato has bacterial DNA. (B Yirka, Phys.org, April 21, 2015.)
* Sweet Potato Is a Natural GMO. (GEN, April 22, 2015.)
The article, which is freely available: The genome of cultivated sweet potato contains Agrobacterium T-DNAs with expressed genes: An example of a naturally transgenic food crop. (T Kyndt et al, PNAS 112:5844, May 5, 2015.)
More HGT in eukaryotes:
* A case of horizontal gene transfer from plant to insect; exploiting it for insect control (April 18, 2021).
* Cheese-making and horizontal gene transfer in domesticated fungi (January 19, 2016).
* More on photosynthetic sea slugs (February 20, 2015).
A post on a GMO food: Golden rice as a source of vitamin A: a clinical trial and a controversy (November 2, 2012).
More about agricultural biotechnology is on my Biotechnology in the News (BITN) page Agricultural biotechnology (GM foods) and Gene therapy. It includes a list of related Musings posts.
There is more about genomes on my BITN page DNA and the genome. It includes an extensive list of Musings posts on sequencing and genomes.
Human gracility
June 26, 2015
A pair of recent articles make some interesting measurements on humans -- and draw an interesting conclusion.
The scientists measure certain bones. They interpret the results as reflecting strength. And the conclusion is that humans are getting soft, perhaps due to our lifestyle.
Humans have become couch potatoes, due to television? No, they are looking at a longer time scale. They measure human bones that span millions of years.
Here is an example of the results...
|
The graph shows the trabecular bone fraction (TBF) for various bones from various primates. The TBF, shown on the y-axis, is a measure of bone density. The primates are listed across the x-axis. The first is the chimpanzee; the others are various hominins, in order by age.
Results are shown for three leg bones, color coded as shown in the key (lower right).
|
Look at the results for the femur (thigh bone), in red (the left bar of each set). The striking result is that the TBF (or density) for this bone is lower for "recent moderns" (the right-hand set) than for any of the other primates shown here. The asterisk on the femur bar for recent moderns shows that the difference is statistically significant.
The results for the tibia (long bone of the lower leg) and metatarsal (a foot bone) are similar.
Trabecular bone is bone with open space in it; the marrow is in that open space. The TBF shown above is the fraction of the bone that is mineralized, as judged by examination of a cross section.
This is Figure 3B from the first article. (Figure 3A shows a similar analysis for arm bones. The trend is the same, though the effect may be smaller for the arms.)
|
That's the main direct conclusion: modern human leg bones are less dense than in our ancestors, including the "early modern" humans. That latter category seems to include humans older than about 10,000 years. The "recent" humans are from museum collections, and are hundreds or a few thousands of years old.
What is the significance? One possibility was that bone density changed simply as the human body plan was developed. That doesn't seem supported by the results here, which show a major change in density rather recently. The lower bone density may have resulted from humans changing lifestyle in a way that reduced the mechanical loading on the bones. What was this lifestyle change? The timing might be consistent with the beginning of agriculture. Interesting speculation. (Emphasize that the results shown above are not sufficient to lead to that point. However, there is more, especially in article 2.)
In thinking about this work, it's important to keep the steps separate. The scientists suggest that humans are getting weaker. They start with measurements, and then there are stages of interpretation. There is much to wonder about, starting with the question of how representative the results are, and going on to the timing of the change. All that will probably be the subject of further discussion -- and presumably more data.
I used the term gracility in the title, but haven't used it since. What is gracility? We are more gracile than our ancestors studied here: we have less bone mass per body weight. In non-technical English, gracile means slender or graceful. There is an implication here that humans have become more graceful because we became weaker.
The articles speculate on the relevance of the findings to the likelihood of bone fracture and osteoporosis.
News story: Lightweight skeletons of modern humans have recent origin. (Phys.org, December 22, 2014.)
The articles, which are published together:
* 1) Recent origin of low trabecular bone density in modern humans. (H Chirchir et al, PNAS 112:366, January 13, 2015.)
* 2) Gracility of the modern Homo sapiens skeleton is the result of decreased biomechanical loading. (T M Ryan & C N Shaw, PNAS 112:372, January 13, 2015.) A similar analysis, with more emphasis on the timing of the change in human bone density, and what its implications are. In particular, they find a difference in bone density between forager and agriculturist humans.
More about bone density: A new, simple way to measure bone loss? (September 14, 2012).
Also see: Do animal bones have something like annual growth rings? (August 7, 2012).
June 24, 2015
Robots that can quickly adapt to disabilities
June 23, 2015
Humans design a nimble robot with six legs (a hexapod robot). In action, a leg gets damaged. Now what? Or consider a type of robot that is already in use: an industrial robotic arm that carries out a series of repetitive motions. What if a joint goes bad?
A new article is about a robot that can adapt to such disabilities. It will try other ways to walk, or to achieve the goal of the robotic arm; it finds one that works, and then proceeds with its job. In one case, the hexapod actually figured out a way to walk that worked better than its original one with its full set of legs.
These robots do not just have a collection of rules for solving particular predicted disabilities. They have a strategy for trying and evaluating new approaches to accomplishing their task. It is based on the robot having a general knowledge about its capabilities and a clear purpose. The authors call it Intelligent Trial and Error (IT&E); they think it is (part of) how animals adapt to disability. Importantly, it is quite fast, with adaptation occurring in less than two minutes.
The story is well told by a short video that the authors have prepared. I don't need to add much; go look at it.
Video. (YouTube, 5 minutes, narrated.) An excellent overview of the article, from the authors.
News story: Emulating animals, these robots can recover from damage in two minutes. (Kurzweil, June 1, 2015.) Includes the video noted above.
* News story accompanying the article: Artificial intelligence: Robots with instincts. (C Adami, Nature 521:426, May 28, 2015.) A provocative discussion. But perhaps it is best to take the narrow and practical view here: the article is about building a robot that can adapt -- because we have given it some ability to adapt. Going off on a discussion of robot intelligence is perhaps excessive, even if fun.
* The article: Robots that can adapt like animals. (A Cully et al, Nature 521:503, May 28, 2015.)
* Previous post about robots A robot that can fold itself up (December 9, 2014).
* Next: Creepazoids and the Uncanny Valley (May 15, 2016).
More AI: Is AI ready to predict imminent kidney failure? (August 24, 2019).
A post that includes a discussion of adaptation: Bet hedging (December 5, 2009).
Learning to use a mirror
June 22, 2015
If you see yourself in a mirror, do you recognize that it is you? If you saw a mark on the forehead of your image in the mirror, would you check your own forehead? That's a standard type of test used to determine if an animal is self-aware. Human children usually pass the test starting at 18-24 months of age. A few other animals can pass the test. People vary in how they interpret the significance. There are, perhaps, various reasons why an animal might fail the test.
A recent article makes a useful contribution to the mirror test for self-awareness. Rhesus monkeys usually do not pass the mirror test. However, the new article shows that they can be taught to do so.
The general strategy in the new work is to get the monkeys to associate their mirror image with something significant about themselves. Thus the scientists train the monkeys with marks that are irritating and they couple success with a food reward. Once the monkeys learn to pay attention to the mirror image, they do check themselves when the image shows something unusual.
Here is an example of the results with seven (male) monkeys that had been trained to pay attention to what they saw in the mirror.
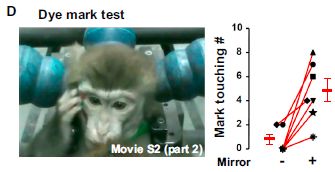
|
A dye mark was applied to the monkey.
You can see the mark at the left of the monkey's eyes. The monkey is touching the mark. As we will see in a moment, he does that only if a mirror is available.
|
The graph to the right summarizes the results from many tests. In this case, the test was with a red dye, as indicated by the line color. Each line is for one monkey. Each line has two points, without and with the mirror (- and + on the x-axis, labeled mirror). The y-axis is the number of times the monkey touched the mark during the allotted time.
You can see that the number of proper touches increased for each monkey when the mirror was present.
The red bars to the left and right of the main set of data lines show the means for the set of monkeys, with error bars. You can see that the mean increased substantially when the mirror was present.
This is part of Figure 1D from the article. Additional parts of the figure show the results using other dye colors. The qualitative conclusion is the same.
|
There are variations of the test; the general result is the same. The monkeys that have been trained to pay attention to the mirror now pass the mirror test for self-awareness. (The monkeys differ in how well they did, as you can see above. Two of the monkeys consistently did relatively poorly, and completely failed certain tests.)
Untrained monkeys do not pass. Based on the new work, the interpretation is that the monkeys do not pay attention to the mirror image, rather than that they don't see themselves in the mirror. Is that the right interpretation? We'll see how things proceed from here. In any case, it does seem that these monkeys can at least be taught to pay attention to their image in the mirror, whatever the explanation may be.
Trained monkeys given free access to the mirror used it to examine themselves. This behavior has been found in some other animals that pass the mirror test.
News story: Monkeys can learn to see themselves in the mirror. (Science Daily, January 8, 2015.)
* News story accompanying the article: Animal Cognition: Monkeys Pass the Mirror Test. (K Toda & M L Platt, Current Biology 25:R64, January 19, 2015.)
* The article: Mirror-Induced Self-Directed Behaviors in Rhesus Monkeys after Visual-Somatosensory Training. (L Chang et al, Current Biology 25:212, January 19, 2015.)
Videos. There are six short movie files posted with the article at the journal web site. I think you need journal access to get to the movies. Each is less than one minute long. There is no narration, but they are well-labeled (and also referred to in the text). There is no sound, except for some background noise, including an occasional monkey vocalization. Movie S3 is a good place to see a monkey with a mirror.
An earlier post on the mirror test: Self (October 8, 2008) discusses work showing that a magpie can recognize itself in the mirror. The article there discusses other mirror work. As you read about mirror work, be sure to distinguish two phenomena. One is animals that can use a mirror to find things. The other is the specific recognition of self in the mirror; it is this phenomenon that is the subject here.
Previous monkey post... Use of instructional videos -- in the wild (November 3, 2014).
Birth of the Moon: Is it possible that Theia was similar to Earth?
June 20, 2015
Where did the Moon come from? We don't know, but the preferred hypothesis at this point is that it was formed in a collision between Earth and another body, perhaps the size of a small planet and known as Theia.
Modeling suggests that the Moon resulting from such a collision would be largely formed of material from Theia. And that leads to another prediction, which should be testable... Large bodies in the Solar System have different compositions, presumably because they formed at different distances from the Sun. We would then expect that Theia and Earth have different compositions, and that the Moon is more like Theia than like Earth. In other words, the prediction is that the Moon should be chemically distinct from Earth.
That's the prediction, and it has been tested. And it seems to be wrong. We have considerable data about the composition of the Moon -- and it is not particularly different from that of Earth. A previous post presented an example of such data, along with an introduction to the story of Theia [link at the end].
So we have a contradiction. The current hypothesis for the formation of the Moon predicts that it should be chemically distinct from Earth. It isn't.
How do we resolve this contradiction? There are various possibilities, such as...
1) The hypothesis is fundamentally wrong. Perhaps the Moon did not form in a collision.
2) Some aspect of the collision hypothesis is wrong. For example, perhaps the composition of Theia and Earth were not very different.
3) The data at hand are misleading, and have not revealed the important differences that are present.
As the first data came in showing little difference between Moon and Earth, it was easy to take refuge in possibility #3. After all, both bodies are complex, and maybe we just haven't measured the right stuff yet. As more and more data came in, all with the same basic result, this possibility has become less likely. However, it cannot be excluded.
A pair of new articles addresses possibility #2. Is it possible that the collision of Earth and Theia was between two bodies that were actually very similar?
Let's step back and ask where the original prediction came from. Solar system bodies are different. Therefore it seems likely that Theia and Earth were different. It's a rather general prediction. The new articles go beyond that, and attempt to make a quantitative prediction: what is the probability that Theia might have formed under about the same conditions as Earth, and therefore was actually quite similar?
The two articles don't particularly agree on the answer, but that is perhaps because they analyzed the possibility in different ways. Their conclusions range from "not likely" to "maybe". The news story listed below discusses what they did and what they concluded. I encourage you to read that news story if you want more.
Some numbers? One article (#2 below) concludes that the probability of an Earth-Theia collision leading to a body with the composition of the Moon is less than 5%. The final sentence of their abstract is "Our work suggests that there is still no scenario for the Moon's origin that explains its isotopic composition with a high probability event." The other article suggests a probability of 10-20%, or even higher, perhaps as high as 50%.
We need to emphasize that the new articles do not tell us what happened. They do not provide any new evidence about the Moon. What they do is to explore a solution that was previously considered unlikely. Previous versions of the Theia hypothesis suggested that the Moon should have a composition distinct from that of Earth; the new work says that is not necessary. We still don't know how the Moon formed; perhaps we never will. However, modeling, constrained by whatever data is at hand, may help us see the range of possibilities.
News story: Was Our Moon's Formation Likely or Lucky? (M Zevin, Astrobites, April 8, 2015.) A nice discussion of the pair of articles. The articles themselves are rather difficult, but read this and you have the idea.
Article 1:
* News story accompanying the article: Solar system: An incredible likeness of being. (R M Canup, Nature 520:169, April 9, 2015.)
* The article: A primordial origin for the compositional similarity between the Earth and the Moon. (A Mastrobuono-Battisti et al, Nature 520:212, April 9, 2015.) Check Google Scholar for a freely available preprint; there is one at ArXiv.
Article 2:
The article: The feeding zones of terrestrial planets and insights into Moon formation. (N A Kaib & N B Cowan, Icarus 252:161, May 15, 2015.) Check Google Scholar for a freely available preprint; there is one at ArXiv.
Background post about the formation of the Moon: The Moon: might it be a child with only one parent? (April 13, 2012).
More...
* Formation of the moon: was the Earth surface molten? (June 16, 2019). Another model.
* The collision of Theia with Earth: head-on? (February 29, 2016). Presents a model different from the one of the current post.
* Formation of the Moon: the California connection (October 10, 2014).
More about the early Solar System: Another Solar System planet -- revealed by its diamonds? (May 22, 2018).
Fracking: the earthquake connection
June 19, 2015
Is there a connection between fracking and earthquakes? In some cases, the evidence strongly suggests clear that there is, but in other cases there is no connection. Can we make sense of all this?
Fracking, or hydraulic fracturing, is a method for breaking up rock formations that contain fossil fuels by injecting high pressure fluids into them.
Scientists have been trying to analyze the effects of fracking; perhaps a consensus is emerging on some points.
* First, it is most likely not fracking, but rather the waste water disposal associated with fracking that is the major culprit. That's an important distinction; the route to solving the problem depends on understanding what the problem really is. (As we will see, it's more complicated than this, but this is a useful point.)
* Second, the effect depends on the location -- on the ground structure. In certain areas of Oklahoma and Texas there has been a dramatic increase in earthquakes correlated with fracking. (In fact, Oklahoma has replaced California as the earthquake capital of the US.) On the other hand, fracking activities in California and North Dakota seem without effect.
We note here one new article that is part of this story. It is an analysis of the activities around Azle, Texas (just south of the Oklahoma border). This is an area of active fracking -- and a lot of earthquakes since the fracking was started. The general approach is that the scientists try to model the area, and consider what the forces are that may affect ground movement.
The following figure is a diagram of the area. As you look at the figure directly, you are looking at a cross-section, from the surface down a few thousand meters to the "basement".
First, try to get a general sense of the stratification: what happens at various levels. From the top...
* a lake and trees (and oil wells) on the surface,
* an aquifer of fresh water,
* a lot of ground,
* a layer of oil and gas (to be mined),
* a salt water aquifer (where waste water is injected),
* and the basement.
Key parts of this are that the basement layer is the main source of ground movement, and that the salt water aquifer is closest to it.
This is Figure 1 from the article.
|
That simple view might suggest that the salt water aquifer, the layer where waste water is injected, is most likely to directly affect the ground structure responsible for earthquakes. That is where large amounts of water accumulate. Further, water gets drawn from that layer, as a byproduct of the production wells. That is, the overall activity involves relatively large and rapid changes in water pressure, both increases and decreases. in that layer. That's over-simplified, of course.
The article uses the model for quantitative analysis of the forces and how they change; the general picture fits that simple overview. It is the water movements in and out of the salt water aquifer that are most likely to cause earthquakes. Waste water injection is a major part of this. These movements can create small but significant pressure changes, enough to trigger already stressed fault regions nearby. The pressure changes due to these movements are clearly larger than those due to changes in the surface lake or fresh water aquifer.
This analysis leads to suggestions about how to reduce earthquake risk from fracking. Clearly, it would be best to not inject waste water very near basement that contains potentially active faults. It also follows that people (including regulatory authorities) should be alert to increases in earthquake activity associated with fracking; the increases may well be a warning sign -- one that is easy to heed.
What's most important here is the type of analysis. It is probably one of the best analyses yet done on such a system. It leads to interesting conclusions, but it also has limitations. The authors emphasize the need for more data to allow better modeling. As noted below, industry has raised some concerns about the model. If that leads to good open discussion about the modeling, that's good over the long term. Analysis such as this leads to better understanding of the risks, and allows proper action to minimize harm.
News stories:
* SMU-led seismology team reveals Azle findings: Combination of gas field fluid injection and removal is most likely cause of 2013-14 earthquakes. (Southern Methodist University (SMU), April 21, 2015.) From the lead institution, which is in Dallas, near the study area. Excellent overview of the work, with good information about context. The page links to various items of news coverage.
* Five Questions about SMU's New Azle Earthquake Study. (S Everley, Energy In Depth, April 21, 2015. Now archived.) This page is from an industry group. Not surprisingly, it expresses an industry-biased position, and raises some questions about the study. What I found striking about the page was how much industry agrees with. Clearly, industry is concerned about an over-reaction: using the fear of induced earthquakes to impose major restrictions on fracking. Of course, they will tend to under-estimate the risk and resist even minor restrictions. Open discussion, with many views represented and based on good science, is the way forward. Regulatory agencies should look at all the evidence. In fact, regulatory agencies in both Oklahoma and Texas have signaled their interest in the kind of analysis reported here.
The article, which is freely available: Causal factors for seismicity near Azle, Texas. (M J Hornbach et al, Nature Communications 6:6728, April 21, 2015.)
Posts about fracking include:
* Fracking and earthquakes: It's injection near the basement that matters (April 22, 2018).
* Hydraulic fracturing (fracking) and earthquakes: a direct connection (February 13, 2017).
* Fracking: one scientist's perspective (January 5, 2016).
* Quality of oil and gas wells -- fracking and conventional (August 18, 2014).
* Shale gas recovery using hydraulic fracturing (fracking) (October 7, 2013). Useful overview of fracking.
More about earthquakes...
* Does the moon affect earthquakes? (October 21, 2016).
* How PBRs survive major earthquakes; why being near two faults may be safer than being near just one (September 22, 2015).
* Earthquake: Are the geologists responsible for the damage? (November 17, 2014).
* Could we block seismic waves from earthquakes? (June 23, 2014). Links to more.
June 17, 2015
Humans resistant to arsenic?
June 16, 2015
Say we have a population of bacteria that are sensitive to a toxic chemical. If we expose the bacteria to the toxic chemical, mutants that are resistant to the chemical will have an advantage. Even if the effect is small, over time we may end up with mutants that are more resistant to the toxic chemical. This is how antibiotic-resistant mutants become prevalent.
That is for bacteria. Would it work for humans? In principle, it should. But it is hard to do the experiments with humans. For one thing, the lifespan of the experimental organism is similar to that of those doing the experiment. Further, such experiments would generally be considered unethical.
Sometimes, Nature helps us -- even doing "unethical" things to us. It turns out that a population living in the Andes has been exposed to high levels of arsenic in their water for many thousands of years. That's due to the geology of the area. A new article shows that this population contains a high level of a gene that reduces the harm from arsenic. That is, it appears that Nature has indeed selected for human arsenic resistance in a high-arsenic environment.
The story has been developing for some years. It first involved understanding that there was an enzyme in humans that promoted arsenic-resistance. It does that by converting the arsenic to a form that is more rapidly excreted. The gene for this enzyme has been identified; there are many variants of the gene. One allele in particular leads to better processing and excretion of the arsenic; this allele can be considered an arsenic-resistance gene. More recently, people have been testing human populations for the frequency of this arsenic-resistance gene.
Back to the Andes... There is one village where the level of arsenic in the water is 20 times the maximum allowed level; it has probably been that way for thousands of years. The new article shows that the people of that village have a high frequency of the arsenic-resistance gene. These people are otherwise quite similar genetically to people in neighboring areas. That is, their high level of the arsenic-resistance gene stands out; it is evidence that there has been selection for this particular gene. It's thought to be the first example documented in humans of selection for resistance to a toxic agent.
News stories:
* First-ever human population adaptation to toxic chemical, arsenic. (Science Daily, March 4, 2015.)
* Human gene identified for tolerance to an environmental hazard. (Karolinska Institutet, April 3, 2015.) This news story was added to replace one that is no longer available.
The article, which is freely available: Human Adaptation to Arsenic-Rich Environments. (C M Schlebusch et al, Molecular Biology and Evolution 32:1544, June 2015.)
Caution... This article shows that humans can adapt to a toxic agent. This in no way is intended to justify a line of argument that says we can put out toxic things and we will adapt. In general, adaptation, whether physiological or genetic, is slow and imperfect. We usually do not know how populations will respond. The current story is interesting because it is a story of what seems to have happened in one case. It gets attention partly because it is unusual.
Among many posts about arsenic...
* A practical system for removing arsenic from water (March 21, 2014).
* Rice and arsenic: rice syrup, baby food, and energy bars (April 23, 2012).
* NASA: Life with arsenic (December 7, 2010). The claim made in this work has been rejected. Be sure to see the follow-up posts.
There is more about genomes on my page Biotechnology in the News (BITN) - DNA and the genome. It includes an extensive list of Musings posts in the broad area of genomes and sequencing.
More on antibiotics is on my page Biotechnology in the News (BITN) -- Other topics under Antibiotics. It includes a list of related Musings posts.
The advantage of menopause: grandma knows where dinner is
June 15, 2015
Menopause -- the loss of reproductive ability in older females -- is a somewhat mysterious phenomenon to biologists. It's not common; it is found in only a few animals besides humans. The key question that concerns biologists is: what is its advantage to the species? Biologists suspect that the older females, while no longer reproducing themselves, help promote the survival of the younger animals, through some form of care-giving. This is sometimes called the "grandmother effect", but it is largely a hypothesis.
In an earlier post, Musings noted a study of killer whales (orcas), one of those few species that has a menopause. A long term study of an orca population suggested that the presence of older (menopausal) females promoted survival, especially for males. [link at the end]. There was an effect, but there was no evidence reported there for any explanation.
A recent article, with further observations of that same killer whale population, offers more. It looks at which whales provide leadership during foraging. The following graphs summarize the key findings...
|
The figure shows who provides leadership in the whale excursions.
The x-axis shows a measure of leadership, the y-axis shows how often it occurs. (It is hard to explain exactly what either scale is showing, but the idea is simple enough. The basic observation is that the whale in front of a group that is swimming together is called the leader. The rest is data presentation, which is complex.)
In frame C (upper), there are results for male and female whales. You can see that the curve for females (pink) is shifted towards the right. That is, the females have higher leadership scores; the females show leadership more often than males.
|
In frame D (lower), the results for females are subdivided into two groups: those of reproductive age and those that are postreproductive (menopausal). You can see that the curve for postreproductive females (darker) is shifted towards the right. This means that postreproductive females show leadership more often than those of reproductive age.
This is Figure 1 parts C and D from the article.
|
In both cases above, the effect is quantitative, not absolute. This is not a highly differentiated society, with a distinct role for the menopausal females. The observation is that the menopausal females are more likely to be leaders.
Further analysis suggested that the leadership role of the menopausal females was greatest in times of food shortage. That is, it may be that the role of these elder females is most important in times of hardship. It may be that they hold the cultural knowledge about where the food is. But careful, we are going beyond the data. (The graph showing this effect, Figure 2, is not very convincing. The conclusion by the authors is based on a more thorough statistical analysis.)
That's it. The results suggest that menopausal females play an enhanced role as leaders -- in killer whale populations.
News stories:
* Menopausal killer whales are family leaders. (N Weiler, Science, March 5, 2015.)
* Old mothers know best: Killer whale study sheds light on the evolution of menopause. (Science Daily, March 5, 2015.)
The article, which is freely available: Ecological Knowledge, Leadership, and the Evolution of Menopause in Killer Whales. (L J N Brent et al, Current Biology 25:746, March 16, 2015.) A very readable article.
Background post about whale menopause: Killer whales: menopause (October 1, 2012).
Previous post about whales: If it quacks like a whale... (August 25, 2014).
Other dinner stories include...
* Polystyrene foam for dinner? (October 19, 2015).
The aroma of rain
June 13, 2015
A light rain falls. It smells good! Why? Because the impact of the raindrops on the soil aerosolizes the soil surface, releasing soil chemicals into the air.
That may sound reasonable. What's new is that scientists at MIT have captured the process with high-speed video. A recent article reports their findings.
Here is one small set of frames from their videos, just as a teaser.
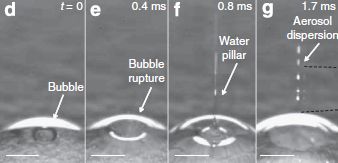
|
A water drop hits the ground and bursts, resulting in a pillar of water rising into the air above. The water carries with it volatiles from the soil. It all happens in less than 2 milliseconds.
This is Figure 1 parts d-g from the article.
|
Of course, there is more to it. What happens depends on the speed of the falling rain drops and on the nature of the soil surface. The aroma will depend on what is in the soil. But the key point here is that the scientists have opened this up for study. They address some of the variables, but start by simply getting a sense of their experimental system.
The experimental conditions are described by two parameters, We and Pe. These are defined, but not clearly described in the article. In part, We represents the energy of the water droplet and Pe represents the porosity of the surface it hits. The scientists vary both parameters over wide ranges; it seems that aerosol generation is best if the two values are of similar magnitude.
Movies. There are several short videos with the article. However, there is a single longer video at YouTube; it shows the results for many trials, with various conditions. Start by exploring it. In each sequence, you are watching a water drop hit a tiny bit of soil. You will see columns of water rise from the surface. If you get a little bored with it, skip ahead to about 4 1/2 minutes. At that point, a wind is added, labeled "air blowing". Look at what it does to the droplets. Movie. (YouTube, 5 minutes -- representing perhaps 2 seconds total of action. No sound.)
News stories:
* Why Does Rainfall Leave Behind a Scent? (J Maynard, Tech Times, January 16, 2015.)
* Sure can smell the rain. (G-Soil, Soil System Sciences Division of the European Geosciences Union, February 24, 2015.) The English is a bit rough here, but the page starts with a quotation from a Verdi opera.
* Rainfall can release aerosols, study finds. (J Chu, MIT News, January 14, 2015.) From the lead institution.
The article: Aerosol generation by raindrop impact on soil. (Y S Joung & C R Buie, Nature Communications 6:6083, January 14, 2015.)
More raindrops...
* Fossil raindrops and the density of the ancient atmosphere (May 6, 2012). (And post immediately following it.) 2.7 billion years old.
* How big are rain drops? And why? (July 23, 2009).
And also... Weather report from Titan: Clouds? Puddles? Does that mean it rained? (April 6, 2011). I wonder what it smells like. And whether anyone is there smelling it.
More droplets:
* How water droplets damage hard surfaces (June 18, 2022).
* What determines the size of liquid droplets from a sprayer? (September 21, 2018).
More about things bursting: How balloons burst (December 20, 2015).
The mystery of the first dinosaur found in the state of Washington
June 12, 2015
At the right is the bone that is of interest here.
The smaller of the bones shown here -- the one the people are examining -- is the actual fossil that was found.
This is one of the figures from the news story listed below.
Their figure legend: "Burke Museum Curator of Vertebrate Paleontology Dr. Christian Sidor, and Brandon Peecook, University of Washington graduate student, compare Washington's first dinosaur fossil to the cast of a femur (thigh bone) of another theropod dinosaur."
|
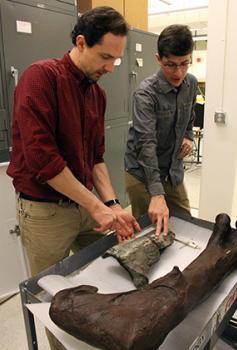
|
That's it. It is the first dinosaur fossil from the state of Washington. It's identified as a leg bone from a theropod, the kind of dinosaur typified by Tyrannosaurus rex. The people in the figure above are the authors of a new article describing the find.
So what's the mystery? The western United States has been the source for many dinosaur bones. Why is this one so special -- other than the local excitement of Washington state getting its first? Is there some reason why that state had not previously provided dinosaur fossils? In fact, there shouldn't be dinosaur fossils in Washington. The land area we now call Washington state was pretty much under water during the age of the land animals we know as dinosaurs.
The bone was found in the San Juan Islands, off the coast of the mainland. It had clam shells in the hollow part. The authors suspect that this bone was washed up to Washington over the ages, probably from much further south. But they don't know. For now, the state of Washington proudly displays its first dinosaur fossil in its state museum -- and wonders why it is there. Another reminder that the fossil record is not simple.
News story: Burke Museum Paleontologists Discover the First Dinosaur Fossil in Washington State. (Burke Museum of Natural History and Culture, University of Washington, May 19, 2015. Now archived.)
The article, which is freely available: The First Dinosaur from Washington State and a Review of Pacific Coast Dinosaurs from North America. (B R Peecook & C A Sidor, PLoS ONE 10:e0127792, May 20, 2015.)
We use the term dinosaur here in the traditional sense. With the general recognition that modern birds are part of the dinosaur lineage, birds are properly called dinosaurs. The term non-avian dinosaurs would be appropriate here.
A recent post with another caution about the fossil record: What did Osedax worms eat before there were whales? (May 30, 2015).
More that doesn't belong in Washington state: Could a common food plant be used to make rubber? (March 27, 2015).
Previous post about dinosaurs: What caused the dinosaur extinction? Did volcanoes in India play a role? (April 13, 2015).
Of birds and dinosaurs... How the birds survived the extinction of the dinosaurs (June 6, 2014).
T rex census (May 25, 2021).
June 10, 2015
Photosynthetic sea slugs; species vary
June 9, 2015
Briefly noted...
Musings has noted the story of the photosynthetic sea slugs in multiple posts [links at the end]. Briefly, these marine animals acquire chloroplasts, from algae in their food, and maintain them in their own cells. Of particular interest is the question of how much these chloroplasts actually contribute to the economy of the animals. Articles vary in what they report, and it is not clear why. At one extreme, it is claimed that the animals can survive fairly long periods of starvation by relying on their chloroplasts.
A recent article does something helpful. The scientists compare two species of the sea slug -- and get quite different results for them. Both acquire chloroplasts, but one species survives much better upon starvation. They suggest that the species that does not survive is more sensitive to the reactive oxygen species (ROS) that accumulate during starvation. (Hydrogen peroxide is one example of an ROS.) Turning that around, they argue that the key reason one species survives better is that it is more starvation-tolerant (ROS-tolerant). Whether the animals benefit from the chloroplasts is perhaps open, but it is not the main reason for survival.
It is premature to use this article to explain the varying results reported earlier. However, what it does do is to suggest that the system may be capable of varying results, depending on details. In this case, related species give different results. It is also possible that different strains or different conditions would give different results. Perhaps this work will lead to more work being done comparing details.
I don't see a news story for this article. However, the article itself is freely available. The main ideas are summarized in the abstract. I want to note this article, even if briefly, because of how it relates to previous posts about a controversy.
The article, which is freely available: Comparison of sister species identifies factors underpinning plastid compatibility in green sea slugs. (J de Vries et al, Proceedings of the Royal Society B 282:20142519, March 7, 2015.)
Previous posts on the topic (oldest first)...
* COOL AS HELL! Sea slug that runs on solar power (Really) (November 30, 2008).
* A challenge to the story of photosynthetic sea slugs (January 7, 2014).
* More on photosynthetic sea slugs (February 20, 2015).
Other posts on photosynthesis include:
* If an injured heart is short of oxygen, should you try photosynthesis? (June 25, 2017).
* The artificial trees in the artificial forest are now fixing CO2 (and making high-value products) -- naturally (May 13, 2015).
What's the connection: rotten eggs and high-temperature superconductivity?
June 8, 2015
There are two addenda to this post, dated July 15 and September 12, 2015. They add information and formal publications.
It's probably well known that the famous odor of rotten eggs is due to hydrogen sulfide, H2S.
It's probably not well known that the material that holds the record for high temperature superconductivity is that same H2S. In fact, it was only reported last December. The article reporting it has not yet been officially published, but it is receiving considerable attention, so let's look. The claim must be taken as tentative, and there is uncertainty about what chemical is actually doing the superconducting. Nevertheless, it's an interesting development.
There is a claim, and there are results to support it. Here are some results...
|
The graph shows the electrical resistance of the sample (y-axis) at various temperatures (T; x-axis).
Focus on the right-hand (green) curve. This is for "sulfur hydride" (another name for hydrogen sulfide). It is at a pressure of 177 gigapascals. (1 GPa = 109 Pa ~ 10,000 atmospheres.)
Superconductivity is a low-temperature phenomenon, so look at the curve here starting from a high T, at the right. That is, "normal" is to the right (high T), and "things happen" as you go to the left (low T). You can see that the resistance of the sample drops slowly as T is reduced (move to the left) -- until about T =185 K. At that point, the resistance drops precipitously to near zero, and remains there as T is reduced further.
This is Figure 1b from the Drozdov article.
|
That curve demonstrates superconductivity, the flow of electricity without resistance. The T where the resistance drops rapidly and approaches zero is called the critical temperature for superconductivity, or Tc. (Remember, conductivity is the reciprocal of resistance. Zero resistance means the sample is superconducting.) For this sample of H2S, Tc is 185 K. The previous record for high Tc was 164 K.
The red curve? That is for sulfur deuteride, the same chemical but with the heavy isotope of hydrogen called deuterium. Comparison of the curves for different isotopes shows that the mass of the hydrogen is important. This is an important finding for those working on the theory of superconductivity, but we will leave it for now.
In another experiment reported in the same article, the scientists measured Tc = 191 K for a sample of H2S. The data for this is shown in the tiny inset of their Figure 2b. Getting the higher Tc required some tricks in sample preparation. This may be a clue about the nature of the superconducting material; we'll note this again below.
There are two general types of superconductivity. One is called conventional, and conforms to a theory worked out many years ago. The other doesn't follow this "BCS" theory -- and is not understood. The record for highest Tc for the conventional superconductors is 39 K. That record of 164 K noted above is for one of those mystery-class superconductors. You can see that the mystery superconductors are well ahead of the ones that are understood.
What about the superconductivity of H2S? Scientists have worked on the theory. In fact, theory predicts that H2S will be a superconductor, of the "conventional" BCS type. More specifically, a recent article suggested that H2S will superconduct up to about 80 K. Testing that prediction was the motivation for the current work. The current work confirms that H2S superconducts -- but finds a Tc about 100 kelvins higher than expected!
And that brings us to the second part of this story. It is likely that it is not really H2S that is superconducting. We hinted at this above when we noted that getting the Tc = 191 K result required some fiddling. It is likely that the H2S first undergoes a chemical reaction at the ultra-high pressures -- making a new material that is the actual superconductor. What might that new material be? Perhaps H3S, according to some of the modeling. H3S? Think... 3 H2S --> 2 H3S + S. Something like that. Strange things happen at those pressures. It is known that S is not a good superconductor, but the compounds with more H may well be good superconductors.
One group has even predicted that the Tc of the high pressure H2S, whatever it is at that pressure, would be 194 K -- very close to the 191 K observed.
So what do we have, if the new work is confirmed? A record high temperature for superconductivity. The new record (185 K or perhaps even 191 K) is a significant improvement over the previous 164 K, and a huge improvement over what had been found for "conventional" BCS superconductors. Further, it is with a simple chemical -- though perhaps it is not as simple as we might think under the extreme conditions.
For practical use, one would like to have superconductivity at high temperature and low pressure; ambient conditions would be fantastic. For physicists, superconductivity is still full of surprises. Finding that H2S -- or H3S -- is now the high T record holder, and is "conventional", is just the latest surprise.
This post is based mainly on the December article, which announced the experimental result.
News stories:
* Superconductivity record breaks under pressure. (E Cartlidge, Nature News, December 12, 2014.) Good overview.
* High Temperature Superconductivity Record Smashed By Sulphur Hydride. (Physics arXiv Blog, December 9, 2014.) A little more technical, with good consideration of why physicists are cautious about accepting the new claim.
The article, which is freely available: Conventional superconductivity at 190 K at high pressures. (A P Drozdov et al, preprint posted at ArXiv, December 1, 2014.) The status of this article is not clear. However, it is being widely discussed, as the following articles attest.
Follow-up, if you want to go further...
News story, for article #1, below: Secret of record-breaking superconductor explained. (H Johnston, Physics World, April 24, 2015.)
The articles:
1) High-Pressure Hydrogen Sulfide from First Principles: A Strongly Anharmonic Phonon-Mediated Superconductor. (I Errea et al, Physical Review Letters 114:157004, April 17, 2015.)
2) What superconducts in sulfur hydrides under pressure and why. (N Bernstein et al, Physical Review B 91:060511, February 2015.) Check Google Scholar for a freely available copy.
Another case of an abrupt transition from less conducting to more conducting, in this case as the pressure increases: Metallic hydrogen? (March 16, 2012). From the same lab. The article discussed in this 2012 post is reference 17 of the current article. (Caution... The claim here has been challenged; see the linked follow-up post.)
A major new development which can be seen as a follow-up to the current work: Superconductivity in lanthanum hydride: a new temperature record (June 8, 2019).
And then... Superconductivity at room temperature -- at last (October 18, 2020).
Another conductivity story: Electricity in DNA: guarding your genes? (December 16, 2009).
More on unusual chemistry at high pressures:
* How many atoms can one nitrogen atom bond to? (January 17, 2017).
* Novel forms of sodium chloride, such as NaCl3 (January 17, 2014). By the way, the pressure used in the current work is about three times that used in the work discussed in this earlier post on sodium chlorides.
The biology of hydrogen sulfide, H2S...
* Why does a durian smell so bad? (February 14, 2017).
* Garlic or rotten eggs? (February 8, 2010).
* Previous "What's the connection" post... Quiz: What's the connection... (February 14, 2012).
* Next: What's the connection: blue cheese, rotten coconuts, and the odorous house ant? (August 24, 2015).
More, July 15, 2015...
There is some new information available. The authors of the article posted at ArXiv last December have extended the work. They have now shown an additional property that helps to characterize what they observed as bona fide superconductivity. In fact, they now claim 203 K as Tc, a bit higher than before. A news story from Nature News outlines this, and also notes that other labs have confirmed the findings (thought not yet published).
Here is the new item from Nature News... Superconductivity record bolstered by magnetic data. (E Cartlidge, Nature News, June 29, 2015.)
It links to a new article from the authors of the work -- still only at ArXiv, where it is freely available. The new article is reference 2 of this news story.
This story is developing, but we must caution again that we lack formally published articles.
More, September 12, 2015...
Briefly, the story is that hydrogen sulfide has been shown to act as an electrical superconductor at higher temperatures than found previously for any substance. It seems likely that the actual superconducting material is not H2S itself, but a reaction product under the high pressures used, likely H3S.
The work has generated much excitement, but so far all we have had are preprints posted at ArXiv. We now have a formally published article. The more recent article posted at ArXiv, noted in the July 15 addendum, has now been published in Nature. There is no new content, but the news stories are new. The one from Nature News notes the very limited independent replication of the work so far, based on informal inquiry of those likely to be able to do so. I should add that the information on this point here is somewhat different from what the same author said in his previous news story. A caution to keep in mind.
Remember, if you cannot access the Nature article, the versions posted at ArXiv are freely available. The news stories in Nature are freely available; they link to the ArXiv items.
News stories:
* New temperature record: Hydrogen sulfide becomes superconductive under high pressure at minus 70 degrees Celsius. (Phys.org, August 18, 2015.)
* Superconductivity record sparks wave of follow-up physics. (E Cartlidge, Nature News, August 17, 2015.) Includes a useful list of references to the related articles.
* News story accompanying the article: Superconductivity: Extraordinarily conventional. (I I Mazin, Nature 525:40, September 3, 2015.)
* The article: Conventional superconductivity at 203 kelvin at high pressures in the sulfur hydride system. (A P Drozdov et al, Nature 525:73, September 3, 2015.)
The measles vaccine: What does it protect against?
June 6, 2015
If you answered measles, that's a good start.
However, there may be much more to the story. A new article suggests that the measles vaccine reduces the rate of mortality due to all infectious causes.
Let's look at some of the evidence behind this claim...
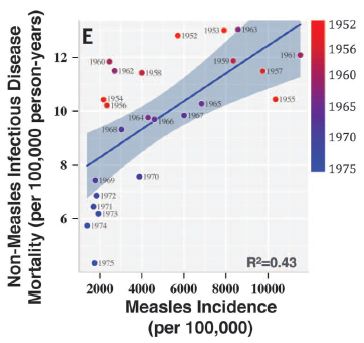
|
The graph compares the mortality (death) rate due to non-measles infectious diseases with the incidence of measles, over a 25 year period in England and Wales. The measles vaccine was introduced there in about 1968.
The first observation is that there is a general correlation: the higher the incidence of measles (x-axis), the higher the mortality due to other infectious diseases (y-axis).
|
The data points on the scatter plot are color-coded by year; see the color key at the upper right. Simplifying a bit to get you started... The reddish points are for early years, pre-vaccine; these years tend to have high measles incidence.
Bluish points are for later years, mostly after the vaccine was introduced; these years tend to have lower measles incidence -- and lower mortality due to other infectious diseases. For example, you can see that most of the bluish points are low on the y-axis scale. It is intriguing that the mortality rate for the non-measles diseases is lowest after the introduction of the measles vaccine.
This is Figure 1E from the article. The full figure also shows similar analyses for the United States and Denmark. The dates analyzed are different for each country, partly because the measles vaccine was introduced at different times in the different countries. The general trend was the same in each case.
|
That graph, alone, does not show the reason for the correlation. There is clearly a lot of scatter in the data; the correlation coefficient shown is significant but not high. The graph is a hint, not an answer. It is a hint that there may be something interesting going on; it is (part of) the starting point for further investigation.
Where does one look for a possible connection? To the immune system. It has been known for some time that measles suppresses the immune system. That can lead to an enhanced susceptibility to other infections. For a few months -- it was thought. In fact, more recent work has shown that measles causes loss of memory cells in the immune system, an effect that may last for a few years.
Here is the idea that is developing... Measles is not only a serious disease in its own right, but it increases deaths due to other diseases by damaging the immune system. The measles infection can eliminate cells in the immune system that protect a person against other diseases. The measles vaccine protects against measles, and in so doing protects against all the other diseases that measles infection would allow.
It's an interesting story; we'll see how well it holds up upon further examination.
News stories:
* Measles Weakens the Immune System for Years. (K Smith-Strickland, Discover, May 7, 2015.)
* What the Measles Vaccine Could Do for Public Health -- Measles may weaken immune system for several years, vaccine may indirectly prevent other infectious diseases. (B Greenwood, dailyRx News, May 9, 2015. Link is to an archived copy.)
The article: Long-term measles-induced immunomodulation increases overall childhood infectious disease mortality. (M J Mina et al, Science 348:694, May 8, 2015.)
Recent posts about measles:
* Fallout from the Ebola outbreak: more measles? (April 28, 2015).
* What if Mickey Mouse got measles? (January 27, 2015).
There is a section of my page Biotechnology in the News (BITN) -- Other topics on Measles. It lists related posts.
Using a plasma to kill norovirus
June 5, 2015
Norovirus is one of the most important agents of food poisoning. It is easily transmitted -- and hard to inactivate.
A recent article explores an unusual approach for reducing the amount of norovirus on surfaces, and offers some encouraging results. Here is an example of the results...
|
The graph shows the reduction in the amount of norovirus (y-axis) vs treatment time (x-axis). Note that the y-axis is a log scale; -1 on the y-axis means there was a 10-fold reduction. Three conditions are shown, with different symbols and lines.
The general picture is that the treatment leads to around a 10-fold reduction in the amount of virus. Longer treatments give greater virus reduction, at least for a while.
This is Figure 2 from the article.
|
What is this treatment? As the label on the x-axis indicates, it is "cold plasma". Plasma is a form of matter that consists largely of charged particles (ions); the ions are highly reactive, and that is the basis of how the plasma kills.
Is this useful? The results here show that this particular type of plasma has some effectiveness in killing norovirus on surfaces. That's a start. The authors argue that the method is practical, say, for common surfaces in a hospital -- and that it would lead to a significant reduction in virus load. However, the article does not have any direct comparison of this method to others, although we know that killing norovirus is difficult. Bottom line? An intriguing result, which deserves follow-up.
News stories:
* Cold plasma treatment cuts norovirus germs. (Science Daily, January 13, 2015.)
* Cold plasma kills off norovirus, German scientists find. (Cleanroom Technology, February 19, 2015.) Caution, this page mixes up bacteria and viruses. The page is from equipment folks, not microbiologists.
The article, which is freely available: Inactivation of a Foodborne Norovirus Outbreak Strain with Nonthermal Atmospheric Pressure Plasma. (B Ahlfeld et al, mBio 6:e02300-14, January 2015.)
Norovirus is a difficult virus to work with. There is no good lab assay for infectious virus. The current work used PCR analysis of the viral RNA. It is plausible that this assay underestimates the effectiveness of the killing.
The cold plasma is being investigated for other medical applications. It is considered safe for humans; I do wonder how solid that view is.
A norovirus story: Possible transmission of norovirus via reusable grocery bag (May 21, 2012).
More... An organoid for the gut: at last, a culture system for norovirus (October 30, 2016).
Perspective... The cost of food poisoning (October 14, 2014).
An early Musings post on food poisoning is... Killer chickens (December 2, 2009). It includes an extensive list of related posts.
My page Internet resources: Biology - Miscellaneous contains a section on Nutrition; Food safety. It includes a list of relevant Musings posts.
Another application of plasma: Improving soybean oil by using high voltage plasma (January 9, 2017).
Also see... An antiviral coating for medical textiles (July 12, 2020).
June 3, 2015
Top 10 new species for 2015
June 3, 2015
18,000 new species were formally announced during 2014. Now, the College of Environmental Science and Forestry (ESF, at the State University of New York, Syracuse) has chosen a "top 10". It is an annual presentation, which is timed to coincide with the birthdate of Linnaeus, the biologist who established our modern system of taxonomy.
Announcement: The ESF Top 10 New Species for 2015. (ESF, May 23, 2015.) Includes a list on the main page, then a separate page for each of the chosen species, with plenty of pictures and some explanation.
News story: An animal that could rewrite the family tree: one of the top new species of 2015. (S Lawler, The Conversation, May 21, 2015.) This is a nice news story, a single page with a brief description -- and picture -- of each featured species. This is a good place to start.
One of those featured species made Musings last year: Quiz: What is it? (September 23, 2014). The lead picture for the news story listed above is the same picture I used in that post.
More about Linnaeus... Was Linnaeus's original elephant African or Asian? (December 7, 2013).
A clinical trial of ice cream
June 2, 2015
It's good.
This is one of those stories that sounds odd in some ways. On the other hand, it is actually a rather nice piece of science. It deals with an important issue. It is based on an interesting premise, and involves a nice test, even if rather small.
The premise? That probiotic bacteria night help prevent tooth decay in children. The scientists, from dental schools in India, choose to examine two species of bacteria commonly considered probiotic: Bifidobacterium lactis and Lactobacillus acidophilus. It's not obvious they would be good choices as dental probiotics, but there is some background work supporting the choice.
How do we deliver dental probiotics to children? Food, perhaps. And what is every child's favorite food -- world wide? Ice cream, apparently. The authors spend some time in the article making the case for ice cream.
The trial? Give children ice cream that contains the probiotic bacteria. Test them. Of course, we need a placebo: ice cream that doesn't have the bacteria added.
The scientists thus arrange for the children to get their ice cream. This is a short and simple trial; what they do is to check the children's saliva for caries-promoting bacteria, Streptococcus mutans. The ice cream treatment, with or without probiotics, is for 7 days. The scientists measure the bacteria in the children's saliva before and after the treatment, as well as at a couple of later times to see if the effect persists.
It worked. The children with the probiotic-containing ice cream had fewer of the bad bacteria. The effect wasn't big, but it seemed significant. An encouraging first result. Perhaps ice cream with a higher load of the probiotic bacteria, and used over a longer time, would be more effective. The effect wore off a few months after the ice cream treatment stopped; not a surprise.
It's a small step, and needs further work. In particular, they need to show whether it actually affects tooth decay over the long term. All they measured here was a short term "proxy"; since it was encouraging, they need to move on and measure "the real thing". Doing that will require that they find more children willing to endure the treatment.
News story: Probiotic ice cream may boost oral health for kids. (S Daniells, NutraIngredients-USA.com, April 28, 2015.) I am unfamiliar with the source, but the page appears to be a good presentation of the work.
The article, which is freely available: Effect of Probiotic Containing Ice-cream on Salivary Mutans Streptococci (SMS) Levels in Children of 6-12 Years of Age: A Randomized Controlled Double Blind Study with Six-months Follow Up. (D Ashwin et al, Journal of Clinical and Diagnostic Research, 9:ZC06, February 2015.)
More about probiotic bacteria...
* Would a probiotic reduce sepsis in newborn babies? (October 20, 2017).
* Staph fighting Staph: a small clinical trial (April 8, 2017).
* How to administer Bt toxin to people? (May 16, 2016).
* Could we treat obesity with probiotic bacteria? (August 5, 2014).
* How probiotics work: a clue? (October 11, 2010). Discusses Lactobacillus.
More dairy...
* The nutritional value of yogurt? (September 28, 2018).
* The oldest known piece of cheese (April 25, 2014).
More about tooth decay: Is fluoride neurotoxic to the human fetus? (December 13, 2017).
Comparing woolly mammoth genomes over time
June 1, 2015
A new article reports the population sizes for a couple of groups of woolly mammoths, and offers some suggestions about their genetic diversity along their road to extinction.
What's behind that? The genome sequences for two mammoths, one about 45,000 years old and the other about 4,300 years old. The latter, at least on the evolutionary time scale, must have been one of the very last mammoths to live.
How do we get from genomes to population size? The idea is simple... We are diploid; we have two sets of chromosomes, one from each parent. If our parents are random members of a large population, then our two chromosome sets are very different. But imagine a tiny population, with only a few animals. There would be very little difference between our two sets of chromosomes. The heterozygosity -- the degree of difference between the two genomes of a diploid -- is a measure of the population size (with some assumptions). And the younger of the mammoths the scientists sequenced here had less genetic diversity than the older one. We might expect that a population near extinction would have reduced genetic diversity. Now it has been measured -- for an animal not seen for over 4,000 years.
As so often with genome work, it's a rather abstract story, mostly done by computer analysis. It's hard to explain (I gave one key idea above, but no data), and there are no beautiful pictures of key results. It's also important to remember that the results often have rather large error bars. Some of what we read now will not hold up as further data is collected. The authors here spend much time discussing the uncertainties, and emphasize that the conclusions are tentative. What we can confidently predict is that more data will come, and that in itself is something not easily foreseen a decade ago.
News story: Woolly mammoth genomes offer insight into their history and extinction. (Phys.org, April 23, 2015.) This page does have a couple of beautiful pictures of mammoth tusks; it is not clear what relationship the pictured specimens have to the current work.
The article: Complete Genomes Reveal Signatures of Demographic and Genetic Declines in the Woolly Mammoth. (E Palkopoulou et al, Current Biology 25:1395, May 18, 2015.)
Follow-up, with further analysis of these genomes: Accumulation of deleterious mutations in the last mammoths (May 6, 2017).
An early post on the mammoth genome: A mammoth story (December 1, 2008).
Also... Uptake of small pieces of ancient mammoth DNA by bacteria: What are the implications? (May 13, 2014).
The first of two posts on the genome of Denisovan man: The Siberian finger: a new human species? (April 27, 2010). The interpretation of the Denisovan genome changed between our first and second posts on the topic.
A book, listed on my page Books: Suggestions for general science reading: Shapiro, How to clone a mammoth -- The science of de-extinction (2015).
There is more about genomes on my page Biotechnology in the News (BITN) - DNA and the genome. It includes an extensive list of Musings posts in the broad area of genomes and sequencing.
SyAMs: Synthetic drugs that act like antibodies
May 31, 2015
Antibodies are useful drugs, but they are expensive, and their size limits how they can be used. Can we do better? Can we design small, cheap molecules that would do the job? It's a tall order, but a recent article offers some encouraging results, at least in principle. Simply trying to do it requires a careful look at what it is antibodies do.
Here is the idea...
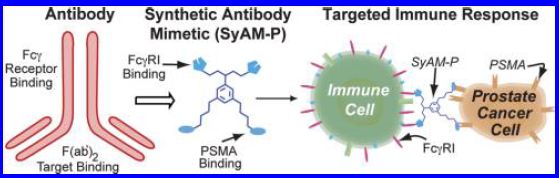
The first frame (left) shows a common diagram of an antibody molecule. It shows the Y-shape, with four protein chains. (Two of the chains are "heavy", meaning large, and two are "light".) There are two key functional regions: receptor binding (at the top), and target binding (bottom). The latter is the part that is specific for a specific target, such as a virus feature. The former binds to an immune system cell, and "activates" it. That is, the antibody brings together the target molecule and the immune system cell; as a result, the immune system cell is activated by the presence of the target. If we are going to make a synthetic antibody, that is what it must do.
The second frame is a similar diagram for a synthetic antibody mimetic (SyAM). This is not a protein, but a "small", drug-like molecule that the scientists have made in this work. The SyAM is about 1/20th the size of the antibody. You can't tell that from the figure, since both are drawn about the same size. But the antibody is a protein -- a large one at that, and the SyAM is an "ordinary" small chemical, as perhaps hinted by the benzene ring in the middle. (It's not all that small; it has a molar mass of about 7000. But compared to an antibody, that's small.) The SyAM shown here is a specific example, which will bind a specific target feature and specific immune cell feature -- as we will see in a moment.
The third frame (right) shows the SyAM in action. It is now in between an immune system cell and a prostate cancer cell. It binds to -- and connects -- those two cells because it has been designed to bind to specific features on those cells. This is what we need for a targeted immune response.
The two big horizontal arrows indicate the logical sequence: the antibody in the first frame provides the design for the SyAM in the second; that gets used for the biology operation in the third.
PSMA stands for prostate-specific membrane antigen, the feature of the prostate cancer cells that the scientists use here. The PSMA of the cancer cell binds to the PSMA-binding region of the SyAM.
This is the Figure from the abstract to the article.
|
If this works as intended, then the immune system cell should be activated if added to the prostate cancer cells plus the SyAM, which brings them together. As a first step to testing this, the scientists used PSMA-tagged beads (rather than cancer cells); that's done for experimental convenience. Here are some results...
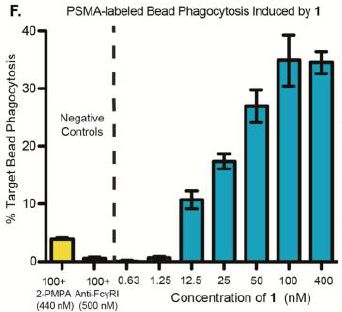
|
This is a test to see if the three-part system shown above works. We'll leave the technical details, and simply note that the y-axis is a measure of whether the immune cells are activated.
Look at the blue bars -- the ones to the right of the dashed vertical line. They show the activation as a function of SyAM concentration (x-axis). You can see that the activation increases as the SyAM concentration increases. That's good.
The x-axis scale is odd, so be careful about interpreting it. The main point is that the bars are in order of increasing concentration. However, they are not evenly spaced, on either a linear or logarithmic scale. The "1" in the header and x-scale refers to compound 1, which is the SyAM of interest.
This is Figure 2 part F from the article.
|
So it works. At least it works with tagged beads. It actually took some further development to get a SyAM that worked with real cancer cells, but they achieved that, too. They have made a synthetic molecule that acts like an antibody. It's impressive. It's also not clear how useful it is -- at this point. This "small" molecule is rather big. It was expensive to design and it would be expensive to make. It remains to be seen whether something useful can come of this, but it is a fascinating development. The current article offers the first steps, and led to useful progress as well as considerable understanding.
News stories:
* New class of synthetic molecules mimics antibodies. (Science Daily, December 17, 2014.)
* The Immune System, In Pill Form: SyAMs May Treat Cancer, HIV, And Autoimmune Diseases. (Medical Daily, February 11, 2015.)
The article: Chemically Synthesized Molecules with the Targeting and Effector Functions of Antibodies. (P J McEnaney et al, Journal of the American Chemical Society (JACS) 136:18034, December 31, 2014.)
A post about using an antibody therapeutically: Rotavirus: passive immunization via food (January 10, 2014).
A post that introduced the general Y-shape of antibodies: A more powerful method for measuring what is in a cell (July 23, 2013).
More about antibodies: Should we make antibodies to HIV in cows? (November 14, 2017).
More about prostate cancer... Diagnosis of prostate cancer in a 2100 year old man (November 8, 2011).
My page for Biotechnology in the News (BITN) -- Other topics includes a section on Cancer. It includes a list of related Musings posts.
What did Osedax worms eat before there were whales?
May 30, 2015
Osedax worms are best known for eating whale bones that have fallen on the ocean floor. Well, that and what they look like. An earlier post introduced Osedax [Link at the end].
Osedax worms are annelids -- the same phylum as earthworms. Annelids long predated whales. We must wonder what Osedax ate before there were whales. Or, perhaps there were no Osedax before whales; perhaps they are a new lineage evolved to specialize on whale. Actually, it is known that Osedax can attack a wide range of vertebrate bones, so there is no pressing problem here -- just curiosity. It's part of uncovering the history of Osedax.
How about sea turtles and plesiosaurs? A new article provides evidence for Osedax attacks on bones of such marine reptiles, based on fossils as old as 100 million years -- long predating the whales.
The evidence is based on examining fossils of these reptiles, and analyzing wounds in the skeleton. The analysis is largely based on CAT scans, revealing the 3D structure. The analysis suggests that these wounds are very much like Osedax wounds found in more recent whale bone fossils; that is the basis of the conclusion. There are some interesting pictures in the article, but it is hard for a casual observer to tell much from them. (You can also see the pictures in Switek's news story, listed below.) We should note explicitly that no traces of the Osedax themselves were seen; in general, none would be expected for a soft-bodied worm.
If this finding is accepted and confirmed, it extends our knowledge about Osedax. In particular, it makes clear that Osedax, or something very similar, was around 100 million years ago. We didn't know that; attempts to date the origins of the group had led to widely different estimates, some much more recent.
There is an interesting implication of the finding. If Osedax consumed skeletons, then it may have biased the observed fossil record. This is not a new issue, but it is a new example of how the fossil record can be biased.
News stories:
* Bone eating worms dined on marine reptile carcasses. (Science Daily, April 14, 2015.)
* The Deep History of the Sea's Bone-Eating Worms. (B Switek, Laelaps, National Geographic, April 23, 2015.) A quite thorough discussion of the article.
The article: Bone-eating Osedax worms lived on Mesozoic marine reptile deadfalls. (S Danise & N D Higgs, Biology Letters 11:20150072, April 2015.)
Background post about Osedax: A quasi-quiz: The fate of bone and wood on the Antarctic seafloor -- and the discovery of new bone-eating worms (August 20, 2013). Includes (even features!) a picture.
More about bias in the fossil record: How fish rot -- and the implications for studying fossils (April 6, 2010).
More about sea turtles... Magnetic turtles (July 5, 2015).
More worms... Could a tapeworm with cancer transmit the cancer to its human host? (November 16, 2015).
Also see: The mystery of the first dinosaur found in the state of Washington (June 12, 2015).
May 27, 2015
What can we learn by looking at the DNA in vampire bat feces?
May 27, 2015
We can learn what they eat.
Analyzing feces for remains is a common way to study what an animal eats. However, vampire bats consume only the blood of their prey, and blood doesn't leave remains. Or does it?
A new article examines vampire bat feces for DNA. The scientists can identify the source of the DNA; that source was the bats' prey.
To do this, the scientists worked out a simple DNA test that allowed them to distinguish the source of DNA found in the bat feces. They focused on a single (mitochondrial) gene; the DNA sequences for this gene for several relevant organisms were already in the databases. The scientists amplified the DNA from the feces, and after treatment with selected restriction enzymes, ran it on a gel. The gel pattern distinguished the source of the DNA: pig, chicken, cow, dog, human, vampire bat. They worked this out with controlled experiments using captive vampire bats fed a single type of blood. They then looked at samples from "the wild" -- 18 villages in Brazil's Amazonia.
The following graph shows what kind of DNA was found in feces of vampire bats collected from villages in two localities (groups of villages).
|
The figure shows that the strongest signal is for pig, with much smaller signals for chicken and cattle. We'll explain the detail of the y-axis scale later, but what you see here is the authors' main conclusion.
This is part of Figure 3 from the article. The other parts show the separate results for the two localities; they are similar.
|
In addition to the three food sources shown above, a low level of dog DNA was found in bats from one area. Human DNA was not found; the authors do note that attacks of vampire bats on humans were reported in one village under study. None of several other possible wild vertebrates were detected; apparently these bats have adapted to living around humans populations and their farmed animals -- even in the rather primitive Amazon jungle. No "host" (vampire bat) DNA was detected.
Now, things aren't quite that simple... The graph above shows a preference for eating pig. However, the raw data showed that about 2/3 of the DNA samples were from chicken. That is, chicken was the most common prey. Why does the graph say pig? The scientists normalized the raw results by the availability of the various prey. That is, they divide the number of DNA samples found for each prey by the population size for that animal. When they do that, they get the "selection ratio", which is what is shown on the y-axis above. The value shown for pig is about 8; this means that the bats choose pig about 8 times more often that expected from their availability. Chicken may be the most common prey, but when population size is taken into account, it seems that the bats prefer pig.
Comment... Normalization is obviously a good idea. Clearly the availability of various prey affects how often they are consumed. However, I'm not at all sure that normalizing the raw data by the number of available prey is the right approach. After all, pigs are much bigger than chickens. If the data were normalized by surface area, surely the preference for pig would be lost. Would that be better? I don't know. How does a vampire bat choose its food? Is a large animal a better target? The authors present both raw data and the results normalized by number (shown in the figure above). They mention the size issue, as well as other possible reasons for the bats preferring one or another food. These include that pig blood may be more nutritious than chicken blood. My point here should be taken as a question, not a criticism.
News story: Vampire bats have a taste for bacon. (C Cesare, Science, April 10, 2015.) Bad title... They don't eat bacon; they consume blood.
The article, which may be freely available: Prey preference of the common vampire bat (Desmodus rotundus, Chiroptera) using molecular analysis. (P E D Bobrowiec et al, Journal of Mammalogy 96:54, February 2015.)
More about vampire bats:
* The biological basis of sanguivory (March 2, 2018).
* How to find the blood (August 29, 2011).
Previous post about bats: The use of wing clicks in a simple form of echolocation in bats (May 22, 2015).
More about pork... Cooking pork (June 4, 2011).
Other vampires: Quiz: What is it? (November 20, 2012).
More about feces:
* What can we learn from 17,000-year-old cat feces? (September 16, 2019).
* The effect of defecation by whales on global warming (August 2, 2010).
How graphs can mislead
May 24, 2015
A new article discusses how graphs, especially bar graphs, can be misleading. In fact, that is the central topic, and purpose, of the article.
The following figure illustrates the concern...
Frame A (left) shows a small bar graph. It is straightforward. The height of each bar shows the mean of a set of measurements; an error bar (or at least the upper half of an error bar) is also shown.
A question... Are the data sets for these two bars significantly different? Do you think you have a good feel for what those data sets -- the raw data that gave rise to these bars -- look like?
The remaining four frames show examples of data sets. In each case, there are two sets of points (left, right). Importantly, each frame is properly summarized by the same bar graph, in frame A. That is, the mean and standard error of each set is (approximately) the same -- and that is all the bar graph shows. (Within each of the two sets of points in each frame, the x-axis has no meaning. There are just two sets of y-values.)
This is Figure 1 from the article.
|
What's the point? Each of those data sets looks different. A careful scientist will have different reactions to the data in frames B and E. Yet each data set is summarized by the same bar graph. If all we see is the bar graph, then we don't know what the data is behind it.
The table below the graphs makes the same point in a different way. The table shows the p values that would be calculated for each data set. That is the probability that the observed distribution would be found by chance. To make things even more interesting, three different ways of calculating p are shown. You can see that the p values range from 0.035 to 0.128. It's common to use p = 0.05 as a cutoff for whether the results are statistically significant. The bar graph in frame A may or may not show a statistically significant difference -- depending on what the data is behind it (and depending on the test used).
Why is the bar graph a problem? The bar graph is a summary of the data. In contrast, the other frames show the actual data. (Simple analogy... The mean of a set of data is a single number that summarizes the data set. It doesn't tell you about how the points are arranged.) The authors argue that all too often authors of articles show a summary when it would be better to show the actual data. Summaries are useful. They hide the details, and help us see the big picture. They hide the details, and keep us from seeing what is going on. Take your choice. At least, be aware of the choice; don't just blindly substitute a summary for the real thing.
Bad graphs is a pet peeve of mine. I've noted some bad graphs from time to time... graphs that are poorly labeled, poorly laid out, too crowded to be readable; various reasons. I've even thought of collecting bad graphs -- and perhaps featuring them somewhere. The current article is a part of that story. And it is getting attention among scientists.
When you make a graph, for whatever reason, think about what it is for. Choose a graph that shows what you want to show. It's even reasonable that you may want to make more than one graph of the same results.
From the abstract of the article: "We recommend training investigators in data presentation, encouraging a more complete presentation of data, and changing journal editorial policies."
News story: Data Presentation Matters: A Partial Solution to the Reproducibility Crisis. (Mike the Mad Biologist, April 28, 2015.)
The article, which is freely available: Beyond Bar and Line Graphs: Time for a New Data Presentation Paradigm. (T L Weissgerber et al, PLoS Biology 13:e1002128, April 22, 2015.)
One reason for crowded graphs in scientific journals is that some journals restrict how much space graphs can have. At times, the journals effectively insist that the graphs be too small to read. One such journal with such a policy offers its own feature articles with graphs that are often incomprehensible, for one or another reason. My sense is that the graphs are made by artists not scientists. The first purpose of a graph is to convey information.
An example of a post where I noted a confusing graph: Where is the control knob for global warming? (November 16, 2010). (I'm sure there are others, even "better" ones. But offhand, I don't know where.)
One issue above is the meaning of p values. We have discussed that before, such as: More on the story of p (March 2, 2014).
There is more about data presentation on my page Internet resources: Miscellaneous in the section Mathematics; statistics. It includes a listing of related Musings posts.
The use of wing clicks in a simple form of echolocation in bats
May 22, 2015
Most bats have a quite sophisticated navigation system using echolocation. They emit a vocalization, and detect the echo. One group of bats lacks this echolocation (or "sonar") system; these are the Old World fruit bats.
A recent article shows that some of those bats without a "conventional" echolocation system actually have a "simple" form of echolocation. They make clicks with their wings, and detect the echo from those sounds. It works, but not very well, compared to the conventional system.
The work started with noticing that the bats, supposedly non-vocal, made the sounds. The bat's mouth was often closed during sound production; taping the mouth had no affect, but interfering with the wings did. The sounds came from the wings.
The next challenge was to figure out what role the wing clicks played. The bats clicked differently depending on the situation; they clicked mainly in the dark. This suggests there might be a role in navigation in the dark. Interestingly, the bats could be trained to distinguish two large objects of similar appearance, but different in their ability to reflect sound. That showed the bats could use their wing-click system for navigation, though it leaves open how much they do so in nature.
It is not at all clear how this wing-click echolocation is related to the usual vocal-based echolocation. For example, do the two processes share part of the receptor system? analysis system in the brain? The current article finds a new phenomenon. It seems common (it was found in all three types of Old World fruit bats checked), but variable. It's good enough that it probably allows a bat to avoid flying into the cave wall in the dark, but it won't help in catching food. Take it as a new finding, and don't try to interpret it too much at this point.
Video. There are three short videos with the article. If you have a chance, try #2-3. They show a wing-clicking bat seeking a target. In Supplementary Movie 2, the search is in darkness; in Movie 3, it is in the light. (It might even be good to start with Movie 3, in light, and see how well the bat finds its target -- without clicking its wings.) In Movie 2, you will see that the bat finds the target, though not easily. You will also hear wing clicks. The authors note that the audio track of wing clicks was recorded separately and added on to give you the idea; it is not the actual audio that goes with this video sequence.
* Movie 2. (27 seconds; sound.) In the dark (recorded in infrared light).
* Movie 3. (5 seconds; sound? Well, listen and check for yourself. The microphone is on.) In the light.
News stories:
* 'Non-echolocating' fruit bats actually do echolocate, with wing clicks. (Science Daily, December 4, 2014.)
* Fruit Bats Have Sonar Too (But It's Not Very Good). (E Yong, Not Exactly Rocket Science, National Geographic, December 4, 2014.) Wonderful picture at the top; it is one of the species studied here. (There is some confusion here about how the wing clicks are made. Bottom line... it isn't clear, so don't worry too much about this.)
The article: Nonecholocating Fruit Bats Produce Biosonar Clicks with Their Wings. (A Boonman et al, Current Biology 24:2962, December 15, 2014.)
Posts about bats and echolocation include:
* Jamming of bat sonar, by bats (January 20, 2015).
* On a similarity of bats and dolphins (September 15, 2013). This post notes a similarity in echolocation between two very different groups of mammals. The current post notes two distinct types of echolocation within one of those groups.
Next post about bats: What can we learn by looking at the DNA in vampire bat feces? (May 27, 2015).
More about bat communication: What do bats argue about? (April 21, 2017).
May 20, 2015
Can you make a 777 by printing it?
May 19, 2015
777? As in Boeing 777 passenger jet.
No. But engineers at GE Aviation have (almost) printed a jet engine, albeit a small one. It's more an engine for a hobbyist's remote-controlled model airplane than for a 777. Still, it is a functioning jet engine.

|
The parts. All of these parts were printed. (However, the assembled engine contained some parts that were from sources other than printing.)
This is reduced from a figure in the Kurzweil news story; an equivalent figure is in the GE story. Both of those pages include a picture of the assembled engine; it provides a sense of scale.
|
They have also printed a part for the 777, and it was recently officially approved by the (US) Federal Aviation Administration (FAA) for use -- on real 777s. (It's a T25 sensor housing; no matter.)
3D printing, or additive manufacturing, is a technology that is rapidly developing. It builds on the long-familiar inkjet printer. We've noted other achievements from time to time; some are listed below. 3D printing is actually a set of technologies, as scientists learn new ways to use materials. In this case, they are printing metals.
Let's modify that first negative answer I gave above. How about... Not yet.
There is no peer-reviewed article here. This post is based on two pages from GE, which Kurzweil picked up. We briefly note them as newsworthy events.
News story: A 3D-printed mini jet engine that performs at 33,000 RPM. (Kurzweil, May 13, 2015.)
Here are the two GE pages. Both are linked to in the Kurzweil story.
* These Engineers 3D Printed a Mini Jet Engine, Then Took it to 33,000 RPM. (M Keller, GE Reports, May 9, 2015. Now archived.) Includes a video of the engine in operation.
* The FAA Cleared the First 3D Printed Part to Fly in a Commercial Jet Engine from GE. (GE Reports, April 14, 2015. Now archived.)
Here are a couple of previous posts on 3D printing; they link to more.
* 3D printing for space: a titanium woov, and more (April 29, 2014).
* 3D printing: simple inexpensive prosthetic arms (January 29, 2014).
Among posts on airplanes... An ion-drive engine for an airplane? (February 15, 2019).
A gene that reduces the chance of successful pregnancy: is it advantageous?
May 18, 2015
Many fertilized egg cells do not develop successfully. Many of those that don't develop are aneuploid: they do not have the proper number of chromosomes. There has been a failure in distributing chromosomes during cell division at some point.
A new article reports progress in understanding why the aneuploidy occurs. The new discovery shows that a mutation in the mother's genome leads to a high frequency of failure of cell division in her fertilized eggs. This is an interesting discovery in itself -- but there is a surprising twist, which we will note in a moment.
In general, the aneuploidy might have been due to improper cell division during the formation of the gametes, or to improper cell division of the fertilized egg. Both types are known. The current article is about one cause of the latter.
The work here was done while studying the early development of human embryos in an in vitro fertilization (IVF) facility. It is part of the IVF process to examine the developing embryos to see which are healthy; genetic testing may also be done. In this work, the scientists found an association between a particular mutation in the mother and a higher rate of aneuploidy in the developing embryo. They infer that the genetic region in question affects the fidelity of chromosome segregation during mitosis. That region contains a gene that plausibly might affect chromosome segregation; it affects formation of the mitotic spindle, where chromosomes are aligned during cell division.
Having found a mutation that interferes with chromosome segregation, and hence with pregnancy, the scientists looked at its distribution in human populations. The mutation is not seen in Neandertal or Denisovan genomes. Further analysis suggested that the mutation has been enriched (selected for) over time. That's odd. Why would a mutation that reduces the chance of pregnancy be selected for?
The article presents a new finding, one that is both important and interesting. It is a step toward understanding why some pregnancies are lost, and why some mothers may be more likely to lose pregnancies. However, we must emphasize that there are many limitations to the study. The identification of the gene is tentative; it is possible that a nearby gene is what is involved. It is also possible that the mutation interfering with pregnancy is not itself being selected for, but that some nearby mutation is, and the current pregnancy-interfering mutation is "hitchhiking". It is much too early to resolve this, or even to worry about it (though you will find some speculative discussion in the article and accompanying stories). So we simply note the findings, note that they are early, but also note that they offer a possible mystery.
The uncertainties noted above are common in human genetics. The original observation is about a genome sequence. It is from a type of study called genome-wide association study (GWAS). It involves finding a genetic association -- a correlation. Nothing about the function of the sequence goes into this part of the analysis. The genetic linkage implicates a region of the genome rather than the specific site. It can take considerable work to sort this out. Humans are not good animals for experimental genetics.
News stories:
* Researchers find gene that increases rate of maternal aneuploidy. (B Yirka, Medical Xpress, April 10, 2015.)
* Study Published In The Journal Science Identifies The First Genetic Variant Directly Correlated To Mitotic-Origin Aneuploidy In Human Embryos. (BioSpace, April 15, 2015.) This news story was added to replace one that is no longer available.
* News story accompanying the article: Aneuploidy and mother's genes -- A human genetic variant found at high frequency is associated with reduced fertility. (S H Vohr & R E Green, Science 348:180, April 10, 2015.)
* The article: Common variants spanning PLK4 are associated with mitotic-origin aneuploidy in human embryos. (R C McCoy et al, Science 348:235, April 10, 2015.) Check Google Scholar for a pdf copy from the authors.
More about egg development... Why human egg cells become increasingly defective as the mother ages (June 21, 2016). A news feature, with an overview of the topic of the current post.
More about IVF...
* In vitro fertilization: Will it suffice to transfer only one embryo? (May 19, 2013)
* Medical ethics: pregnancy reduction (August 20, 2011).
* In vitro fertilization: an improvement and a Nobel prize (October 15, 2010).
Another post about selection for a mutation: The iron war (May 17, 2015). This is the post immediately below.
More about mitosis: Chromosomes -- 180 million years old? (April 18, 2014). Good pictures, but you'll have the check the full figure in the article to see the mitoses. The article should be freely available at this time.
More about modern humans and Neandertals...
* A gene from Neandertals that promotes human fertility (November 1, 2020).
* A person who might, just possibly, have met his Neandertal ancestor (June 30, 2015).
More GWAS... The genetics of being a "morning person"? (April 15, 2016).
Also see:
* Pregnancy in males: It's similar to pregnancy in females (February 22, 2016).
* Increased risk of congenital heart defects in offspring from older mothers: Why? and can we do anything about it? (July 18, 2015).
The iron war
May 17, 2015
A recent article makes an interesting contribution to a couple of stories. First, iron is an important nutrient. It is essential for all aerobic organisms. However, it can be difficult to obtain, since the common form of iron is quite insoluble in neutral solution. Second, pathogens and hosts engage in evolutionary warfare. Hosts develop resistance to pathogens; pathogens overcome host resistance. Repeat. Over and over. It is sometimes argued that such "warfare" is a major driving force behind evolutionary development. (That idea is sometimes referred to as the Red Queen hypothesis. There is lots of action, but no one gets anywhere.)
The current article connects those two stories. Pathogens and host both require iron as a nutrient. In a pathogen-infected host, they compete for the same iron. The article provides evidence for the evolutionary war as they compete for the iron.
The following figure shows the idea...
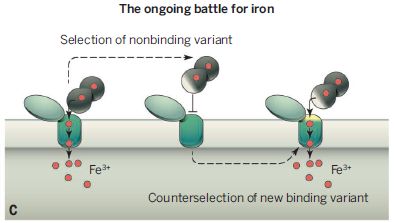
|
There are three frames in the figure. We need to understand the first, at the left, in some detail, before following what happens later.
|
In that first frame several things are depicted. The two dark round things (upper right) are parts of a transferrin molecule. Transferrin is a protein that vertebrates use to carry iron ions.
The small reddish circles are iron ions, Fe3+. You can see a small red Fe3+ circle on each large dark transferrin circle.
The green oblongs are for the transferrin receptor. (There are two oblongs. They are actually different, but we can largely ignore that here.) The transferrin receptor is also called transferrin binding protein (Tbp) in some organisms.
The big horizontal structure is a cell. The upper (lighter) part is the cell membrane. The lower part is the cytoplasm. (No, the C at the lower left doesn't stand for cell. It identifies this as part C of a larger figure.)
How does this all work? The transferrin receptor spans the membrane. Transferrin binds to the receptor. The receptor takes iron ions from the transferrin and releases them to inside the cell (at the bottom). That's the basic idea of how transferrin, along with transferrin receptor, works.
Now what? Well, in this figure, that membrane is a bacterial cell membrane. It is the membrane of an invading pathogen -- and the pathogen needs Fe3+, too. It makes its own analog of a transferrin receptor, to steal the host's iron.
That's what the iron war is about.
The next two frames are variations of that left-hand frame. They show some of the war moves, over evolutionary time.
The host can score by mutating its transferrin so that it can't bind to the pathogen's receptor. This is shown in the middle frame. There is a little off-color region near the bottom of the transferrin; that represents a mutation -- which prevents binding to the receptor. The inverted T-shaped symbol ( ⊥ ) between the transferrin and the receptor is a common way to show that a step is blocked. (Of course, the mutant transferrin still binds fine to the host's own receptor.)
The pathogen can score by mutating its receptor protein so that it now binds the host's new transferrin. This is shown in the right-hand frame. The transferrin has that same mutation as before (light patch); the receptor now has a "matching" light patch. The mutant pathogen receptor now binds the mutant transferrin, and the pathogen is back in business.
This is part C of the Figure in the news story accompanying the article.
|
That's the idea. Remember, the figure is a cartoon -- of what we think is happening. Evidence? The article examines the genes for human transferrin and for certain bacterial transferrin receptors. The results show hot-spots for mutational changes at precisely those sites of contact. That is, mutations are more frequent at the contact sites than at other sites. That's evidence that selection has occurred. The frequency of a mutant gene depends on how often the mutation occurs, but also on how well the mutant gene fares over time. Mutations that provide an advantage increase in frequency; that is "positive selection". In this case, the evidence suggests that both host and pathogen are making changes supported by positive selection.
Why is there a selection for these mutations? According to the model (and the cartoon figure above), it is because the host transferrin mutations reduce the ability of pathogens to damage the host, and because the pathogen mutations increase the ability of the pathogen to survive. The scientists examine the ability of certain transferrin receptor proteins to bind to certain transferrins, and the results are largely as one might predict from that model. They do not have direct evidence that the mutations provide the suggested benefit; that is an inference from the description of the mutations, and is probably testable.
That's how the iron war is fought. No one is winning. The Red Queen would understand.
News stories:
* Yarr! Humans evolving to escape from bacterial iron piracy -- An evolutionary arms race keeps humans and bacteria right where they started. (D Gitig, Ars Technica, December 13, 2014.) Explains the reason for the name Red Queen hypothesis, if you don't know it.
* Humans Battle Bacteria over Iron as an Evolutionary Prize. (GEN, December 12, 2014.)
* News story accompanying the article: Genetics: The battle for iron -- Evolutionary analysis shows how a mammalian iron transport protein evolves to avoid capture by bacteria. (A E Armitage & H Drakesmith, Science 346:1299, December 12, 2014.)
* The article: Escape from bacterial iron piracy through rapid evolution of transferrin. (M F Barber & N C Elde, Science 346:1362, December 12, 2014.)
More about the iron limitation for growth: Fertilizing the ocean may lead to reducing atmospheric CO2 (August 24, 2012).
Another post dealing with positive selection of two traits together: Butterflies and UV vision (June 29, 2010).
More about selection... A gene that reduces the chance of successful pregnancy: is it advantageous? (May 18, 2015). This is the post immediately above.
More about membranes: How flippase works (September 25, 2015).
The aphid-bacterium symbiosis: a step toward manipulating it
May 15, 2015
Let's look at some results... The following figure shows how two different strains of aphid fared upon being heated.
|
The two strains are in the two columns; we'll explain what they are later. There are three types of measurements, one in each row.
Look at the top row of results... In this row, the data are for the time it took for adults to emerge. For the left-hand strain (labeled LSR1), this was just under 7 days in the "control" (20 °C; dark bars); it increased to over 8 days when treated with heat (4 hours at 35 °C, at a particular stage of development; light bars). The difference was statistically significant, as shown by the asterisks.
In contrast, the right-hand strain showed only a small increase, which was not statistically significant.
That is, the right-hand strain seems to be relatively heat-resistant, compared to the left-hand strain.
|
The other two rows show other measurements in the same system. The middle row is for the weight of the adults; the bottom row is for the number of progeny. In both of these cases, the results are in agreement with the conclusion from the top row: the right-hand strain is relatively heat-resistant.
This is Figure 3 from the article.
|
What is the difference between these two aphid strains? Why is one more heat-resistant?
To understand this, we need to recall that these aphids carry symbiotic bacteria, called Buchnera. The key in the current experiment is that the scientists replaced the Buchnera that were found normally in strain LSR1 with a more heat-resistant strain. Giving the aphids a more heat-resistant Buchnera made the aphids more heat-resistant.
The name of the right-hand strain is LSR1<5AY. The name describes that this is strain LSR1 with Buchnera from strain 5AY. Note that the direction of the "arrowhead" in the name points to the direction that the bacteria were transferred.
How did they do the replacement? It was known that the LSR1 aphid contained heat-sensitive Buchnera. Step 1 of the replacement procedure was to use the heat treatment to reduce (if not eliminate) the endogenous Buchnera. Step 2 was to inject new Buchnera into the developing aphids. It worked, as the results shown above document.
The major advance in this work was developing the ability to replace one kind of Buchnera with another. This was novel; normally the bacteria are transmitted "vertically", from mother to offspring, not via the environment. Further, the bacteria themselves are obligate symbionts, which cannot be grown in lab culture. The replacement technique allows the kind of experiment seen above. The results show the usefulness of such an experiment: we learn rather directly how the bacterial symbiont affects the host physiology. More will come from this system -- undoubtedly.
News story: Transferring primary symbionts: a missed link? (the aphid room, January 25, 2015.) This news story is no longer available, and is not at the Internet archive. Its original URL was https://theaphidroom.wordpress.com/2015/01/25/transferring-primary-symbionts-a-missed-link/.
* Commentary accompanying the article: Interchangeable allies: Exploiting development and selection to swap symbionts. (N M Gerardo, PNAS 112:1923, February 17, 2015.)
* The article: Experimental replacement of an obligate insect symbiont. (N A Moran & Y Yun, PNAS 112:2093, February 17, 2015.)
More about aphids:
* Underground messaging between bean plants (July 29, 2013).
* Are aphids photosynthetic? (September 17, 2012).
* Red and green aphids (June 2, 2010).
More about bacterial symbionts:
* Can Wolbachia reduce transmission of mosquito-borne diseases? 1. Introduction and Zika virus (June 14, 2016).
* Origin of eukaryotic cells: a new hypothesis (February 24, 2015).
* A quasi-quiz: The fate of bone and wood on the Antarctic seafloor -- and the discovery of new bone-eating worms (August 20, 2013).
* A new organelle "in progress"? (September 13, 2010).
May 13, 2015
The artificial trees in the artificial forest are now fixing CO2 (and making high-value products) -- naturally
May 13, 2015
About two years ago Musings presented a new system for artificial photosynthesis developed in the lab of Peidong Yang and colleagues at UC Berkeley [link at the end]. By "artificial photosynthesis" we refer to a non-biological process for capturing solar energy and using it to make chemicals of interest. The process uses semi-conductors and nanowires, products of the chem lab. One important point was that the process was modular: they had solutions for parts of the photosynthesis problem, but one could see how these might interact with other modules -- or even be replaced by better modules for the current processes. What was cute about the process was that it looked like a system of artificial trees in an artificial forest -- at the micro scale. I encourage you to read that earlier post somewhere along the way here.
A new article reports new developments in the system: it now fixes CO2 and makes higher value products. And it does these things "naturally".
The following figure is the authors' summary of the process. It serves as an overview both of natural photosynthesis and their own work, previously and now. It suffers from some bad artwork with the lettering; that seems to be present in all versions of the figure I can find, even at the highest resolution. I'll fill in the text.
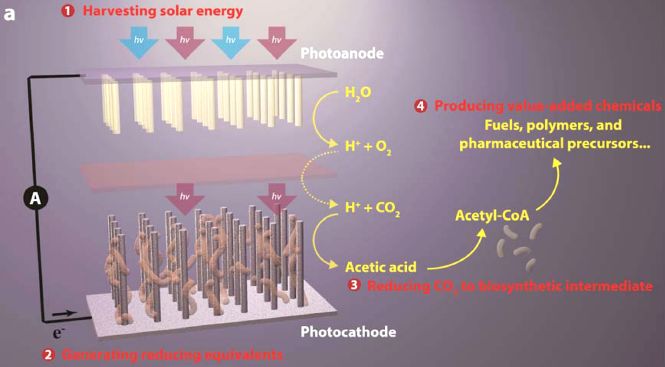
They divide the process of photosynthesis into four steps, highlighted with red lines of (almost unreadable) text in the figure.
Step 1, "Harvesting solar energy", is the use of light energy, shown here as hν, which represents the energy of one quantum of light. (The ν, "nu", is a common symbol for the light frequency, in cycles per second, or Hertz.)
This leads to splitting water into its elements. Water --> hydrogen + oxygen. The oxygen is a waste product in photosynthesis. The hydrogen is important, and you'll notice that they show the hydrogen separated into its parts. The hydrogen ion is shown along with the O2; the electron moves down through the apparatus via line A at the left.
Overall... 2 H2O --> 4 H+ + 4 e- + O2.
The electron is the key. This represents "reducing power" -- their step 2, "Generating reducing equivalents", in the figure; we'll see the importance of this as we go on.
In general terms, the steps above are part of biological photosynthesis (at least the common type, in cyanobacteria, algae and plants) as well as of the authors' artificial process.
In biological photosynthesis the electrons are used to reduce CO2 from the air, to sugar, which the plant uses for its substance. We call that "fixing" the CO2, meaning to convert it from a gas to a captured (fixed) form.
In common usage, the term photosynthesis is often used to refer to the use of light energy to fix CO2. But there are many steps, and at times it is important to think about them separately.
In the earlier version of the artificial forest system, the scientists were focusing on getting the first steps to occur. Splitting water is not easy! For the initial report, they took the easy way out after step 2: they used the electrons to reduce the hydrogen ions -- and make hydrogen gas. That H2 is indeed a useful product; it can be used as a fuel. However, many would argue that we can do better. H2 has limitations as a fuel. Further, fuel is a fairly low value product.
In the new work, the scientists go beyond making H2. The first new step is the key one: they make acetic acid (or "acetate"). That is their step 3, "Reducing CO2 to biosynthetic intermediate". They use the reducing power to reduce CO2 from the air (or, better, from flue gas, with a higher level of CO2) -- to acetate. That is, they have expanded their artificial photosynthesis system to fix CO2, and convert it into an organic molecule. By doing this, they have made their process more like the biological process; they happen to make a different organic molecule, but that's fine. Acetate is good, a normal part of all organisms.
Beyond that, they convert the acetate into various higher value products. That is step 4 in the figure, "Producing value-added chemicals".
This is Figure 1a from the article.
|
How do they get their system to make acetate -- and more? They add bacteria to it. That is, at this point, they make use of the natural ability of bacteria to fix CO2, given a boost from the electrons of the artificial photosynthesis system. Acetate is one simple product of this bacterial CO2 fixation. Then, to make the more complex products, they add more bacteria, which convert the acetate to more products.
The new process is a hybrid of chemistry and biology. The initial steps are artificial photosynthesis; the final steps use existing biological processes. Is that allowed? Is that good? The goal is to make a practical process; all options are allowed -- to compete. What they have shown here is that it is possible to make the two types of systems compatible, thus allowing for a hybrid system.
Caution... In the background post we noted that the process was not very efficient. That's still true. This is lab research, developing a new type of process. Substantial improvements in efficiency are needed to make it economical. The scientific progress is exciting (and fun); practical use is a way's off, if it comes at all.
News stories:
* UC Berkeley hybrid semiconductor nanowire-bacteria system for direct solar-powered production of chemicals from CO2 and water. (Green Car Congress, April 10, 2015.)
* Major Advance in Artificial Photosynthesis Poses Win/Win for the Environment -- Berkeley Lab Researchers Perform Solar-powered Green Chemistry with Captured CO2. (L Yarris, Lawrence Berkeley National Laboratory, April 16, 2015.) From the lead institution. (The scientists work jointly at the University of California Berkeley and Lawrence Berkeley National Laboratory, a common arrangement.)
The article: Nanowire-Bacteria Hybrids for Unassisted Solar Carbon Dioxide Fixation to Value-Added Chemicals. (C Liu et al, Nano Letters 15:3634, May 13, 2015.)
Background post about the system: An artificial forest with artificial trees (June 7, 2013). Includes pictures of both forest and trees.
Another follow-up: More from the artificial forest with artificial trees (August 31, 2015).
A recent post about bacteria using electrons from the outside: A battery for bacteria: How bacteria store electrons (May 2, 2015).
If you're into the waste product -- maybe even dependent on it... A whiff of oxygen three billion years ago? (April 6, 2015).
More about solar energy development: The energy landscape: looking ahead (August 16, 2015).
Next post on photosynthesis: Photosynthetic sea slugs; species vary (June 9, 2015).
There is more about energy on my page Internet Resources for Organic and Biochemistry under Energy resources. It includes a list of some related Musings posts.
Is the lychee (litchi) a toxic food?
May 11, 2015
The lychee is a subtropical tree; its fruit (or nut) is widely consumed. Yet, in some areas that grow lychee, large numbers of children get sick each year around the time of the lychee harvest; the fatality rate is around 30% (at least of those who get medical attention).
The symptoms start with convulsions, and often include extremely low blood sugar; the condition is referred to as a hypoglycemic encephalopathy.
What's going on? A series of articles over the last couple of years has led to a fairly strong hypothesis: lychee contains a poison -- similar to one found in some of its close relatives. The poison is not very potent, but children are susceptible, especially if they are otherwise malnourished.
This is an incomplete story. But it is strong enough and specific enough to lead to actions and further testing. One report has shown that giving an afflicted child intravenous sugar may be of benefit; see the MMWR article listed below. Questions remain. In addition to testing and extending the basic hypothesis... The role of fruit flesh vs seed is one issue. Both pesticides and viruses have been suggested as causal agents in other work, though no specifics were identified. Is there a role for either of these, perhaps in addition to the poison? There is reason to connect the outbreak in India, the focus here, with similar outbreaks in other lychee-growing countries, but, again, this needs to be confirmed.
There is nothing in this work that questions the ordinary consumption of lychee fruit. However, since the story is incomplete, we cannot exclude that more subtle or long term effects of ordinary consumption may be found at some point.
|
Here are the structures of the key chemicals suspected as neurotoxic from lychee (left) or ackee (right). (Stereochemistry not shown.)
|
I have named them as derivatives of standard amino acids. You can see that each contains the same unusual group, methylenecyclopropyl, attached to the terminal carbon of a standard amino acid. The only difference between the two is an extra C just before that group in the ackee poison; this reflects the difference between glycine and alanine.
These are my drawings, using the free chemical drawing program ChemSketch.
(If you would like to try ChemSketch, see my page ChemSketch - An Introductory Guide.)
|
News stories, primarily relating to article #1:
* A compound in litchi behind mystery brain disease? (N Gopal Raj, The Hindu, February 5, 2015.) Good overview.
* Litchi Toxin May Give Rise to Mysterious Epidemic in India. (Tropical Fruit Forum, International Tropical Fruit Growers, January 30, 2015.)
Two recent articles, both freely available:
1) Outbreaks of Unexplained Neurologic Illness -- Muzaffarpur, India, 2013-2014. (A Shrivastava et al, Morbidity and Mortality Weekly Report (MMWR) 64:49, January 30, 2015.) A report from two hospitals in a lychee-growing region. Among other things, the article notes a somewhat lower death rate in the second year, when they immediately treated the hypoglycemia. This was not a controlled trial, and the significance of the finding is uncertain.
2) Probable Toxic Cause for Suspected Lychee-Linked Viral Encephalitis. (P S Spencer et al, Emerging Infectious Diseases 21:904, May 2015.) A half-page note suggesting a connection between the lychee disease and a disease caused by eating ackee fruit. (Their reference #6 is the article I list above as #1.)
Recent posts about food poisoning include:
* Fugu poisoning incident in the United States (January 5, 2015). This also involves a poison that is endogenous to the food.
* Food poisoning outbreak: Listeria infections from caramel apples and fresh apples (January 14, 2015). This involves a food contamination issue.
More fruit... Why does a durian smell so bad? (February 14, 2017).
Another story about a neurotoxic amino acid derivative... How BMAA may cause motor neuron disease -- a clue? (July 1, 2014). There is no connection between these stories, and no implication that the toxic amino acids work the same way.
Another toxin: A new botulinum toxin -- and a story of how we deal with dangerous things (July 11, 2015).
Also see: Killer chickens (December 2, 2009). This is an early post about one food issue; it now includes links to a wide range of posts about food poisoning.
My page Internet resources: Biology - Miscellaneous contains a section on Nutrition; Food safety. It includes a list of relevant Musings posts.
Xystocheir bistipita is really a Motyxia: significance for understanding bioluminescence
May 9, 2015
Scientists recently re-discovered a long-lost species of millipede in the California foothills. Examination of it has led to some interesting developments.
Let's start with some data...
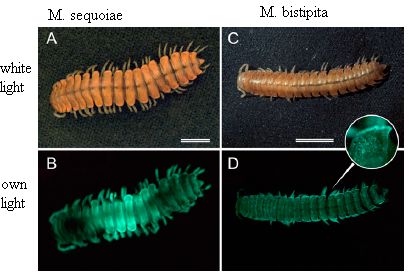
|
The figure shows two species of millipede, labeled at the top.
The top row shows photographs of the animals taken with ordinary lighting.
The bottom row shows photographs of the same animals taken in the dark. The only light is from the animals themselves.
|
You can see that both animals produce light. The inset for frame D (lower right) is a close-up of part of that animal, for emphasis.
This is Figure 1 from the article. I have added the labels at top and left. The scale bars are 5 millimeters.
|
What do we do with this information? The first issue deals with the identification of the animal at the right. It's quite rare; the recent finding was the first in decades. This animal was not known to be bioluminescent; it had been classified as Xystocheir bistipita. Now, knowing it is luminescent, the scientists have reclassified it as Motyxia bistipita, putting it with other luminescent millipedes.
More importantly, the scientists did some gene analyses of the available species of Motyxia, as well as some related non-luminescent species. By examining the sequences of the same genes over many species, they reconstructed a genealogy -- the most likely order in which the species developed. They found that the brightness of the luminescence generally increased during evolutionary history. The current species, now called Motyxia bistipita, is both the dimmest and the oldest Motyxia.
What does that mean? The common view has been that luminescence in millipedes is a defense mechanism. These animals are poisonous; the light they emit warns predators to avoid a toxic meal. But perhaps this was not the original role of bioluminescence. The scientists suggest that the luminescence was originally part of a response to stress -- perhaps heat stress in the hot mountains. The stress resulted in free radicals; proteins designed to protect against free radicals happened to be luminescent. That is, the protein was primarily an anti-oxidant; luminescence was a side effect. The development of the luminescence as a predator defense came later, building on the low level of luminescence already present for another reason.
It's an interesting model. It illustrates how a gene originally playing one role can get co-opted for another. So far as I can tell, the model is basically just that at this point; there is little evidence for it, beyond finding the general trend that the level of luminescence has increased in younger species. It will be interesting to see how this story develops. Are there alternative models that would fit the data? Is it possible to test the model or any alternative models? In any case, we know a little more about luminescent millipedes than we did.
News stories:
* Researchers shine light on origin of bioluminescence. (Phys.org, May 4, 2015.)
* New Glowing Millipede Found; Shows How Bioluminescence Evolved -- Some California millipedes first evolved bioluminescence to cope with harsh desert living, according to scientists who may have cracked the mystery of glowing millipedes. (C Arnold, National Geographic, May 4, 2015. Now archived. ) Includes some nice video. However, the story incorrectly identifies the source of the millipedes. They are not from the Sierra Nevada range, but from the coastal range, near San Luis Obispo.
The article, which is freely available: Discovery of a glowing millipede in California and the gradual evolution of bioluminescence in Diplopoda. (P E Marek and W Moore, PNAS 112:6419, May 19, 2015.)
The discussion of the role of bioluminescence here is for this group of millipedes. Don't extend it to any other groups of bioluminescent organisms. Bioluminescence plays different roles for different organisms.
More about bioluminescence:
* Milky seas: now observable from space (September 27, 2021).
* Observing inside animals with an improved bioluminescence system (April 6, 2018).
* Lux aeterna: Mushrooms; Mozart (December 7, 2009). Note a follow-up post listed there.
There is a section of my page Internet resources: Chemistry - Miscellaneous on Chemiluminescence.
Also see... Unusual synthesis of cadmium telluride quantum dots (February 15, 2013).
There is more about genomes on my page Biotechnology in the News (BITN) - DNA and the genome. It includes an extensive list of Musings posts on the topics.
Hybrid formation between organisms that diverged 60 million years ago
May 8, 2015
Do you think that humans and lemurs could form a hybrid? That seems preposterous. But a new article reports what appears to be an example of two organisms that diverged about the same time doing exactly that.
The evidence? It's shown at the right: a fern, in nature, that seems to be a hybrid of two types of fern that diverged 60 million years ago.
This is reduced from the figure in the news story listed below.
|

|
How do we know it is a hybrid? The original observation was that it looked like a hybrid of two known ferns. Now, scientists have analyzed the DNA of the newly discovered fern, and shown that it consists of genes from those two other fern species. They estimate that those parent ferns diverged 60 million years ago. More specifically... The scientists analyzed one particular region of the genome in detail. They found four copies of the region, indicating that the new fern is tetraploid. Two of those copies correspond very closely to what is found in one of the suspected parents; the other two copies correspond to the other parent. The copies are so close to those of the parents that the scientists believe the hybrid formation was quite recent; there has been little time for the hybrid to diverge from its parent species.
The hybrid fern grows fine, and can be propagated by rhizomes (or "cuttings"), as often true for plants, simple or complex. It seems to be a sterile hybrid, not capable of sexual reproduction. That shows there is a barrier between the two species that hybridized. Nevertheless, it is remarkable that a viable hybrid can form at all.
What does this mean? Is it just that ferns, a very old group, evolve more slowly? The authors suggest that it might have something to do with them being fertilized passively, by the wind. That is, they lack much of the specialization of reproductive organs found in many organisms; maybe this allows them to remain partially compatible over longer time. It will be interesting to see what more can be learned by studying this fern, or by using it as a clue for further work on how species become distinct.
The way the hybrid is named is interesting. The hybrid is called ×Cystocarpium roskamianum. The first character of the name is a times sign, which denotes a hybrid. The parents are ferns of the genera Cystopteris and Gymnocarpium.
News story: Distant species produce 'love child' fern after 60-million-year breakup. (Science Daily, February 13, 2015.)
The article: Natural Hybridization between Genera That Diverged from Each Other Approximately 60 Million Years Ago. (C J Rothfels et al, American Naturalist 185:433, March 2015.) Check Google Scholar for a pdf copy from the authors.
Previous post about ferns: Chromosomes -- 180 million years old? (April 18, 2014). Interestingly, this post makes a point somewhat similar to the current post: that ferns haven't changed much over tens of millions of years. The evidence is completely different.
* A recent post about hybrid formation in nature... What if two of the world's most destructive pests spent the evening together in Fort Lauderdale? (April 4, 2015).
* Also see... Development of a new species of lizard in the lab (May 20, 2011).
There is more about genomes on my page Biotechnology in the News (BITN) - DNA and the genome. It includes an extensive list of Musings posts on the topics.
If you have forgotten what a lemur is...
* Underground hibernation in primates? (October 6, 2013).
* and maybe... Quiz: What's the connection... (February 14, 2012).
May 6, 2015
Offering the monarch butterflies milkweed may not be good for them
May 5, 2015
Monarch butterflies are beautiful, and they have a fascinating life cycle. They migrate long distances, with each migration actually involving multiple generations of animals.
Some populations of monarchs are in serious decline. One factor may be the loss of their special food: milkweed. This was discussed in an earlier post [link at the end]. If that is true, then maybe it would be good to plant more milkweed, to attract the monarchs.
A new article raises a concern about that suggestion. It's an interesting story, perhaps less complete than the news coverage might suggest.
The following figure summarizes a key finding. It shows the level of parasite infection of various populations of monarch butterflies from the eastern United States.
|
The figure shows the results for four populations (x-axis), with data for two years for each population. The y-axis shows the fraction of the population that is "heavily infected" with a particular parasite of concern.
The striking observation is that the right-hand bars are very high. It will serve our purposes here to simply separate the results into two groups: the high bars of the right-hand population, and all the others, which are low.
This is Figure 2 from the article.
|
What is special about the high-bar population? It is a population of monarchs that does not migrate, but rather stays in the southern US year-round; it is labeled "winter-breeding". Why don't they migrate? Apparently because they have plenty of food where they are. Plenty of milkweed.
The other three sets are for monarchs that are migratory. (Don't try to make sense of the labels without reading the article for details.)
One interesting comparison is between the populations labeled "coastal overwintering" and "winter-breeding". These are populations from about the same area of the southern US. The former is from a migrating population; the latter is from a non-migrating population. The latter, the non-migrating population, has a much higher parasite load.
Here is the issue... The monarchs that do not migrate have more parasites; that is the basic observation. Why don't they migrate? Because they have plenty of food where they are. Why do they have more food? Apparently because they are in areas where is a type of milkweed that grows year-round.
And here is the concern... If people plant milkweed, they are likely to plant the type that grows year-round. That is not the type that grows wild in the east. The monarchs will eat it just fine. They'll eat it year-round -- instead of migrating, and that may not be good for their health. Migration helps to reduce the parasite load.
That's the argument. The results certainly are interesting, and there is logic to the argument. However, it is not clear that all the points are causally connected. It would be nice to see some follow-up, directly comparing the behavior -- and parasite load -- of monarchs offered year-round and summer-only milkweed. As the authors note, simply cutting back the year-round milkweed during the winter may serve the purpose.
In the meantime, if you want to feed the monarchs, don't over-do it.
News story: Plan to save monarch butterflies backfires. (L Wade, Science, January 13, 2015.) Good overview. As the picture suggests, the infection discussed here starts with the larval stage of the butterfly eating the milkweed.
The article: Loss of migratory behaviour increases infection risk for a butterfly host. (D A Satterfield et al, Proceedings of the Royal Society B 282:20141734, February 22, 2015.) Check Google Scholar for a copy.
Background post on monarch butterflies: Genetically modified crops and the fate of the monarch butterfly (April 1, 2012). Includes a picture, with links to more -- and to a site about a California population of the monarchs.
More about migrations: Magnetic turtles (July 5, 2015).
Also see: Which came first: butterflies or flowers? (March 9, 2018).
CRISPR and editing of the human germline: the ethical line?
May 4, 2015
A new article about CRISPR -- and controversy.
There are two parts to the story here. One is the science reported in the article. The other is the controversy -- the ethical questions it forced to the forefront. The article was not unexpected; there had been fairly specific rumors for some months. The ethical questions, too, are not unexpected; what's new is that they can no longer be left for the future.
CRISPR, something of an adaptive immune system of bacteria, has been developed into a tool that allows scientists to edit a piece of DNA. That opens the possibility of using CRISPR to do gene therapy: correcting an error in a person's genome. In general, editing an error in a person's genome may be therapeutic (of medical value to the person), but does not lead to a heritable change. That is, the person whose gene has been fixed does not transmit the fix to his or her offspring, because the change was only in somatic cells (body cells), not in the germline (reproductive) cells.
In the new work, scientists tried to edit the human germline. They tried to fix a genetic error at the stage of an early (single cell) embryo. If this were successful, it would open the possibility of making heritable changes in the human genome.
And that's a line we are not supposed to cross, according to many, both in and out of the scientific community. Altering the human germline is contrary to law or policy in many countries.
Rogue scientists? Not really. Read the ethics statement of their article (page 8 of the pdf file). They complied with the regulations of their country, and with external regulations as they understood them. Further, the work they did could not result in a permanent change in the human germline, because of various precautions in their protocol.
So they tried to edit the human genome. How did it go? Not very well. (If you want details, see the article, which is freely available. The abstract will give you the highlights.) But that's not the main point, which is to use this article as a wake-up call: the issues raised are important, and should be the subject of continuing public debate.
A caution... Resist the easy path that leads to quick conclusions about difficult things we don't understand. In fact, no one knows how to effectively edit the human germline at this point. In that case, it is easy to conclude one shouldn't do it. But that's not the real question. How do we want research to proceed in this area? With what safeguards? At what point might it be proper to consider such experimentation -- in lab work or in real humans, with their informed consent? Oh, how do we regulate such things on an international basis?
News story: Chinese scientists genetically modify human embryos. Rumours of germline modification prove true - and look set to reignite an ethical debate. (D Cyranoski & S Reardon, Nature News, April 22, 2015.) A good introduction to the issue. The "references" list at the end links to three items. #1 is the article. The other two are recent commentaries by scientists about the issue; they were written in anticipation of the new article. (The first two are freely available. If you can't access #3, put the title into Google Scholar, and you should find a freely available preprint.)
The article, which is freely available: CRISPR/Cas9-mediated gene editing in human tripronuclear zygotes. (P Liang et al, Protein & Cell 6:363, published online April 18, 2015.)
Recent posts about CRISPR:
* CRISPR: an overview (February 15, 2015). Includes a list of Musings post on CRISPR, which I will try to keep complete.
* A step towards correcting mutant genes with CRISPR (October 7, 2014). Work on correcting a gene -- the same gene as used in the present study, β-hemoglobin, which is mutated in the disease β-thalassemia.
Another, perhaps related, ethical question... As we add human cells to the mouse brain, at what point ... (August 3, 2015).
My page for Biotechnology in the News (BITN) -- Other topics includes a section on Ethical and social issues; the nature of science.
More about gene therapy is on my BITN page Agricultural biotechnology (GM foods) and Gene therapy. Both this and the above BITN item include listings of related Musings posts.
Claim of oldest fossilized cells refuted
May 3, 2015
Here are two sets of figures from a new article. Each set contains three photos of mineral materials, taken by light microscopy. Do you think these are samples of fossils from living organisms? (The three photos in each set go together.)
|
Figure 3, parts x, y & z.
|
Figure 5, parts b, c & d.
|
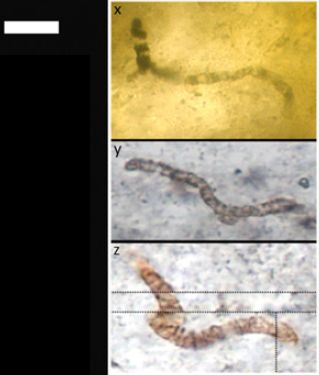
|
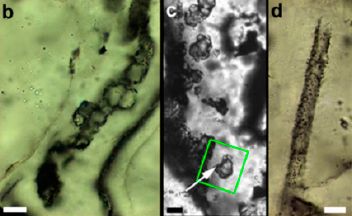
|
↑ Above (Fig 5):
Scale bars (bottom, left or right) are all 10 micrometers.
← Left (Fig 3):
There is a single scale bar, to the left of the top frame, in white. It is 14 µm in frame x, and 10 µm in y and z.
Don't worry about the bewildering array of scale bars. Size per se is not an issue here.
|
Intriguing, aren't they?
Some people see signs of biology in them. They do look something like modern cyanobacteria. Scientists have been arguing about the nature of these samples for years. The stakes are high: if they are from living organisms, they would be evidence for some of the earliest forms of life on Earth. These samples are about 3 1/2 billion years old.
The article examines them more closely than ever before, with the latest technology -- and more information about their context. The conclusion? The one on the left (Figure 3) is not biological, but the one on the right (Figure 5) is. That distinction is important, because Figure 3 is the older material; in fact, it has been claimed to represent the oldest known cells. It was a controversial claim; the authors here suggest it should be discarded. In terms of the timeline of life, it doesn't make much difference: the samples in Figure 5 are almost as old -- only 30 million years younger.
The big message here is the difficulty of telling for sure which ancient samples are biological and which are not. Not only does our casual inspection of the figures above leave the question open, but so does much of the technical analysis. The authors of the new work suggest they have improved methods, and that they can tell. We'll see how well their claim stands up.
What did they do? It's not easy to explain concisely. They used electron microscopy, and looked at the fine details around what appeared to be the cell wall structure. It just didn't look "right" for the samples of Figure 3 -- didn't look like authentic biological material.
But as I hinted above, context was a big clue. Further examination of the Fig 3 materials has suggested they are of high temperature origin. That raised suspicion and led to the more careful analysis. The authors found the differences in detail, and suggest a model for how the cell-like structures arose from flow of hot fluids.
News stories:
* Oldest fossils controversy resolved. (Science Daily, April 20, 2015.)
* Early life hunt inspired by oldest fossils debate. (Oxford University, April 20, 2015.) From the lead institution.
The article: Changing the picture of Earth's earliest fossils (3.5-1.9 Ga) with new approaches and new discoveries. (M D Brasier et al, PNAS 112:4859, April 21, 2015.)
Posts about other old fossils and such include:
* A 1.6 billion-year-old macroscopic multicellular eukaryote? (June 13, 2016).
* Quiz: What is it? (September 23, 2014). The first animals, from around 600 million years ago. The featured specimen is actually a living animal, but the post compares it with early fossils.
* Fossil raindrops and the density of the ancient atmosphere (May 6, 2012). (And post immediately following it.) 2.7 billion years old.
* The earliest biomineralization? (January 24, 2012). Skeletons, 750 million years old.
* The Antikythera device: a 2000-year-old computer (August 31, 2011).
* The oldest known multicellular organisms? (August 21, 2010). 2.1 billion years old.
More about cyanobacteria: A whiff of oxygen three billion years ago? (April 6, 2015).
A battery for bacteria: How bacteria store electrons
May 2, 2015
Let's jump in and look at some results. The experiment involves measuring the number of electrons stored in a rock.
|
In this experiment, two types of bacteria were grown together, with some magnetite, Fe3O4.
The growth conditions were switched between light and dark at various times, indicated by the vertical dashed lines. The light and dark growth periods are labeled by the sun and crescent moon, respectively.
|
The scientists measured the number of electrons in the magnetite. They did this, indirectly, by measuring a property called the magnetic susceptibility, κ (kappa). The graph shows κ on the y-axis; more precisely, it shows Δκ (delta kappa), the change in that property, in percent. You can think of that as a measure of the number of electrons; we'll explain this a little more below.
Observe... During the first growth period, in light, κ decreases. It then increases during the next growth period, which is in the dark. That pattern is repeated: κ decreases in each growth period in the light, and increases in each growth period in the dark. It works over the 240 hours (10 days) of the experiment.
This is Figure 2B from the article.
|
What's going on?
1) One type of bacteria used here produces excess electrons; they are shunted into the magnetite, reducing Fe3+ to Fe2+.
2) The other type of bacteria used here takes electrons from the magnetite, oxidizing Fe2+ to Fe3+.
The value of κ reflects the two forms of iron ion. More specifically, κ effectively measures Fe2+. Thus the oxidation step (#2), which removes electrons and lowers the amount of Fe2+, lowers κ -- and vice versa.
The bacteria of step 1 are iron-reducing bacteria; they reduce the Fe3+ to Fe2+. The bacteria of step 2 are photosynthetic; they are using the light energy to fuel their growth. They also need electrons, and they get electrons they need from the magnetite.
Overall, the magnetite is effectively serving as a battery, being charged by one type of bacteria during the "night", and discharged by the other during the "day". All the steps here were known; what is new is showing that they can be coupled together, leading to measurable cyclic changes in the electron status of the rock as the environment changes.
This is in the lab under controlled conditions. I wonder what's going on in nature.
The bacteria are Geobacter sulfurreducens and Rhodopseudomonas palustris, respectively.
Magnetite is a common mineral; it contains iron in both the 2+ and 3+ forms. The work here was done with pure synthetic magnetite, in a very fine particulate form.
News story: Bacteria can use magnetic particles to create a 'natural battery'. (Science Daily, March 26, 2015.)
The article: Redox cycling of Fe(II) and Fe(III) in magnetite by Fe-metabolizing bacteria. (J M Byrne et al, Science 347:1473, March 27, 2015.)
On related bacterial tricks...
* On sharing electrons (May 3, 2011). This case may involve direct transfer of electrons from one organism to another; in contrast, the current post involves storing the electrons.
* On sharing electrons -- II (June 9, 2013). A discussion.
More on magnetite... Magnetic field perception (June 16, 2010).
Posts on batteries include...
* Making lithium-ion batteries more elastic (October 10, 2017).
* Flow battery (January 4, 2016).
* Boiled batteries (July 19, 2010).
Also see...
* How seismic waves travel through the Earth: effect of redox state (June 8, 2018).
* The artificial trees in the artificial forest are now fixing CO2 (and making high-value products) -- naturally (May 13, 2015).
There is more about energy on my page of Internet Resources for Organic and Biochemistry - Energy resources.
Top of page
The main page for current items is Musings.
The first archive page is Musings Archive.
E-mail announcements -- information and sign-up: e-mail announcements. The list is being used only occasionally.
Contact information
Site home page
Last update: June 2, 2026