| Sawfish. With the characteristic "saw" -- the elongated snout (or "rostrum"), which includes teeth. The saw can be a meter or so long in the adults of some species. |
Musings is an informal newsletter mainly highlighting recent science. It is intended as both fun and instructive. Items are posted a few times each week. See the Introduction, listed below, for more information.
If you got here from a search engine... Do a simple text search of this page to find your topic. Searches for a single word (or root) are most likely to work.
Introduction (separate page).
This page:
2012 (January-April)
April 30
April 25
April 18
April 11
April 4
March 28
March 21
March 14
March 7
February 29
February 22
February 15
February 8
February 1
January 25
January 18
January 11
January 4
Also see the complete listing of Musings pages, immediately below.
All pages:
Most recent posts
2026
2025
2024
2023:
January-April
May-December
2022:
January-April
May-August
September-December
2021:
January-April
May-August
September-December
2020:
January-April
May-August
September-December
2019:
January-April
May-August
September-December
2018:
January-April
May-August
September-December
2017:
January-April
May-August
September-December
2016:
January-April
May-August
September-December
2015:
January-April
May-August
September-December
2014:
January-April
May-August
September-December
2013:
January-April
May-August
September-December
2012:
January-April: this page, see detail above
May-August
September-December
2011:
January-April
May-August
September-December
2010:
January-June
July-December
2009
2008
Links to external sites will open in a new window.
Archive items may be edited, to condense them a bit or to update links. Some links may require a subscription for full access, but I try to provide at least one useful open source for most items.
Please let me know of any broken links you find -- on my Musings pages or any of my web pages. Personal reports are often the first way I find out about such a problem.
April 29, 2012
A new company, Planetary Resources, is being formed with the goal of mining asteroids for precious metals. It's an interesting idea. Surely the common wisdom is that this is unlikely to be an economical activity. However, sometimes those who challenge the common wisdom are right -- and we all benefit. Perhaps it is high risk, but taking risks is an established part of making progress. What lends this some credibility is the cast of characters. They have people who know what the challenge is -- and that includes the economics. They have decided there is something here worth a try. Let's wish them luck, and sit back and see what happens.
I learned about this from the following news story, which is a quite good overview of the challenge. Give it a try! Tech Billionaires Plan Audacious Mission to Mine Asteroids. (Wired, April 23, 2012.) This page links to the company page. There is not much detail there, but if you look around you will get some idea of their plans.
More about asteroids...
* NEOShield: defense against Earth being hit by an asteroid (February 6, 2012).
* Lutetia: a primordial planetesimal? (February 13, 2012).
April 27, 2012
|
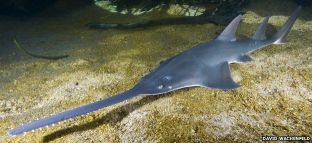
| Sawfish. With the characteristic "saw" -- the elongated snout (or "rostrum"), which includes teeth. The saw can be a meter or so long in the adults of some species. |
So what is that thing for? Fishes with somewhat similar appendages have been shown to use them either as sensory organs or as manipulative organs. Now, a team of scientists in Australia has shown that the sawfish use their saw for both purposes. How did they discover that? They watched. That's a big deal with sawfish, and the authors deserve credit simply for carrying out the observations. What they did was to put newly caught sawfish in a lab tank, and record on video what the fish did. By using newly caught fish, they hope that the observed behavior is "natural", rather than lab adaptation. They provided various experimental stimuli, such as food and electrical stimuli intended to mimic prey. They then carefully analyzed the videos, cataloging the fish movements and reactions to stimuli.
The scientists observed that the sawfish used the saw to prod or move prey, and even to cut it. (What the sawfish does not do, it seems, is to saw.) They also observed that the fish responded to electrical signals that might be indicative of prey. Since electrical sensors had been found on the saw, this was not entirely a surprise.
Movies. There are two movie files that accompany the paper. They are about a minute each, and offer a rare glimpse of an unusual animal. You can get them by going to the article site (below), and choosing Supplemental Information. One or the other is included with the news stories. You can also get them from YouTube:
* Movie S1. This movie shows four examples of how the sawfish uses its saw to manipulate prey. On-screen labeling introduces the four parts. You may need to watch some of them more than once to be sure what is going on. The operation "turn fish" is interesting. If you are going to swallow a fish whole, it is better to do it head first -- corresponding to the natural motion of the fish. Even if it is not actively swimming, the fish body plan makes it go down better if taken in forward.
* Movie S2. Thr first part of this movie shows a sawfish scraping its saw against the bottom; the function of this maneuver is unknown, but they suggest the fish may be sharpening its teeth. The later parts of this movie involve the response of the sawfish to an electric dipole. One of these parts is rather unclear (to me), but in the final part, you can see the two bluish rods that are the dipole. The use of the dipole is intended to simulate the electrical signals that might be received from prey.
News stories:
* Sawfish snout senses, swipes and stabs. (BBC, March 5, 2012.) The picture shown above is reduced from one in this news story. This includes Movie S2.
* How the sawfish wields its saw... like a swordsman. (E Yong, Not Exactly Rocket Science (Discover blog), March 5, 2012.)
The article: The function of the sawfish's saw. (B E Wueringer et al, Current Biology 22:R150, March 6, 2012.)
More about fish...
* Helicoprion -- a fish with 117 teeth, arranged in a spiral (March 9, 2013).
* Fish with bigger brains may be smarter, but ... (January 25, 2013).
* Tracking illegal fish (June 15, 2012).
April 24, 2012

|
Seems like a good idea.
News story: With 'Bicycle School Bus', Dutch Kids Pedal Their Bus To School. (Design Taxi, March 12, 2012. Now archived.) This page links to the web site of the manufacturer; that page is in Dutch, but there are some good pictures. [Link to company site does not work from the archived file. Here is the direct, live link, with the new company name: company site.] The picture is reduced from one in the news story -- which also includes a view of the empty bus, so you can see more about its design. |
More on bicycles: A simpler bicycle (May 23, 2011).
More on renewable energy: Plants need bacteria, too (October 9, 2010).
April 23, 2012
We have had a couple of posts noting that rice concentrates arsenic (As), and is a potential dietary source of that poison. (Links at the end.) Some estimates suggested that rice might provide a significant amount of arsenic for those who consume very large amounts of rice; however, for the most part the effects seemed likely to be small. That is, the main point was to recognize the issue. That might lead to considering regulatory measures, including labeling.
Once we established the point that rice might be a source of As, I was willing to drop the subject. After all, it seemed that it was likely to be a significant problem only in some special cases: those who eat large amounts of rice, or eat pure rice bran -- where the As is largely found. However, a new "special case" has come up, one that is potentially more serious: feeding a rice product that concentrates the As to babies.
The focus is on something called organic brown rice syrup (OBRS). This is a commercial product, intended to be used as a sweetener. It's marketed as "organic", carrying the connotation to some that it is healthful. However, it turns out that the process of making OBRS does a good job of extracting the arsenic into the syrup. So, if the rice has high As, so does the OBRS made from it. OBRS is used in various products -- most notably baby formula. A new paper examines the level of As in baby formulas made with OBRS.
|
Here is an example of what they found. This is Figure 1A from the article.
The bars show the amount of arsenic in baby formula made by five different recipes. The bar at the left is the control formula, with no rice syrup. The other four bars are for formula made using various products that include OBRS. (A and B represent two lots of the same product.) For reference, the horizontal line, at 10 µg/L, shows the level of As allowed in drinking water by current WHO recommendations and US EPA regulation. You can see that all four samples that include the rice syrup have high levels of As, exceeding the allowed level. The figure also shows the form of the As in the samples. The two forms they measure are "inorganic As" and "DMA". Inorganic As is mainly arsenate, the more toxic form of As. DMA is dimethylarsenate. |
The use of such high As formula products is doubly bad. First, babies may consume largely a single food. Second, they are generally considered more vulnerable.
OBRS is also used in making some cereal bars and other energy products. The paper examines the level of As in some of these products. It's higher in products containing OBRS (or other rice-based ingredients). I'll let the adults who might consume such products read that part of the story for themselves.
Previous work has shown that the amount of As in rice varies, depending on where the rice is grown and on the type of rice. Thus the results here are simply examples. The authors' main conclusion is that As in rice and rice products should be measured; that would allow the development of regulatory standards. That is, the main point of the work here is to put the problem on the table.
With the usual disclaimer that I do not give medical or nutritional advice... It does seem reasonable to watch labels for this rice syrup product, and to minimize its use -- especially for children.
News story: Organic Food Sweetener May Be a Hidden Source of Dietary Arsenic. (Science Daily, February 16, 2012.)
The article, freely available via PubMed Central: Arsenic, Organic Foods, and Brown Rice Syrup. (B P Jackson et al, Environmental Health Perspectives 120:623, May 2012.)
The authors have prepared a short FAQ on the subject of rice syrup, especially in the context of children. It is noted in the paper and at the journal site. It [was] available directly at: http://www.dartmouth.edu/~toxmetal/assets/pdf/arsenicinfoodfaq.pdf. Update... See below.
That FAQ is no longer available at that address.
* An archived copy of the original FAQ is at: FAQ Responses Regarding Arsenic in Food Containing Organic Brown Rice Syrup. (pdf file)
* Perhaps more importantly, the authors have an expanded web site, which they update. One key page is: Arsenic. It is part of the Dartmouth Toxic Metals site.Previous posts on rice and arsenic:
* What color is your rice? Rice, diabetes, and arsenic. (December 12, 2010).
* Rice and arsenic: a follow-up (January 8, 2012).More on sweeteners...
* Artificial sweeteners: Saccharin and high blood sugar levels (December 7, 2014).
* Fructose; soft drinks vs fruit juices (November 7, 2010).More rice: How rice recognizes a Xoo infection (August 28, 2015).
More about arsenic...
* Humans resistant to arsenic? (June 16, 2015).
* A practical system for removing arsenic from water (March 21, 2014).My page Internet resources: Biology - Miscellaneous contains a section on Nutrition; Food safety.
April 22, 2012
No, putting flu viruses in a disinfectant is not a good idea. But think about... The purpose of a disinfectant is to kill bacteria on surfaces (in a hospital, for example). How about some viruses that would infect bacteria? Maybe viruses that are targeted to certain bacteria that are particularly important -- such as drug-resistant bacteria. That's the idea behind a recent paper, and the authors show that it works, at least "in principle".
Viruses that infect bacteria are called bacteriophages (literally, eaters of bacteria) -- or simply phages.
A reminder... viruses do not necessarily kill the host they infect. Some viruses install themselves within the infected cell -- where they can modify the host cell. That is the kind of viral behavior relevant here.
To test the idea, they chose a simple model system. They used common Escherichia coli (E coli) bacteria -- a strain resistant to the antibiotic streptomycin. They know why it is resistant, and they design the phage to carry a copy of the original antibiotic-sensitive version of the gene. (Actually, they give the phage two copies of the gene.) They know that sensitivity is dominant to resistance for this case; that is, if both sensitive and resistant alleles (forms of the gene) are present, sensitive "wins". As a result, infection of the antibiotic-resistant bacteria with the phage should make it antibiotic sensitive.
Here is an example of their results testing this idea...
| There are several pairs of columns, with each pair labeled 1 and 4. Strain 4 is their test strain, infected with the phage; strain 1 is the control. (The control is actually infected with a phage -- but one that does not carry the helpful gene.) Each pair of columns is for a particular level of streptomycin, as labeled across the top. Each column has four dots; if you can see the dot, that means bacteria grew; if the dot is gone, the bacteria did not grow. (One can try to judge the amount of growth, but that really is unnecessary. Just "grow" vs "no grow" is fine.) |
|
The first pair of columns is for drug level 0 -- no drug. You can see that there are four growth spots for each strain; that is, both strains grew fine under these conditions -- as you would expect. Now look at the next pair of columns, with drug at 1.56 µg/mL. Strain 1 still grew; strain 4 did not. That's the key result. Strain 1 -- the control, resistant to the drug -- grew. Strain 4 -- with the phage designed to promote sensitivity -- was indeed sensitive (failed to grow). That is, the phage worked to make the bacteria sensitive to the drug. What about the rest of the data? They are for higher drug concentrations -- and they all show the same thing. Strain 1 grew at all levels tested here. In fact, in another test (shown in part A of the figure), it grew even at drug level 100 µg/mL, but it did not grow well at 200. This is Figure 4 part B from the article. | |
That's the idea -- the proof of principle. They have engineered a phage to convert drug-resistant bacteria to drug sensitivity. That's good. (And they have another little trick, to reduce the numbers of drug-resistant bacteria that survive.) That's as far as they have gone. They envision that such a phage could be added to a disinfectant solution, and sprayed on surfaces; the phage part of the disinfectant would convert sensitive bacteria to resistant. They have not tested this application.
It's clever. Is it practical? I don't know. It seems to work, as far as they have tested it. An obvious limitation is that a phage would have to be engineered for each specific type of drug-resistant bacteria they want to deal with. That's not necessarily a serious barrier to using the method; in fact, some might suggest that its specificity is good. Further, the method will only work for certain kinds of drug resistance. And it's not at all obvious how the bacteria will respond over the longer term to this attack on them. Further work can explore these issues.
News stories:
* Beating Superbugs With a High-Tech Cleanser. (Science Daily, December 9, 2011.)
* How to Reform a Resistant Bacterium. (M Youle, Small Things Considered, March 5, 2012. Now archived.) From the ASM Microbiology blog. This is a fairly detailed yet very readable discussion of both the logic and findings. It also includes some of the issues that might stand between these research findings and practical use. And it has a cute cartoon.
The article: Reversing Bacterial Resistance to Antibiotics by Phage-Mediated Delivery of Dominant Sensitive Genes. (R Edgar et al, Applied and Environmental Microbiology 78:744, February 2012.)
More about antibiotic resistance... Restricting excessive use of antibiotics on the farm -- follow-up #2 (April 16, 2012)
More about phage: A virus that could treat acne? (October 21, 2012)
More about aminoglycoside antibiotics: Designing a less toxic form of an antibiotic (April 19, 2015).
More on antibiotics is on my page Biotechnology in the News (BITN) -- Other topics under Antibiotics.
April 20, 2012
Pertussis (commonly known as whooping cough) is an infectious disease, caused by the bacterium Bordetella pertussis. It is particularly serious for young children, in whom there is a significant death rate. Although the disease tends to be mild in healthy older people, infections of those people can serve to transmit the disease to vulnerable children.
A major control method for whooping cough is vaccination, starting only weeks after birth. The modern whooping cough vaccine contains 3-5 specific components of the bacteria.
Some places have recently experienced sharp rises in the incidence of whooping cough, including increased deaths of children. The reasons for this are not entirely clear, and there may be multiple reasons. Lower rates of vaccination may be contributing in some places. (California has had a recent surge in whooping cough; as a result, new vaccination mandates have been instituted.)
A new paper discusses an epidemic of whooping cough in Australia -- and concludes that a new strain is emerging. The vaccine is relatively ineffective against this new strain. What makes this particularly interesting is that it follows from the nature of the vaccine. Old vaccines were based on whole organisms; the vaccine contained many active antigens, and the likelihood of mutants arising that could avoid the vaccine was low. On the other hand, such vaccines, with many components, were prone to side effects. Newer vaccines, with a small number of specific components, have fewer side effects, but also make it more likely that mutants can arise that will avoid the vaccine. That may well be what is happening in this case. If so, it is an easy enough problem to solve (at least in principle): just adjust the vaccine from time to time to make sure it is directed against current strains. This is the approach already taken for flu vaccines.
This paper may serve to alert us to a general problem of using "cleaner" vaccines (vaccines against specific parts of the infectious agent).
News story: Sharp Rise in Cases of New Strain of Whooping Cough in Australia. (Science Daily, March 21, 2012.) This is a good overview not just of this case, but of the general issues.
The article: Newly Emerging Clones of Bordetella pertussis Carrying prn2 and ptxP3 Alleles Implicated in Australian Pertussis Epidemic in 2008-2010. (S Octavia et al, Journal of Infectious Diseases 205:1220, April 15, 2012.)
A recent post on a "vaccine" -- with an unusual approach: A novel approach to providing immunity to HIV (March 12, 2012).
Posts on flu and flu vaccines are listed on the page Musings: Influenza (Swine flu).
April 18, 2012

|
This week marks the 100th anniversary of the birth of Glenn Seaborg -- born April 19, 1912. Seaborg is responsible for ten of the chemical elements -- and for the modern form of the periodic table. Seaborg is -- we presume -- the only person ever to point to a box on the periodic table that is named after himself. A tribute: Glenn Seaborg: A Man in Full. (Lynn Yarris, Science Beat (a newsletter of the "Berkeley Lab"), March 5, 1999 -- a few days after Seaborg's death.) An introduction to Seaborg -- the man and the scientist. It includes the figure at the left. |
For more...
* The Wikipedia page on Seaborg. It includes links to some of his papers; some were originally classified, and were perhaps never formally published -- but are now freely available. Wikipedia: Glenn T. Seaborg.
* The Nobel page on Seaborg. The Nobel Prize in Chemistry 1951: Edwin M. McMillan, Glenn T. Seaborg.
A post on the original announcement of a chemical element: Chemical element #117 (April 13, 2010).
* Previous post about a historical event: Discovery of the neutron: 80th anniversary (February 27, 2012).
* Next: Blueprint of a seaweed (1843) (May 2, 2012).My page Internet resources: Miscellaneous contains a section on Science: history. It includes a list of related Musings posts.
April 17, 2012
A new paper argues that ice ages 470 million years ago might have been triggered by plants. The first plants.
I have used the term "plants" here to mean organisms that photosynthesize on land. That is the proper usage of the term, but common usage varies. In particular, we distinguish algae, which photosynthesize in the oceans, from plants.
What the authors do is to make laboratory measurements on how plants affect the land. The plant they choose to use is a moss -- a simple plant, probably close to the earliest types of plants to come on land. They then extrapolate from these measurements to what the bigger effect on the environment would have been. It's interesting work, and an interesting story.
Here is an example of their results...
|
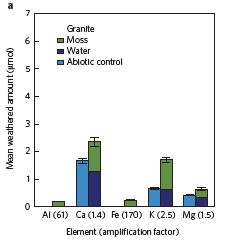
In this experiment, they simulated weathering of the common silicate mineral granite ("land") -- with or without a moss ("plant") growing on it. For several elements, they measured the amount that was released from the rock over time. This release is what we call weathering. The amount released -- the amount of weathering -- is shown on the y-axis, in micromoles (µmol).
Let's look at calcium (Ca), for a specific case. There are two bars for Ca. The blue bar to the left shows how much Ca was released with no moss; this is the "abiotic control". The right bar shows how much was released with the moss growing; this is the sum of what was found in the water (purple) and in the moss (green). With the moss, about 1.4 times as much Ca was released as without moss; they show that number, the "amplification factor", at the bottom by the element symbol. That is, the moss enhances weathering of the rock; for calcium, the enhanced weathering is about 40%. |
|
In this experiment, they looked at the weathering of five elements. The amplification factors ranged from 1.4 for Ca to 170 for Fe. (In some cases, the amount of abiotic weathering was so small that you cannot see the blue bar.) They tested another mineral, andesite, and got similar results. This is Figure 2a of the article. | |
Let's continue with the Ca story, as an example. More Ca is removed from the rock, more ends up in the ocean -- where it can form calcium carbonate, CaCO3, which settles to the bottom. That removes carbon dioxide from the atmosphere. And that results in cooling. Enough cooling to cause an ice age, they suggest.
It's important here to distinguish what they show directly and what they suggest might be the consequences. The lab experiments on weathering give real data. The experiments are designed to mimic what they think the situation would have been when plants first began to colonize the land. They then make logical arguments about what the effect might have been. People may question these arguments -- qualitatively or quantitatively. That's rather common in trying to reconstruct the early history of the Earth.
If you react to the title of this post by insisting, no, plants are good, be careful. It is one thing to describe what plants do: they photosynthesize, thus remove CO2 from the atmosphere. They also promote weathering. In general, they promote cooling. Whether cooling is good or bad depends on the context. In the case discussed here, they promote so much cooling that they, it is claimed, caused an ice age.
News stories:
* First land plants may have plunged the Earth into a series of ice ages -- The spread of early terrestrial plants would have reduced atmospheric carbon and cooled the planet, say scientists. (Guardian, February 1, 2012.)
* First plants caused ice ages: research -- New research reveals how the arrival of the first plants 470 million years ago triggered a series of ice ages. (Phys.Org, February 1, 2012.)
The article: First plants cooled the Ordovician. (T M Lenton et al, Nature Geoscience 5:86, February 2012.)
More about ancient weathering... Quiz: What is it? (March 6, 2012). (See the "answer".)
More about cooling: Turning metal into glass (September 21, 2014).
More about calcium: A new, simple way to measure bone loss? (September 14, 2012).
Also see...
* A thermotolerant coffee plant, with high quality beans (June 8, 2021).Lead author Tim Lenton is co-author of a recent book; see my page of Book Suggestions: Lenton & Watson, Revolutions that made the Earth (2011). This book is also noted on the Musings supplementary page on Gaia and James Lovelock.
April 16, 2012
This series of posts deals with the concern that excessive use of antibiotics on the farm may be causing increased antibiotic resistance in human pathogens. More specifically, it deals with US efforts to restrict such farm use of antibiotics.
* Original post: Restricting excessive use of antibiotics on the farm (September 25, 2010).
* Follow-up: Restricting excessive use of antibiotics on the farm -- follow-up (January 30, 2012)
We now have another step, from the FDA. Under a new "guidance", farmers are to use medically important antibiotics (i.e., those used for humans) only with a prescription from a veterinarian. For now, the FDA is seeking voluntary compliance. The intent of this guidance is clear enough; how it will work is much less clear. It is another step.
The saga continues.
The announcement: FDA takes steps to protect public health -- Agency working with animal, drug and medical communities to promote judicious antimicrobial use. (FDA, April 11, 2012. Now archived.) You can also get to this page from the news story below. At the end of this page are links to related FDA pages, including a plain-language FAQ.
News story: U.S. Tightens Rules on Antibiotics Use for Livestock. (New York Times, April 11, 2012. Link is now to Internet Archive.) This not only introduces the new announcement, but gives a good dose of the politics of the issue.
More about antibiotic resistance... Using viruses to make a better disinfectant (April 22, 2012)
A post on the development of new antibiotics... Scorpion venom: a source of a novel antibiotic? (August 3, 2012)
April 15, 2012
Gunjan writes...
Recently in an article of the Mumbai Mirror, there was a TechTalk column on: Living neon signs made of bacteria -- 'Light' created by attaching glowing protein to bacteria, colonies are then persuaded to blink in unison (Mumbai Mirror, January 4, 2012).
Update, December 2019... The original news story is no longer available; other news stories on the article are shown below. For the record, the original link was http://test.mumbaimirror.com/article/26/2012010420120104080732515eb536fbd/Living-neon-signs-made-of-bacteria.html. The following item is probably the same story, in a sister newspaper, but is also no longer available: http://epaper.timesofindia.com/Repository/getFiles.asp?Style=OliveXLib:LowLevelEntityToPrint_MIRRORNEW&Type=text/html&Locale=english-skin-custom&Path=BGMIR/2012/01/05&ID=Ar01100 .
Living biosensors like these bacteria, which are engineered to glow a particular color in response to a given chemical, have graced petri dishes in research laboratories for decades. But it is only recently that they are being put to practical use, as scientists adapt and deploy them to test for environmental contaminants. Sensor bacteria give faster and cheaper--if somewhat less precise--results than traditional chemical tests do, and they may prove increasingly important in detecting pollutants in seawater, groundwater, and foodstuffs.
There are multiple steps in designing the biosensor. One is the sensor per se. A sensor couples an input to an output. In this case, the cells have been designed to blink, using a fluorescent protein; the arsenic concentration [input] determines the rate of blinking [output]. The signal from a single cell is too small, so it must be amplified; the combined signal from many colonies each containing thousands of cells is large enough to see. Designing that signal amplification, synchronizing the signals from many cells, both over the short distances within a colony and over the longer distances between colonies, is the heart of the new work.
|
|
One of their bio-sensor chips. The chip contains an array of about 500 "bio-pixels" -- the individual small blue regions. The inset at the left shows two views of one of those bio-pixels. The top view is an ordinary microscope image; the bottom view shows the same pixel under fluorescence microscopy. As you can see, the main picture was taken with fluorescence.
Each pixel contains about 5,000 cells. Therefore, the entire chip contains about 2.5 million cells. The chip is about 3 millimeters wide. |
|
This is Figure 1c from the article. Versions of this figure, often without the inset, are common in news stories about this work. | |
Of course, this static picture misses the point -- and beauty -- of what they do. This thing blinks -- and how it blinks is a function of the arsenic concentration. See the video noted below!
They have also made a larger chip, which allows the signal to be seen by eye.
News stories:
* Sneak peek - another interesting article on Zee News: Researchers create a living neon sign. (Zee News, December 20, 2011.)
* Living neon signs made of millions of glowing bacteria. (EarthSky, December 20, 2011.) Check the video! (The video is also available at YouTube: Millions of Bacteria Make Up Living Neon Sign.) (The video is time-lapse; real time is shown on the labeling. The blink cycle is about an hour.)
* News story accompanying the article: Synthetic biology: Bacteria collaborate to sense arsenic. (C A Voigt, Nature 481:33, January 5, 2012.)
* The article, from Jeff Hasty's group at University of California, San Diego: A sensing array of radically coupled genetic 'biopixels'.(A Prindle et al, Nature 481:39, January 5, 2012.) Several movie files are included here, as "Supplementary information".
A quotable quote... A few years ago, Jan Van der Meer, an environmental microbiologist at the University of Lausanne, reported some early tests of such bacterial biosensors. He noted, "The extreme simplicity of this is that the heart of the sensor is the bacterial cell, and that the cell is a multiplying entity. It's extremely simple to reproduce them, and then you have enough for thousands of tests." [Detecting Pollution with Living Biosensors. (MIT Technology Review, September 17, 2008.)]
* * * * *
Getting bacteria to coordinate their activities builds on a natural regulatory phenomenon called quorum sensing. It was discussed in the context of cholera in the post: Designing a probiotic that fights cholera (December 13, 2010).
Another approach to bio-sensors... Rats, bananas, and tuberculosis (March 11, 2011).
A recent post about arsenic: Rice and arsenic: a follow-up (January 8, 2012).
April 13, 2012
Where did the Moon come from? The common view is that it resulted from a collision of the early Earth -- 4.5 billion years ago -- with another body, perhaps the size of Mars. The Moon was "ejected" as a result of that collision. There is little evidence on the matter; the common view comes from modeling and some guessing.
More specifically, the model predicts that the Moon was formed in roughly equal parts from the Earth and the other body. That is, the model predicts that the Moon is about half Earth-like, and half like the other body. Of course, we do not know what the other body was like. (However, we do "know" its name; it is called Theia.)
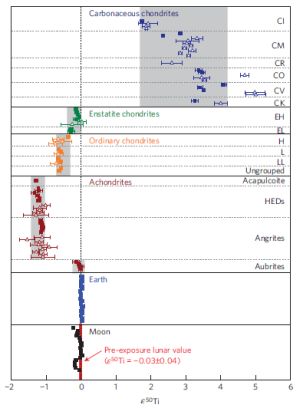
A new article provides more information about the composition of the Moon. The work uses lunar samples returned to Earth by Apollo missions of the 1970s. It focuses on the titanium (Ti) in the sample -- not simply the amount, but the relative amounts of various isotopes of Ti. The results seem to challenge, or at least constrain, the simple views about the origin of the Moon.
The following figure summarizes the new results.
|
The x-axis is ε50Ti. This is a measure of the isotope composition of the titanium in the sample. To get it, they isolate the Ti from the sample, and measure the isotopic composition. They then express this as ε50Ti, which shows how much the isotope composition differs from what is commonly found on Earth.
The various rows of the figure are for different samples. A good place to start is the next-to-bottom section, labeled Earth. You can see that all the samples in that section are essentially at zero -- just as expected from how we defined ε50Ti. Above the "Earth" section are samples of various types of meteorites. You can see that they vary widely; that is the main point. (The gray bar in each section is a summary of the range found for that type.) Below the "Earth" section, at the bottom, are results for various samples from the Moon. You can see that they are very close to the Earth value of zero. (In fact, the authors argue that these Moon values are even closer to zero than they seem. That's a complex story, involving cosmic rays; we'll leave it for now.) This is Figure 1 from the article. |
Their main conclusion, then, is that the Earth and Moon have the same distribution of isotopes of titanium. A similar result has been obtained for a few other elements; Ti is particularly interesting because it is one of the least volatile elements examined. Thus the results are suggesting that the Earth and Moon have the same composition.
This result is something of a surprise, if the Moon formed from about equal amounts of material from two solar system bodies -- given that such bodies probably vary widely in their composition. In fact, some of the media coverage has suggested that the result here shows that the Moon did not form from such a collision. That is, they suggest that the Moon is more like a chunk of Earth (i.e., a child with only one parent) than the product of two bodies. That's an overstatement, not justified by the results. The authors discuss how they see the implications; the main lesson is that the new data constrain models of what happened. It's back to the drawing board for the modellers; they now have more information to work with.
News stories:
* Further doubts cast over lunar formation models. (Physics World, March 26, 2012.)
* Titanium paternity test fingers Earth as moon's sole parent. (University of Chicago, March 28, 2012.)
* News story accompanying the article: Moon formation: Earth's titanium twin. (M M M Meier, Nature Geoscience 5:240, April 2012.) Includes a beautiful (and famous) photo -- of earthrise.
* The article: The proto-Earth as a significant source of lunar material. (J Zhang et al, Nature Geoscience 5:251, April 2012.)
Posts that mention the common story of how the Moon was formed:
* Birth of the Moon: Is it possible that Theia was similar to Earth? (June 20, 2015).
* Formation of the Moon: the California connection (October 10, 2014).
* Photography from the space shuttle (June 4, 2012).
* NASA mission to detect killer asteroids (September 9, 2009).More about the Moon:
* Preserving the Apollo landing sites (January 20, 2014).
* What If the Moon Didn't Exist? (October 1, 2011).More about isotope analysis:
* Discovery of a chemical of biological origin from Mars? (January 2, 2015).
* A new, simple way to measure bone loss? (September 14, 2012).My page of Introductory Chemistry Internet resources includes a section on Nuclei; Isotopes; Atomic weights. It includes a list of related Musings posts.
For more about meteors and meteorites: An extraterrestrial god (October 9, 2012).
Also see: The First Americans: the European connection (February 8, 2014).
April 10, 2012
The bacterium Helicobacter pylori can grow in quite acidic solutions -- such as the human stomach. In fact, half of all people, worldwide, carry this bug. The incidence is much lower in "developed" countries.
Why is this of interest? Well, H pylori causes ulcers -- a discovery that led to the 2005 Nobel prize. And it seems to be involved in causing stomach cancer. On the other hand, lack of this bug leads to increased esophageal cancer, "reflux" and asthma.
The evidence for the relationship between Helicobacter and asthma is mainly epidemiological: analysis of populations suggests a correlation. A recent paper investigates a mouse model for asthma, and uncovers a reason why Helicobacter may prevent asthma. They show that the bacteria cause the production of more Treg cells (regulatory T cells), which dampen the immune system.
|
Here is an example of their results.
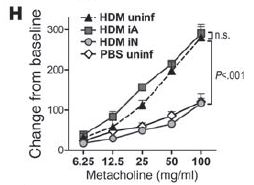
This is a model system for studying asthma in mice. This figure simply tests the effect of Helicobacter infection on asthma in mice. The mice are sensitized with an allergen from house dust mites (HDM). Later they are challenged with a chemical called methacholine (misspelled in the figure); and the resistance of the airways is measured. |
|
To start, look at two controls: the curves with open diamond symbols (near bottom) and with dark triangles (near top). The lower curve (diamonds) is the no-allergen control, where the mice were not given the allergen. This curve is labeled PBS, which means phosphate-buffered saline; that's like the allergen solution, but without the HDM allergen. The upper curve (triangles) is for the basic case with HDM antigen (HDM uninf, where "uninf" means uninfected with Helicobacter. These two curves define the basic experimental system. With the HDM-sensitized mice, there is a large change in airway resistance (y-axis). The HDM allergen is necessary; the PBS control shows little effect. Now look at the curve with circles -- labeled HDM iN. In this case, the mice were given the HDM allergen, but they are also infected with Helicobacter. (We'll return to a detail of this in the next paragraph.) The curve is "low" -- like the PBS control. Compare the circles curve with the triangles curve. Both have allergen; the difference is bacterial infection or not. That is, infection with the bacteria seems to reduce the asthma effect. What about the curve with squares, labeled HDM iA? What is the difference between HDM iA and HDM iN (previous paragraph)? Both were infected with Helicobacter; that is what the "i" means. However, iN means they were infected as neonates (a few days old), whereas iA means they were infected as adults. It matters! Infection with Helicobacter as neonates (circles, previous paragraph) provides protection against asthma; infection with Helicobacter as adults (squares) does not. This is Figure 1H from the article. | |
The authors interpret this finding to suggest that the bacterial infection protects the mice against asthma -- but only if present while the immune system is developing. Additional work in the paper implicates the Treg cells, which dampen immune responses.
This topic is part of the broader issue of what our microbiota -- the collection of microbes closely associated with the human body -- does. The big message is that it is complex, and must be answered with specifics. Here we have a single bug with diverse effects, both good and bad. It should not surprise us that a single bug may have both good and bad effects; it will be a challenge to sort out the implications. The article here is also part of the big and complex story of how our immune system develops -- a topic which may be intimately interconnected with our microbiota.
News stories:
* Gastric Bacterium Helicobacter Pylori Protects Against Asthma. (Science Daily, July 1, 2011.) Caution... This news story overstates the relevance to humans, which remains an open question.
* The Janus bug. (M Schaechter, Small Things Considered, August 1, 2011. Now archived.)
The article, which is freely available through PubMed Central: Helicobacter pylori infection prevents allergic asthma in mouse models through the induction of regulatory T cells. (I C Arnold et al, Journal of Clinical Investigation 121:3088, August 2011.)
The Nobel story for Helicobacter: The Nobel Prize in Physiology or Medicine 2005: Barry J. Marshall, J. Robin Warren.
Also see:
* A vaccine against asthma? (July 3, 2021).
* How intestinal worms benefit the host immune system (February 27, 2016).
* Reducing asthma: Should the child have a pet, perhaps a cow? (November 28, 2015).
* Gut bacteria affect the brain (March 18, 2011).
* Are girls too clean? (February 26, 2011).My page for Biotechnology in the News (BITN) -- Other topics includes a section on Cancer.
Book. The following book is listed on my page of Books: Suggestions for general science reading. Blaser, Missing Microbes -- How the overuse of antibiotics is fueling our modern plagues (2014). The book is broadly about the implications of our changing microbiota. The question about the role of Helicobacter is prominent. Recommended!
April 9, 2012
Making a weather forecast requires having some understanding of the behavior of the atmosphere. Until recently, the observations of the atmosphere seemed more like a pile of facts than any coherent story. But now, a team of Caltech astronomers suggests that the data can be explained by a fairly simple model. Of course, a good model makes predictions -- about the future. These predictions can be tested, so we will be able to see how good the model is.
Where are we, you are wondering? Titan -- the big moon of Saturn, the one with clouds and lakes of methane, and thus the potential for a cycle rather like our water cycle on Earth.
|
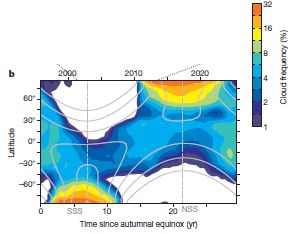
Here's an example of their modeling. The graph shows time on the x-axis; it is labeled by our Earth years across the top, and you can see that it extends from the past into the future. (It is also labeled in years since the autumnal equinox on the bottom.) The y-axis is latitude, extending from -90° at the South Pole to +90° at the North Pole.
The colors are a "heat map" showing the frequency of clouds. Brighter colors (red, yellow) mean more clouds; the details of the scale are shown by the bar at the right. |
|
Two "bright" regions of the graph are striking: one near the South Pole around year 2000 and the other near the North Pole around year 2015. These times are also marked as SSS, for southern summer solstice, and NSS for northern summer solstice. The former fits with measurements already made. The latter is a prediction about what is to come; it is a weather forecast: a forecast of increasing clouds near the North Pole in the coming years. This is Figure 3b from the article. Other figures in the article show information -- past and future -- for other weather parameters, including surface temperature, methane concentration in the atmosphere, and rainfall. | |
The real story here is the development of a model, which they believe reflects some understanding of the atmosphere of Titan. The model ties together various observations of Titan, and does so using basic principles of how we understand atmospheres; no exotic features are in the model -- so far. The model makes predictions. We'll see how good the predictions are.
News story: The Lakes and Storms of Titan. (Astrobiology Magazine, January 7, 2012. Now archived.) An excellent overview of the work.
The article: Polar methane accumulation and rainstorms on Titan from simulations of the methane cycle. (T Schneider et al, Nature 481:58, January 5, 2012.)
Also see:
* Would weather forecasting be improved by considering the isotopes in atmospheric moisture? (May 2, 2021).
* Hottest temperature ever recorded on Earth? Libya or Death Valley (California)? (June 30, 2013). Includes a weather forecast.
* Titan: tides, and the possibility of a sub-surface water ocean (August 4, 2012).
* Weather report from Titan: Clouds? Puddles? Does that mean it rained? (April 6, 2011).
* Quiz: NASA's boat (June 29, 2011).One author of this paper is Caltech professor Mike Brown, who played a key role in the recent story about the status of Pluto. I list his book on the Pluto story on my page of Book Suggestions: Brown, How I Killed Pluto -- and why it had it coming.
April 7, 2012
Jitesh sends the following news story: Eat at your own risk. (Down To Earth, April 15, 2012.)
I thought of including the lead picture from that page -- with the caption "Is this from Delhi or Berkeley?" But why embarrass the kid?
That story refers to a report from a consumer-oriented organization. Their press release about the report is at: Watch out for what you eat. It could be killing you slowly and sweetly: says new CSE junk food and nutrition study. (Centre for Science and Environment, March 30, 2012. Now archived.)
The items above are news stories. None of us have read the details. (For those who want the details, the report is available from the CSE page listed above.) Nevertheless, at least the general thrust rings true -- and the problem is global.
I would also caution that we separate defining the problem from pushing our favorite solutions. The story notes what some countries are doing to combat the obesity problem, but what is largely lacking is data on the effectiveness of any particular approach.
Related posts include:
* Antibiotics and obesity: Is there a causal connection? (October 15, 2012).
* A gene for obesity (May 7, 2011).
* Fat tax? (September 9, 2009).
April 6, 2012
We recognize five basic senses, such as sight and hearing, and we recognize that animals may differ in their relative use of the various senses. (That is, some animals may rely more on sight, some more on hearing, and so forth.) For taste, we recognize that there are five basic tastes, such as sour and bitter; these are detected by specific taste receptors. We are learning that animals differ in their responses to the various tastes.
Tasting "sweet" helps us detect plant materials, such as the sugars in fruits or from the hydrolysis of starch. One might wonder whether animals that don't eat plants (i.e., carnivores) have any need to detect sweet. In fact, work a few years ago showed that cats -- domestic and wild -- do not respond to sweets; further, they lack functional genes for sweet receptors.
New work extends that cat finding. Here they test various mammals of the order Carnivora. Despite the name of the group, it contains animals with various feeding habits -- including the strictly herbivorous panda.
|
Here are some results of testing two members of the Carnivora to see if they like sweets. Two animals are tested here: an Asian otter (blue) and a spectacled bear (red).
The basic test: offer the animal two bowls of water. One bowl has plain water, the other is sweetened, with either a sugar (first six) or an artificial sweetener (last six). See which bowl they prefer. A result of 50% (dashed line) means no preference; a result above 50% means preference for the sweet. (A result below 50% means aversion to the sweet.) |
|
First look at the results for the six sugars. In each case, the bear shows a preference for the sweetened water over the plain water. In contrast, the otter showed no preference. Thus it seems that the bear tastes "sweet" whereas the otter does not. The results for the artificial sweeteners are more complex, but consistent with the conclusion above. The otter, which seems to lack the ability to taste sweet, shows no preference toward any of the artificial sweeteners. The bear, which can taste sweets, shows a variety of responses to the various artificial sweeteners. (Occasional tests show an aversion to the artificial sweetener; this probably has nothing to do with sweet receptors.) (Another way to get the main idea from this graph... The only results above 50% are red -- for the bear.) The figure here is Figure 3 from the article. | |
They also do the genetic analysis, not just on the otter and bear, but on twelve species of the Carnivora. Their main finding is that the strict meat-eaters lack functional genes for sweet receptors. Interestingly, animals that gulp their food whole also lack sweet receptors -- and perhaps other taste receptors. The mutations found that lead to inactivation of the sweet receptor genes are different in the different species, suggesting independent loss.
The big picture that emerges here is a correlation between feeding habits and taste abilities.
News story: Extensive Taste Loss Found in Mammals: Feeding Preferences Shaped by Taste Receptors. (Science Daily, March 12, 2012.)
The article: Major taste loss in carnivorous mammals. (P Jiang et al, PNAS 109:4956, March 27, 2012.)
More about the sense of taste:
* Mice that try to drink the laser light -- a study of the taste of water (July 9, 2017).
* How can hummingbirds taste "sweet"? (September 26, 2014).
* The chemistry of a tasty tomato (June 18, 2012).
* The panda genome (January 11, 2010). The herbivorous panda lacks the gene needed for a taste receptor for tasting meat.
* Did Neandertal children hate broccoli? (November 22, 2009).Other posts on bears include:
* Bear photography (June 19, 2012).
* Bears hibernate -- but stay warm (April 30, 2011).Other posts on cats include:
* Big cat, little cat: Taqpep determines coat pattern (December 27, 2012).Also see: It's a dog-eat-starch world (April 23, 2013).
* * * * *
Update added October 13, 2023.
Cats like fish -- especially tuna. New work on the taste receptors of cats shows why. The work involves taste-testing panels and genetic and biochemical analyses of taste receptors. The general conclusion is that the umami receptors of cats are well-adapted to fish -- especially tuna.
* News story: Why Cats Like Fish -- New findings on the taste perception of house cats. (Bence Nanay, Psychology Today, September 6, 2023.)
* The article, which is open access: Umami taste perception and preferences of the domestic cat (Felis catus), an obligate carnivore. (Scott J McGrane et al, Chemical Senses 48:bjad026, August 8, 2023.)
April 3, 2012
A recent talk in the UC Berkeley CITRIS series may be of interest. The topic was the emerging field of printed electronics: using a printer to print electronic devices. In some cases, the printer used is much like the common inkjet printer
The talk was very good, and largely accessible to a general audience. It was also well organized. I think if you watch a few minutes of it, you will find it useful. Then, continue as you wish.
Among the issues discussed are the economics -- and how printed electronics may be suitable for certain kinds of applications. And among the more complex applications he discusses is sensor tags to measure quality of food products upon storage.
Video of the talk: Printed Electronic Systems: the Confluence of Printing and Semiconductors. (CITRIS talk by Vivek Subramanian, Electrical Engineering and Computer Science, UC Berkeley, March 14, 2012.) The page includes an abstract of the talk.
Previous posts about CITRIS events:
* CITRIS: Zettl; new energy series (November 1, 2009).
* Solar taxi (July 14, 2008).My page Internet resources: Biology - Miscellaneous contains a section on Nutrition; Food safety.
April 2, 2012
|
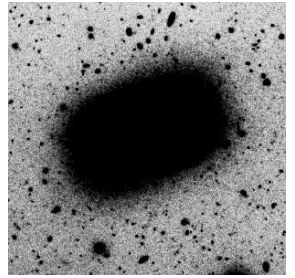
We won't formalize this as a quiz, with answer "next week", but let's start with a question -- a trick question. Consider the large, nearly rectangular object in the figure at the right; the shape may remind you of an emerald-cut diamond. It's called LEDA 074886. The question is: How do you know it is not a galaxy? (The figure itself does not contain any size marker, but you can take this as an astronomical figure. The object is about 70 million light-years away.)
|
|
So what is it? It's a galaxy. An "emerald-cut" galaxy. The astronomers were as surprised as we are; that is why this galaxy is the focus of a new article.
How does one get an emerald-cut galaxy? They don't know for sure. They suspect it may have resulted from a galactic collision: two flat-spiral galaxies merging at a certain orientation. They are doing computer simulations to see how this might work.
In fact, the shape of LEDA 074886 is not entirely novel. The authors do an extensive check, and suggest that seven other galaxies of approximately this shape are known -- out of millions. They find this sufficiently noteworthy that they spend almost a half-page of the paper listing and describing them.
News stories:
* Astronomers Discover Rectangular Galaxy -- A dwarf galaxy in the constellation of Eridanus resembles an 'emerald cut diamond', say discoverers. (Physics arXiv Blog (MIT Technology Review), March 20, 2012.)
* Rare "Emerald Cut" Galaxy Found -- Discoverer "couldn't stop smiling" when he spied rectangular oddity. (National Geographic, March 20, 2012. Now archived.) This story features another picture of the galaxy LEDA 074886. This one shows evidence for an active star-forming region in the center. This is probably Figure 3A from the article.
The article: LEDA 074886: A remarkable rectangular-looking galaxy. (A W Graham et al, Astrophysical Journal 750:121, May 10, 2012.) A preprint copy is freely available at arXiv: copy at arXiv.
Related... Mayhem at the center of the Milky Way (August 23, 2011).
And more on galaxies...
* A galaxy far, far away: the story of MACS 1149-JD (October 12, 2012).
* Where is the dark matter? (May 11, 2012).
April 1, 2012
| The article discussed here makes a connection between two science issues that get a lot of public attention. One is the declining population of the beautiful monarch butterfly (shown at the right), and the other is the use of genetically modified organisms (GMO). The paper develops the possibility that the use of certain GMO crop plants may be contributing to the decline of the butterflies. It's an interesting story. |

|
|
The picture is reduced from one in the news story listed below. |
Some background...
* One type of GMO has been developed to be resistant to an herbicide (called glyphosate; trade name Roundup). When Roundup-resistant crops are planted, the farmer can then treat the whole field with Roundup, and eliminate weeds -- because the crop is resistant.
* Monarch butterflies spend their summers in northern regions. That is where they reproduce; they are (largely) dependent on one plant, the milkweed. They then migrate south, and spend the winter in warmer lands. This migratory life cycle is carried out by 3-4 generations of monarchs over the year.
What is the connection? The new paper makes a case that the use of Roundup-resistant crops (corn and soybean) in the US Midwest (such as Iowa -- the main focus of their study) is leading to a reduced number of milkweed plants available to the monarchs. As a result, the monarchs reproduce less, and fewer are found in the winter habitat (in Mexico).
|
The graph at left shows one of the relationships they develop. The x-axis shows the amount of monarch egg production in the midwest. The y-axis shows the area occupied by monarchs the following winter in Mexico. You can see that there is a general trend: the more monarch eggs in the midwest, the more area covered by the butterflies the following winter. The points are labeled by year, so you can also see that there is a general trend toward smaller crops of butterflies over time.
For simplicity, take both scales as relative. That's a clue to the difficulty of doing this work. For example, they don't actually measure the number of eggs produced; they estimate it from other measurements they make. This is Figure 4 from the article. |
Fewer eggs? So, what is the connection to the GMO crops? They argue that there are fewer eggs because there is less milkweed (they measure that). And they argue that there is less milkweed because of the herbicide applied to the GMO crops. How good is the story? We noted above that the data on egg production is an estimate. As another example, they assume that egg production is directly related to the size of the resulting butterfly population. They are careful to explain what they do and what their numbers are. It seems rather open, and their numbers, taken at face value, do seem to show what they say. For now, they have made a plausible case -- plausible enough that it deserves further work. Over time, they and others can collect better data to fill in the details.
A somewhat mysterious issue is that the monarchs make better use of milkweeds on agricultural ("ag") lands than on non-ag lands. Ag milkweed has declined more than non-ag milkweed; that is expected from the herbicide applied to the croplands. But why is ag milkweed more productive for the monarchs? They have data that it is, though it is not based on measuring the two in parallel. If ag milkweed is better, is that because of the crops or some aspect of maintaining them?
So, what are we to make of this? The paper leads to two broad types of questions. One is whether their analysis is correct, and the other is what we should do if it is correct. It is important to separate those two questions. We have noted some of the questions about the analysis above.
What if it turns out that their basic conclusions hold? We can then discuss the policy implications. Is it possible that the present crop pattern is endangering the monarchs? If so, is that due to excessive use of herbicide -- as sometimes occurs with these crops? Should we encourage planting of more non-ag milkweed? Should we try to understand why ag milkweed is better for the monarchs than non-ag milkweed? (It would be ironic if the baseline level of monarchs they observe is enhanced because of modern farming.)
This is a useful scientific report. It raises an issue and takes some measurements, and reports them. The first job in science is to try to get the facts right; the paper here is a step in addressing this new issue.
News story: Study ties GMO corn, soybeans to butterfly losses. (StarTribune (Minneapolis), March 16, 2012. Now archived.)
The article: Milkweed loss in agricultural fields because of herbicide use: effect on the monarch butterfly population. (J M Pleasants & K S Oberhauser, Insect Conservation and Diversity 6:135, March 2013.)
A web page on monarch butterflies: The King of Butterflies -- The Monarch Butterfly. Beautiful pictures -- and lots of information. (The page used to be at monarch-butterfly.com.)
The local angle: Monarch Butterfly Sanctuary (Pacific Grove, California). One population of monarch butterflies spends the winter in the northern California town of Pacific Grove, on the Monterey peninsula about 100 miles south of San Francisco. This page is from the city of Pacific Grove -- where harming a butterfly can earn you a $1000 fine.
Related Musings posts:
* More on butterflies: Butterflies and UV vision (June 29, 2010).
* More on monarchs: The Most Remarkable Funeral Treasures (September 1, 2010).
* More about the San Francisco area... Happy Birthday (May 27, 2012).
* A book... Silent Spring -- on its 50th anniversary (October 5, 2012).
* More about the monarch butterflies: Offering the monarch butterflies milkweed may not be good for them (May 5, 2015).
* More about glyphosate: Is glyphosate (Roundup) a carcinogen? (March 6, 2016).For more on GM crops, see my page BITN: Agricultural biotechnology (GM foods) and Gene therapy.
March 30, 2012
We worry most about influenza -- the flu -- when it infects humans. We also worry when it affects our domestic animals -- a major problem in Asia with the H5N1 bird flu. We know there are animal reservoirs of the flu virus, most notably in birds and sometimes in pigs. And we know that flu viruses are classified by two of their surface features, the hemagglutinin and neuraminidase proteins. H5N1 is an example of that classification; there are 16 known H subtypes and 9 known N subtypes.
|
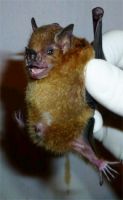
With that background, the discovery of a flu virus in a bat -- a flu virus tentatively designated H17N?? -- is at least intriguing. |
|
|
At the right: The source of this virus, a little yellow-shouldered bat. That's what it is called. Scientific name: Sturnira lilium. This picture of one unhappy specimen is reduced from the one on the CDC page listed below. These bats are frugivorous (fruit-eating); they would not ordinarily bite people. |
The scientists were examining bats to see what viruses they might carry. It was part of a program trying to learn what viruses are out there in nature -- in animal reservoirs; that allows scientists to monitor those viruses, and to consider their implications for human health. The search was done with nucleic acid testing, looking for their genomes (DNA or RNA), rather than by looking for virus particles or transmission. They found that three of these little yellow-shouldered bats carried flu viruses.
Examination of the genome sequences of these particular viruses showed them to be quite distinct from other known flu viruses. They were assigned a new H number, H17. The authors chose to not designate an N subtype at all at this point, pending further study of the novel neuraminidase. The sequence analysis suggests this is a very ancient virus -- one that split off from the other flu viruses we know long ago.
What about the biology of the new bat flu virus? Well, more mysteries. There are no signs that the bats are ill. The scientists have been unable to grow the virus in anything they tried, including human cells, bat cells, or the usual chicken eggs. Yet, tests suggest that some of the viral genes can function in human cells. Is it possible that co-infection with a "standard" flu virus and this bat virus could lead to something new -- and dangerous? That would simply be speculation at this point.
So what do we have here? Well, the article reports something new -- a novel flu virus in a host not generally considered a reservoir for flu viruses. First reports of new things are often patchy. What's important is that the initial discovery has been made; scientists will now try to study this virus further. Let's see how the science develops.
News story: Flu Virus Discovered In Bats. (Medical News Today, February 28, 2012.)
A medical information page: Bat Influenza (Flu) -- Questions & Answers. (US CDC.) (The article itself is from the CDC, in part.)
The article: A distinct lineage of influenza A virus from bats. (S Tong et al, PNAS 109:4269, March 13, 2012.)
The CDC has posted a short video. It's more a promotional video about the CDC mission than about the content. Nevertheless, it has some good shots, and is perhaps worth the minute or so it takes: YouTube: CDC Global Disease Detectives - Clues From a Bat Cave.
Posts on flu and flu vaccines are listed on the page Musings: Influenza (Swine flu).
Another novel bat virus... What is in the rubella virus family? (November 15, 2020).
More on bats:
* Bat meets spider (March 29, 2013).
* A plant that communicates with bats (September 7, 2011).
March 28, 2012
Song.
March 27, 2012
It is a declared goal of world public health authorities to eradicate polio, an infectious disease caused by three related viruses. Tremendous progress has been made, with huge reductions in the number of cases and the number of countries with endemic polio (meaning that it occurs there more or less continuously). For a few years now, the list of countries with endemic polio has remained at four.
That list of countries with endemic polio is now three, as India has been removed. India used to be the country with the largest number of polio cases. However, it has now gone twelve months with no cases. This milestone was tentatively reached in mid-January, though formal confirmation required that samples in the pipeline for analysis be analyzed. A month or so later, the backlog of analyses for the year was completed, and the World Health Organization (WHO) proclaimed India to be polio-free.
News stories:
* India records one year without polio cases. (WHO, January 12, 2012.) Preliminary announcement. (Replacement news story,
* Three to go... It's official: India is no longer polio-endemic, leaving just three countries which have never stopped polio. (Global Polio Eradication Initiative, March 1, 2012. Now archived.)
This is a milestone in the eradication of polio. But several cautions are in order.
* It is possible that polio will reappear in India. There are several reasons, including re-infection from the outside, which has been a problem in several countries near polio-endemic countries. It is also possible that a low level remains, low enough to cause zero detected cases over a one year period.
* Polio is an infectious disease. Eradication means zero. No other number is acceptable. Of course, this also relates to the previous point, since the virus does not respect political boundaries.
* Polio is not the only cause of paralysis. Eliminating polio does not mean eliminating paralysis. This is why the testing noted above was necessary; the testing is to see if a case of paralysis is due to poliovirus. It's also true that poliovirus is now a relatively minor cause of paralysis even in the countries where the virus remains. The reason for wanting to eradicate it is to eliminate this infectious source.
That is, this is a milestone, one well worth celebrating. A battle has been won. But the war is not over.
Follow-up: WHO certifies "South-East Asia" free of polio (November 1, 2014).
Previous post on the polio eradication issue: Poliovirus eradication: an update, with some good news and some bad news (May 22, 2011).
More... Polio eradication: And then there were two (July 27, 2015).
Another eradication story: Another disease has been eradicated. GREP. (February 2, 2010).
A new type of polio? Polio-like disease without polio virus? (March 17, 2014).
My page for Biotechnology in the News (BITN) -- Other topics includes a section on Polio. It includes a list of Musings posts on the topic.
March 26, 2012
You may have heard that you should not consume grapefruit (including juice) with certain medicines. Indeed -- and it is due to a very specific problem. There are some interesting issues, at several levels. These include the specific biochemical interactions, as well as work on developing a grapefruit that lacks the problem chemicals. I'll try to outline a couple of those. Resources below include a consumer-oriented page from the FDA; if the grapefruit-med interaction is of concern, I recommend you read this.
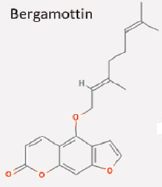
| That is the structure of bergamottin, one of a family of chemicals found in grapefruit that causes problems with some medicines. What these chemicals do is to inhibit an enzyme in your body that helps you get rid of the drug. Now, you might think that is good; inhibiting getting rid of the drug means there is more drug. The problem is that the choice of drug dosage takes into account the normal process of eliminating the drug. If you inhibit getting rid of the drug, you will have higher levels than expected, and that may cause toxicity. |
|
The class of chemicals here is furanocoumarins, referring to the triple ring system shown at the bottom of the structure. The simplest furanocoumarin -- without that long tail -- is psoralen. You may recognize psoralen as a component of celery, one that can make you sensitive to light. Furanocoumarins are found in various plants; they are probably involved in plant defense against pathogens. This is from Figure 1 of the article. The complete figure shows the pathway of how bergamottin and some of the related furanocoumarins are made. You'll see psoralen on that pathway. | |
A group of scientists -- in Florida -- has been looking at the levels of furanocoumarins in various types of grapefruit and related fruits. In the new work, they started with several grapefruit lines, plus a line of pummelo. They made hybrids, and measured the amount of furanocoumarins. The following graphs show some of their results.
|
|
The two graphs show the levels of several furanocoumarins, including bergamottin, in one of the parent grapefruit lines (frame B, left) and in one of the hybrids obtained (frame E, right).
Just look at the general pattern: the levels of these compounds are much lower for the hybrid (frame E). Thus, it seems that by simple breeding they have produced a grapefruit with much lower levels of the troublesome compounds. Fruits were picked on four different dates, leading to four bars for each chemical. No major effects of time were seen. These are from Figure 2 of the article. |
Is the problem solved? Is this the new grapefruit? It's not so simple. For example, they need to show that a grapefruit without these furanocoumarins has an acceptable taste. Second, the grapefruit produced here has seeds; there is a strong preference nowadays to market seedless citrus fruits. They should be able to repeat what they did here with seedless strains.
This story involves an interaction of a food with a medicine. The good news here is that the interaction has been identified. However, there are many ways food and medicines might interact, and often we do not know. In fact, even the grapefruit story is more complex. There are meds for which grapefruit seems to reduce the drug availability; this is not well understood.
An informational page from the US Food and Drug Administration (FDA) on the grapefruit-med issue: Grapefruit Juice and Medicine May Not Mix. (FDA, February 22, 2012; updated July 18, 2017.) The page notes that "Seville oranges (often used to make orange marmalade) and tangelos (a cross between tangerines and grapefruit) affect the same enzyme as grapefruit juice". It ends with some practical advice for consumers. Even if you are not particularly interested in the underlying science issues here, the grapefruit-med interaction is of practical importance.
News story: Hybrid grapefruit safe for prescription meds. (Futurity, October 25, 2011. Now archived.) A short overview of the paper listed below. Note that the title refers to a grapefruit that is reported in the paper, but which is not available at this time.
The article: Characterization of Furanocoumarin Profile and Inheritance Toward Selection of Low Furanocoumarin Seedless Grapefruit Cultivars. (C Chen et al, Journal of the American Society for Horticultural Science 136:358, September 2011.)
Grapefruit and medicine -- II (September 24, 2012). An important related post about grapefruit effects.
More about plant defense chemicals... Underground messaging between bean plants (July 29, 2013).
More Florida hybrids: What if two of the world's most destructive pests spent the evening together in Fort Lauderdale? (April 4, 2015).
More from Florida... Pythons in Florida (February 7, 2012).
More about citrus: Why some citrus fruits are so sour (April 22, 2019).
More fruit... Why does a durian smell so bad? (February 14, 2017).
March 24, 2012
Climate change (or "global warming") is complex. We want to understand what has happened, predict what is likely to happen, and then decide what to do about it. The first two are science investigations, albeit very complex ones. Then there is a political aspect in choosing what to do; the difficulty of the political choices is enhanced by the inevitable fact that the science answers to the first two questions are always incomplete.
A new paper offers some analysis of the predictions, and then offers something of a novel suggestion as to what we should do. It's all quite complex, and I will try here to present only one point. The goal is to see the basis of this one point, not to present a complete picture. I hope it will stimulate some thinking about the issues.
The main focus of most discussions of climate change is carbon dioxide (CO2). The new paper suggests that we should focus on methane (CH4) and "black carbon" (BC; loosely, soot) -- in the short term. The following figure summarizes their argument.
|
The figure summarizes some of the key trends they discuss.
The left side of the figure shows the historical record of global temperature (T). T is shown here as change since the 1900 reference point. You can see that T has gradually (and irregularly) increased over the period shown, by about a half degree (Celsius). The right side shows the predicted T change, out to 2070, under four different models. The upper (bluish) curve shows what will happen if we keep doing what we are doing now; the T will increase to about +2.7 degrees by 2070. The lower curve (dark red) is the most optimistic scenario: if we reduce all the emissions we can, the change will be only 1.7 degrees. |
|
Of particular interest here are the two "middle" curves. One shows what will happen if we focus on the CO2 emissions, whereas the other shows what will happen if we focus on the CH4 and BC. Interestingly, these have different shapes. Focusing on the CH4 and BC yields a quick benefit, whereas focusing on CO2 leads to a delayed benefit. The figure above is from the Nature story. Figure 1 of the article is a more complex version of this. | |
Thus a key point they want to emphasize is that we should put some short term emphasis on reducing methane and BC, because there will be a quicker payoff. (The reason for quicker response with these chemicals is that they do not last as long n the atmosphere.)
A criticism of their proposal is that it might divert attention away from CO2. That is not their intent; decreasing CO2 is indeed important. But everyone knows that. What's less well known, they would say, is the need to work on the CH4 and BC -- right away.
News story: Global warming: Pollutants key to climate fix -- Governments look to reduce methane and black carbon as a way to slow warming. (Nature 481:245, January 19, 2012.) As noted, this is the source of the figure used above. It's a good short article that raises the main points -- in a reasonably understandable way.
* News story accompanying the article: Global change: A Quick (Partial) Fix for an Ailing Atmosphere. (R A Kerr, Science 335:156, January 19, 2012.)
* The article: Simultaneously Mitigating Near-Term Climate Change and Improving Human Health and Food Security. (D Shindell et al, Science 335:183, January 19, 2012.) This is a complex article! But as part of their analysis, they note that reducing methane and BC will have other benefits to human society, in terms of avoiding crop yield losses and premature deaths.
Also see...
* Recent craters in Siberia due to methane release from hydrates in the permafrost (January 15, 2025).
* Harvesting methane from the air? (May 15, 2024).
* Boston is leaking (February 13, 2015).
* What caused the mass extinction 252 million years ago? Methane-producing microbes? (October 12, 2014).
* Methane leaks -- relevance to use of natural gas as a fuel (April 7, 2014).
* Global warming trend? Independent evidence (March 22, 2013).
* Why isn't the temperature rising? (September 12, 2011).
* Geoengineering: a sunscreen for the earth? (February 20, 2010).
March 23, 2012
A man? Yes. But not a woman. So say a group of economists studying microfinance in Sri Lanka.
The basic experimental strategy... Give individuals with a small business a single cash grant, and follow the progress of their business over the next several years. Here are some of their results... The numeric results are "impact", a measure of the benefit of the grant compared to the controls. I show results for "total labor income". Results are in Sri Lanka rupees (LKR) per month. Asterisks indicate that the result is statistically significant; more asterisks indicate higher significance.
| Years after grant | Impact for males | Impact for females |
|---|---|---|
| 1 | 800 *** | 66 |
| 2 | 768 * | 28 |
| 3 | 868 ** | -36 |
| 5-6 | 876 * | -149 |
So what do we see here?
* A lot of asterisks for men, and none for women. That is, the impacts for men are statistically significant, while those for women are not.
* We also see that the nominal effects (the numbers shown) are larger for men than for women.
* Remember the specific nature of this experiment... the participants were given a single cash grant at the outset. Previous work had shown much of what is above. What is new here is the data for later years. The key new finding is that the single initial grant has produced a long term effect -- for men. A single fish can feed a man for life. Indeed the fish doesn't feed the woman for life, but this fish doesn't seem to work very well for women at all here.
The table above is extracted from Table 2 of the paper. The full table shows various measures of the impact. I chose only one for this brief summary, and I chose the one with the cleanest results. Although the results are less clean for the other measures, the big picture is about the same. The full table also shows a measure of the variability of each of the data points; the variabilities are large. Those variabilities are important in their calculations of the statistical significance.
Numbers are numbers. The implications are not entirely clear, and I won't try. The overview articles below will help you some. It's easy to criticize, or even make fun of sociological or economics research. But that is not quite fair. I hope you will appreciate that the authors here have attempted to take a complex situation and study it with a scientifically sound experimental approach. That the results may confuse, or even disappoint, should not dominate. It is normal that scientific experiments raise more questions than they answer -- and that they surprise us. As so often with scientific papers, this paper is a step towards understanding -- not "the answer".
Overview by author: Give a man a fish and feed him for life? Experimental evidence on the long-term effects of grants on Sri Lankan Microenterprises. (D McKenzie, World Bank blog, February 23, 2012.) McKenzie, of the World Bank, is a co-author of the paper. This blog item is a plain-language overview of the work.
Broad overview: The puzzle of gender and micro enterprise returns. (Daily News, October 27, 2011.) This is a story from a Sri Lanka newspaper, by Dr Dileni Gunewardena at the University of Peradeniya, which is the institution of the lead author. It is primarily about the earlier related papers from the same group. It is not clear whether this article deals with the new paper, but I would guess that the author was aware of the new results. In any case, it is a very readable and useful -- and provocative -- overview of some of the issues. (This story is dated after the current article was submitted, but prior to its acceptance. And a caution... There is a second story on this same page -- not on this work, but also perhaps not entirely unrelated.)
The article: One-Time Transfers of Cash or Capital Have Long-Lasting Effects on Microenterprises in Sri Lanka. (S de Mel et al, Science 335:962, February 24, 2012.)
Microfinance was the subject of a Nobel Prize: 2006 Nobel Peace Prize: Muhammad Yunus and the Grameen Bank. Yunus and the Grameen Bank are probably among the best known players in microfinance. However, there are various approaches, and the effectiveness of each needs to be evaluated in different situations. Indeed, microfinance has come under scrutiny. But be careful about generalizations. The paper highlighted in this post is an attempt to find out what works, and it tests one approach in one culture.
More about feeding on fish... Cultural transmission of fishing techniques among dolphins (September 13, 2011).
More about banking: Are bankers fundamentally dishonest? (January 23, 2015).
March 20, 2012
|
Briefly noted... A couple years ago we noted some work involving a colony of hyenas maintained at the University of California, Berkeley: He hi - ha - he (April 10, 2010). (Same picture.) We now have some bad news... because of financial issues, the future of the colony is in doubt. News story: Berkeley Hills hyena colony faces budget cuts. (Daily Cal, March 5, 2012. Now archived.) |
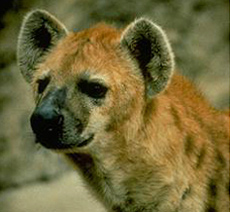
|
More Berkeley wildlife... Berkeley wildlife (September 3, 2010).
* * * * *
Update: World's only captive hyena colony to be discontinued due to lack of funding. (Daily Cal, May 4, 2014. Now archived.)
March 19, 2012
People worry about prion diseases -- even if they don't know the word. The most familiar prion disease is probably mad cow disease, more formally known as bovine spongiform encephalopathy (BSE) in cows and variant Creutzfeldt-Jakob disease (vCJD) when it jumps to humans. The prion is the apparent infectious agent of these diseases -- but it is quite different than other infectious agents we commonly talk about. Prions are not viruses or bacteria; they are simply mis-folded proteins. The reason they seem to be infectious is a complex issue. Briefly, it involves an interaction between the infecting protein and the version of the same protein made by the host. Somehow, the infecting mis-folded prion protein causes the host to make more mis-folded protein, from its own genes.
Prions fascinate biologists because of their unusual properties. But our fears of prion diseases are usually overdone. The good news is that most prion diseases are quite uncommon, and they transmit poorly from one animal species to another.
Or do they? A new paper reports that prion transmission across the species barrier may be more efficient than we had suspected. The implications of this new work are quite unclear.
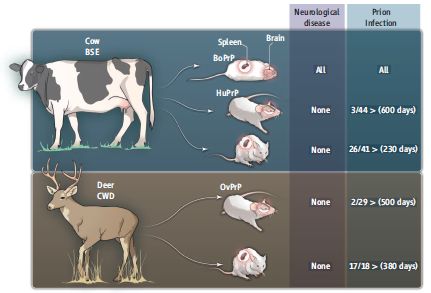
|
Here's the idea... The figure is a combination of a cartoon of the experiment, with a summary of some real data.
At the left are the animals that are the source of infectious material. One is a cow, which has BSE. The other is a deer, which has a prion disease called chronic wasting disease (CWD). In the middle are the mice -- which get infected. But these are not exactly normal mice. They have various prion genes (from genetic engineering); that gene is labeled PrP (for prion protein). Reading down, the mice may have the prion gene from cow (bovine, Bo), human (Hu), or sheep (ovine, Ov). By using these various kinds of modified mice, they can test various species barriers -- all within mice. |
|
At the right are some results. The first set of results, top row, is for cow prions (BSE) infected into mice carrying the cow prion gene (BoPrP). In this case, there is no species barrier. All mice get neurological disease. Further, infectious prions are found in both the spleen and brain; note that these organs are circled and labeled on the mice. The next two rows of results are for cow prions infected into mice with the human prion gene. You can see that none of the mice get neurological disease. However, infectious prions are found in a few brains (3/44) but many spleens (26/41 -- even at an earlier measurement time). This is an example of the key ideas from this work. First, we see infectious prions without sign of disease; second, there is much more infectious prion in the spleen than in the brain. The lower part of the figure shows a similar experiment with deer prions (CWD) infected into mice with the sheep prion gene. The results are similar: no disease, but there are prions -- and more often in the spleens. | |
A simple interpretation is that it is easier to cross the species barrier in the spleen than in the brain. The implications of these results are not clear. For now, they represent an advance in our description of how prions behave. We see that we can have silent infections -- presence of the agent without noticeable disease. Second, we see that prion conversion in a new host seems to occur more often than we had thought, based largely on studying the brain. Of course, the new work is based on the experimental system with modified mice; we await testing of these ideas in other systems, including natural ones.
A possible practical implication is that there may well be people carrying silent BSE (vCJD) infections. We do not know what the future might hold for them, but one concern is that their tissues could be a source of infection for others, for example, by transplantation.
News stories:
* Prion diseases hide out in the spleen -- UK population could harbour thousands of silent infections. (Nature News, January 26, 2012.)
* New study shows prions able to jump between species more easily than thought. (PhysOrg, January 27, 2012.)
* News story accompanying the article: Cell Biology: The Risk of Prion Zoonoses. (J Collinge, Science 335:411, January 27, 2012.) The figure above is from this news article.
* The article: Facilitated Cross-Species Transmission of Prions in Extraneural Tissue. (V Beringue et al, Science 335:472, January 27, 2012.)
More on prions:
* Mineral licks and prion transmission? (May 8, 2018). CWD.
* Can prions, which cause brain disease, be transmitted by skin? (January 26, 2018).
* Interfering with prion propagation? (April 5, 2014).The following post is about the possible transmissibility of Alzheimer's disease; it makes comparison with the prion diseases. Is Alzheimer's disease transmissible? (February 4, 2011).
For more about prions, see my page Biotechnology in the News (BITN) - Prions (BSE, CJD, etc).
More spleens: Bigger spleens for a bigger oxygen supply in Sea Nomad people with unusual ability to hold their breath (July 2, 2018).
March 17, 2012
A reader sends the following science item for St Patrick's Day. (NPR, March 16, 2012.)
Previous post that mentions Saccharomyces cerevisiae: Children with two fathers (January 3, 2011).
March 16, 2012
Hydrogen. Chemical element #1; H. It's a gas -- one that can be converted to a liquid or solid only with difficulty; the freezing point of hydrogen is about 14 K (-259 °C). Yet there has long been suspicion that hydrogen could be a metal, if only we could get the conditions right. A hint of this is seen in the common placement of H in the periodic table in group 1, the alkali metals. Of course, where we show H in the periodic table is not an explanation of anything; it only reflects what we think we know.
The recipe for making metallic hydrogen has seemed straightforward: just lower the temperature and raise the pressure. Yet repeated attempts to make metallic hydrogen have failed. Now we have a report that claims success -- achieved by not quite following that standard recipe. They raise the pressure, but do the work at room temperature.
Let's look at one of their experiments. One key property of metals is that they conduct electricity; that is, there is low electrical resistance. So, in this experiment, they measure the electrical resistance of their sample of hydrogen as they raise the pressure. The resistance is given in ohms (Ω); the pressure is given in gigapascals (GPa).
The pascal (Pa) is the proper SI unit for pressure, but it may be unfamiliar to some. For perspective, 1 atmosphere is about 105 Pa. Therefore, 1 GPa (109 Pa) is about 10,000 atmospheres. The scale on the graph below starts at 200 GPa; that is about 2 million atmospheres.
The following figure, which is Figure 3A from the paper, shows the results.
|
The figure is complex; let's focus on just one part. The black curve shows the electrical resistance of the hydrogen as the pressure is raised. The resistance is shown on the y-axis, on a log scale. The pressure is shown on the x-axis.
With a bit of clever ignoring of unnecessary details, the story is simple: The resistance starts out high (108 Ω). As the pressure is raised, the resistance drops by 10,000 fold, to 104 Ω. Most of that drop occurs quite abruptly, at a pressure just above 270 GPa. (There is an earlier smaller drop, which they discuss in the paper. It reflects an intermediate, semi-conductor state. The blue line, which shows data for conductivity driven by light, supports this. The inset has more on this.) |
So the big picture here is that they see an abrupt and dramatic loss of electrical resistance -- a rise in conductivity -- as the pressure is raised. This is what one would expect if the hydrogen has become metallic.
These are technically extremely complex experiments, and it is likely that the behavior of hydrogen -- that simplest element -- is more complex than we now understand. The results here should be taken as opening the door to studying metallic hydrogen. These are perhaps the most premising results obtained so far. They need to be verified and then extended -- so we learn about the form -- or forms -- of hydrogen under these extreme conditions. Their own statement at the end of their abstract is appropriate: "Our findings open an avenue for detailed and comprehensive studies of metallic hydrogen."
In noting a claim of finally making metallic hydrogen, we should emphasize that this refers to Earth. There is, it is commonly thought, plenty of metallic hydrogen on Jupiter. The core -- and perhaps a substantial portion of the planet -- is at high enough pressure to make metallic hydrogen naturally. Our understanding of Jupiter would be enhanced if we can figure out the rules for making metallic hydrogen.
News story: Pair claim they have turned hydrogen to metal. (Phys.Org, November 15, 2011.)
* News story accompanying the article: High-pressure physics: Testing one's metal. (A P Jephcoat, Nature Materials 10:904, December 2011.)
* The article: Conductive dense hydrogen. (M I Eremets & I A Troyan, Nature Materials 10:927, December 2011.)
More on this... Metallic hydrogen? -- follow-up (July 30, 2012).
A new claim: Metallic hydrogen -- new evidence (March 7, 2020).
More on high pressures: Novel forms of sodium chloride, such as NaCl3 (January 17, 2014).
High temperature superconductivity -- from the same lab: What's the connection: rotten eggs and high-temperature superconductivity? (June 8, 2015).
March 14, 2012
Go check out the video: YouTube: see cat run.
The key idea is that this is the fastest running robot (on legs); it runs faster than humans can. The video shows the robot exercising on a treadmill. The robot design was inspired in part by studying how fast animals, such as cheetahs, run.
News story: Robotic cheetah 'breaks speed record for legged robots'. (BBC, March 6, 2012.)
Here is an announcement from the sponsor: DARPA's "Cheetah" Sets Land Speed Record for Legged Robots. (DARPA, March 5, 2012; now archived.) There seems to be no formal publication at this point, so we have only limited information.
The work is from Boston Dynamics. Some will associate Big Dog with them; I suspect that pre-dates Musings. We noted another of their developments in the post: Climbing robot (May 15, 2009).
More DARPA-sponsored robotics...
* FDA to fast-track prosthetic arm -- Follow-up: videos (April 2, 2011).
* Robot uses coffee as a picker-upper (December 17, 2010).Also see: Acrobatic cockroaches inspire robot design (September 16, 2012).
For more about the emerging field of bio-mimetic, or, better, bio-inspired engineering, see my Biotechnology in the News (BITN) topic Bio-inspiration (biomimetics). It includes a listing of some other Musings posts in the area.
More on cheetahs: Big cat, little cat: Taqpep determines coat pattern (December 27, 2012).
More on cats: Pet Diary (September 25, 2009).
More from Boston... Boston is leaking (February 13, 2015).
More about exercise: Sparing glucose for athletic endurance (August 21, 2017).
There is now an extensive list of sports-related Musings posts on my page Internet resources: Miscellaneous under Sports.
March 13, 2012
|
Original post: Quiz: What is it? (March 6, 2012). As a reminder, the quiz presented the figure shown at the right, and asked what it is. |

|
For the answer, see the original post: Quiz: What is it? (March 6, 2012).
March 12, 2012
Producing a vaccine against the human immunodeficiency virus (HIV) is a long-standing problem. A recent paper offers a new approach to producing an effective immune response against HIV, and provides some very encouraging results.
A key part of the problem is the variability of the virus, which is enhanced during infection. A key need, then, is an immune response that is capable of dealing with a wide range of viral strains. In fact, some "broadly neutralizing" antibodies to HIV have been found. These are antibodies that are capable of neutralizing most known HIV strains. They have typically been found by analyzing the blood serum from those occasional people who seem to have fended off the virus for an extended period. Several such antibodies are now known, and they have been much studied. A key feature of them is that they are highly evolved antibodies. To understand what that means... Our immune system is complicated. The DNA segments that code for our antibodies are actually developed during our life, by changes in the underlying genes we inherit. When we have an antibody response, further changes are made, to develop better antibodies. The development of antibodies is a mini-evolutionary system of its own; random changes in the antibody genes are followed by a process of selecting the best -- most strongly binding -- antibodies.
This process of extensive genetic changes focused on a particular gene is often called hypermutation.
It's not obvious that there is any selection for broadly neutralizing antibodies per se, but occasionally that happens. How do we make use of our understanding of broadly neutralizing antibodies?
In the new work, a team of southern California scientists (Caltech and UCLA), led by Nobel laureate David Baltimore (co-discoverer of the broad class of viruses to which HIV belongs) tries a logically simple and direct approach. They report a startling success -- with mice.
What do they do? They inject the gene for the desired antibody (using a virus as the "vector" that carries the gene) into the muscle of the mice. This is how vaccines are delivered. But in this case, what is injected is not the agent itself, to stimulate the body to make an antibody in response; it is the gene for the antibody. The mice make the antibody -- and they are fully resistant to the virus. A single injection of the gene for the antibody, at sufficient dose, results in full lifetime immunity. They call the method Vectored ImmunoProphylaxis (VIP).

|
Here is an example of their results...
The general plan here is that the mice are injected with a vector carrying the antibody gene -- or a control vector that codes for luciferase. After some time to develop antibodies, they are challenged with an HIV. (The technical aspects of this step are complex, because mice are not normally susceptible to HIV.) They then measure a marker of the HIV infection, which is plotted on the y-axis. The various curves are for different amounts of the vector coding for the antibody gene, plus a control that does not carry the antibody gene at all. To start, look at the curves with white circles and red circles. The former is for vector with the luciferase gene; this is a control. The latter is for vector with the antibody gene. You can see that the control (white circles) quickly declines to low levels of CD4 cells, showing that HIV has successfully infected. In contrast, the curve with red circles shows a near constant level of CD4 cells over time; this shows that the antibody was effective in preventing HIV infection from causing loss of CD4 cells. |
|
Looking further, you can see that there are two groups of curves-- exemplified by the two curves we started with above. The upper group of curves shows protection; the lower group shows lack of protection. If you sort through the somewhat confusing legend, you will see a clear pattern: higher doses of the vector, carrying the antibody gene, lead to protection. Lower doses, and the control vector without the antibody gene, do not. It is completely consistent. (The legend is confusing, because there seems no obvious order to the listing. Folks, please try to make your graphs easily understood.) The figure above is the lower part of Figure 4 of the paper. | |
The overall picture, then, is that they have an antibody that is effective against a wide range of HIV strains. They can get mice to produce this antibody by injecting the gene, and the antibody is protective against the virus in the mice. The key limitation of the work is that it is in mice, and we do not know how well the procedure will translate to humans. The paper concludes by noting that that they are planning human trials. We eagerly await results, but let's remember that many things shown to work in mice prove hard to translate to humans.
News story: Biologists Deliver Neutralizing Antibodies That Protect Against HIV Infection in Mice. (Science Daily, November 30, 2011.) An excellent overview, which includes discussion of the issues in translating this to humans.
The article: Antibody-based protection against HIV infection by vectored immunoprophylaxis. (A B Balazs et al, Nature 481:81, January 5, 2012.)
Video. There is a short video (5 minutes) on this work, from the Caltech news office. It's not very deep, but does give the idea, and gives you a chance to see the lead author, Alejandro Balazs, and the lead professor, David Baltimore. The video is called Biologists Deliver Neutralizing Antibodies that Protect Against HIV Infection in Mice, and is dated November 30, 2011. It is available at YouTube.
For more on the HIV vaccine issue, here are two related posts...
* HIV vaccine trial -- and quibbling about statistics (November 2, 2009).
* And then... Why did the HIV vaccine work for some people? Follow-up (May 1, 2012).More about immune responses to HIV: Should we make antibodies to HIV in cows? (November 14, 2017).
The approach here makes this a type of gene therapy, It's not about fixing a gene of the host, but about adding one. For another post on gene therapy... Gene therapy: Could we now treat Queen Victoria's sons? The FIX Fix. (January 6, 2012).
More on vaccines: Whooping cough (pertussis): emergence of new strains as a result of vaccination? (April 20, 2012).
More about hypermutation -- in bacteria... Hypermutation and defense in bacteria (July 31, 2024).
My page for Biotechnology in the News (BITN) -- Other topics includes sections on HIV and Vaccines.
March 10, 2012
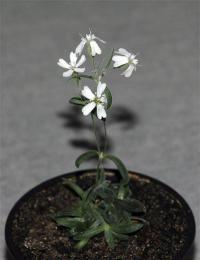
|
There it is. A plant recently photographed growing in a lab in Russia. A plant that was born some 30,000 years ago.
This is from the PhysOrg news story. It may be the same as Figure 3C of the paper. In any case, Figures 2 and 3 of the paper offer more photos; be sure to read the legends, so you know which are which. Let's look at what they actually did, so we see the significance of the finding and also understand what questions there may be. |
The plant shown above was grown from tissue found squirreled away in the Siberian permafrost. Yes, squirreled away. The source is almost certainly a burrow made by a squirrel, and filled with food for the winter. That's a burrow that dates to 30,000 years ago; it contains what a squirrel put in it 30,000 years ago. The burrow contents include seeds and fruits. Of course, it is something of a matter of luck that the burrow became preserved, but permafrost is good for that.
So, the scientists find the burrow -- and its contents. Is anything still alive? They tried to grow some of the seeds, and that failed. They tried to grow one of the plants using tissue from the fruit -- and that worked. That is what is shown above. Not only did it grow, but it was fertile, producing viable seeds.
The significance? They have regenerated a viable organism from tissue 30,000 years old. That is the oldest multicellular organism that has been successfully regenerated. The previous record for plants was about 2,000 years. It is remarkable. It allows the scientists to study an organism that grew 30,000 years ago, and to compare it with its modern equivalent. And of course, it opens the door to doing more such work.
Concerns? The validity of any work with ancient samples is always open to question. Is the dating correct? Is the sample really from ancient material (rather than from some contaminant)? What changes might have occurred during the process of resuscitating the ancient material? Work with ancient DNA had many false starts; over time, people learned how to do it, and it is now mainstream, though always technically challenging. The new work is exciting, and it will be scrutinized. That's how science proceeds.
News story: Russians revive Ice Age flower from frozen burrow. (Phys.Org, February 20, 2012.)
The article: Regeneration of whole fertile plants from 30,000-y-old fruit tissue buried in Siberian permafrost. (S Yashina et al, PNAS 109:4008, March 6, 2012.)
Other Musings posts that start with permafrost...
* Mercury pollution from Arctic melting (February 19, 2019).
* Inuk, a 4000 year old Saqqaq from Qeqertasussuk (March 1, 2010).Of course, the fascinating story of Denisovan man starts with permafrost, though we did not explicitly note that: The Siberian finger: a new human species? (April 27, 2010).
Life at age 34,000? (October 8, 2011). Is it possible to find microbes that have been alive for tens of thousands of years? This work is in the same spirit as the current post, and involves material of about the same age. Work with microbes and plants may share an important feature. With microbes, the issue is almost certainly whether an occasional cell survives. That may well be true with plants, too. It is common that one can generate whole plants from single cells -- something not possible with most animals.
And more: Recovery of live, infectious virus from 30,000 year old permafrost (March 25, 2014).
A post about ancient proteins -- and a story that is still quite controversial: Dinosaur proteins (July 6, 2009).
Another squirrel story: Super Squirrel (September 19, 2009).
More flowers: Better enzymes through nanoflowers (July 7, 2012).
More old plants: Did the earliest dinosaurs like flowers? (October 14, 2013).
More about regeneration is on my page of Biotechnology in the News (BITN) for Cloning and stem cells. It includes an extensive list of related Musings posts.
March 6, 2012
|
Borislav sends the picture at the right, and asks... What is it? |
|
| Answer (and source) next week. [See immediately below.] |
* * * * *
Answer (posted March 13, 2012):
It's Orbulina universa -- a member of the Foraminifera, a phylum of protists (single-celled eukaryotic microbes). Forams (to use a common short term) are noted for making fancy skeletons, as you can see here. The spines are made of calcite, a form of calcium carbonate, CaCO3. (The bright specks along the spines are photosynthetic dinoflagellate cells associated with the forams; thus these non-photosynthetic forams only grow at depths where there is light.)
This photo, by professor Howard Spero, of the University of California at Davis, was featured on the cover of a recent issue of Science. For the full cover, with a short description, see the journal page: About the Cover. (Science, February 17, 2012.) That page gives some dimensions, but it is not clear exactly what they refer to. In any case, this is a microscope image, and the entire picture is a few millimeters across.
Why did Science feature a foram? Forams are abundant in the oceans, hence in ocean sediments; the foram sediments are a goldmine of information about ocean history. A paper in this issue measures the isotopes of lithium in forams from 70 millions years of sediments around the world, and uses the information to make inferences about weathering. So far, we have not found a good freely available description of the work, so we'll leave it at that for now. The paper and its accompanying news story are listed below, for those who have access and might want to look further.
* News story accompanying the article: Geochemistry: Mountains, Weathering, and Climate -- Changes in the lithium isotope composition of seawater over the past 70 million years elucidate the links between weathering and climate. (A Paytan, Science 335:810, February 17, 2012.)
* The article: Lithium Isotope History of Cenozoic Seawater: Changes in Silicate Weathering and Reverse Weathering. (S Misra & P N Froelich, Science 335:818, February 17, 2012.)
Previous quiz: Quiz: What's the connection... (February 14, 2012).
Next: Quiz: What is it? (October 31, 2012).More about ancient weathering... Plants may be bad for Earth climate (April 17, 2012).
More about calcite... An ancient navigation device? (April 16, 2013).
More dinoflagellates:
* Coral bleaching: how some symbionts prevent it (September 30, 2016).
* Is the warnowiid ocelloid really an eye? (October 12, 2015).More about lithium: What happens when a lithium ion battery overheats? (February 19, 2016).
For a video of a talk by Howard Spero (who took the picture shown above) on ancient climate records... Lecture videos: Berkeley City College (July 14, 2013).
My page of Introductory Chemistry Internet resources includes a section on Nuclei; Isotopes; Atomic weights. It includes a list of related Musings posts.
March 5, 2012
This is an interesting story at various levels. It is about how animals adapt to their environment, about how proteins need the right amount of flexibility, and about an unusual genetic trick.
We know that organisms can, to some extent, adapt to some range of conditions. This general statement about adaptation may refer to two distinct phenomena. It may mean that an individual can adapt to changing conditions. This is physiological or behavioral adaptation; think about how you adapt to the cold weather of winter as an example. It may also mean that types of animals -- or species -- are adapted to different conditions. This is typically a genetic adaptation. In the new work, scientists compare species of octopus that live in the arctic and those that live at warmer temperatures. They explore a particular aspect of the genetic adaptation of the species to their environments.
One aspect of adaptation to temperature deals with flexibility of proteins. Some proteins depend on flexibility for their function. In this case, they study proteins that form ion channels in the nervous system. The opening and closing of the protein channels is important for proper functioning of the nervous system. Like many things, proteins tend to become more rigid at lower temperature. Thus a protein that is good for a channel at moderate temperature might well be too sluggish to work well in the cold. So, they ask... Do the cold octopuses have slow nervous systems, or have they adapted, and if so, how?
What they find is a bit unusual. Indeed the cold octopuses have adapted to the cold. Their channels open about as well in the cold as the "controls" (i.e., as the channels from the warm octopuses at their natural temperature). However, when they look at the gene for the channel protein, it does not show changes that account for the difference. The usual process for making a protein is summarized by the "Central Dogma", DNA → RNA → protein. That is, the gene is encoded in the DNA, a temporary copy is made in messenger RNA (mRNA), and that is then translated to make the protein. That's not what happens in this case. What they find is that the DNA copy of the gene is very similar for both species. However, the cold-adapted species modifies -- "edits" -- the message before translating it. The editing changes certain A bases to look like G, thus changing their meaning. That is, in this case gene function is more complex that suggested by the simple "Central Dogma". It is now more like DNA → RNA → edited RNA → protein. (Splicing is another example of how the messenger RNA can be modified before being translated.)
They focus much of their work on amino acid number #321 in the protein. According to the gene, it is isoleucine; editing of the first base coding for this amino acid leads to it being valine. (Thus they describe the change as I321V.) This single change seems to have the largest effect.
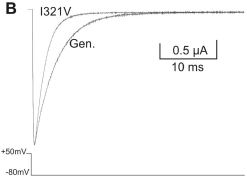
|
The graph shows how the I321V change affects the behavior of this channel protein. They make the measurement in a model system, in which frog eggs make the protein. The graph shows the current through the channel after stimulation. One curve ("Gen") shows what happens with the form of the protein coded for by the genes of an octopus from the Antarctic. the other curve ("I321V") shows what happen when there is a single change: that caused by the specific editing event. You can see that the editing causes the channel protein to close faster.
(In another part of the figure, they show that the channel coded for by the genes for Antarctic and tropical octopuses give almost the same closing rates.) |
That result shows that the I321V editing event helps the channel close faster -- a desired trait at low temperature. To see if this feature is common, they examine a variety of octopus species isolated from a wide range of water temperatures.
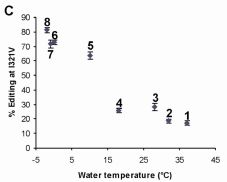
|
The graph shows the amount of RNA editing found at this position as a function of the water temperature where the octopus was isolated. You can see that the four octopus species isolated from colder waters (left) show a high percentage of RNA editing, whereas the four species from warmer waters (right) show a low percentage of RNA editing.
Interestingly, the two octopus species from California, #4 & 5, are one of each type. Octopus #4 is from southern California, whereas #5 is from northern California. |
Such RNA editing is a well-known process. The chemistry behind doing it, and how it changes the meaning are well worked out (see below). What's not clear is how bases are chosen for editing. Obviously, it is specific; certain A bases are changed. What's also not clear is why an organism would use this method of changing what a gene means. One might speculate that it is more flexible, in that the organism carries one gene but can make either of two products from it depending on the conditions. However, there is no evidence to support this as a reason -- and the question is really very much open. If nothing else, it stands as an example of the diversity of nature's tricks. And it opens up new questions for further work -- typical of good science.
|
Here is an idea of the chemistry of changing A to I. The figure shows the base part of three nucleosides: the two common ones at the sides, and the modified nucleoside I in the middle.
The primary change during RNA editing is changing the amino group (-NH2, upper left) of the A to a carbonyl group (C=O). The amino group is a hydrogen bond donor, but the carbonyl group is a hydrogen bond acceptor. It is very clear, then, that the base pairing properties are changed by converting A to I. You can also see that the I is similar to the G, especially at that position. The pairing properties of I are complex, but in this context, it tends to behave more like G. |
News story: Octopuses Rewrite Their RNA to Beat the Cold. (Science Now, January 5, 2012.)
* News story accompanying the article: Biochemistry: A Cold Editor Makes the Adaptation. (M Ohman et al, Science 335:805, February 17, 2012.) This includes a cute picture, as a summary. I don't think it is very clear, but if you read the legend and figure it out, it is nice.
* The article: RNA Editing Underlies Temperature Adaptation in K+ Channels from Polar Octopuses. (S Garrett & J J C Rosenthal, Science 335:848, February 17, 2012.) The first two figures above are Figures 1B and 4C from this paper. (The third, showing chemical structures, was made by me, using the drawing program Isis/Draw.)
A major follow-up story: RNA editing is a major contributor to protein diversity in cephalopod brains (June 3, 2017).
Other octopus posts include:
* Sleep stages in octopuses -- do they dream? (July 13, 2021). Includes an extensive list of posts about octopuses and other cephalopods.
* Why don't your arms get entangled or stuck together? (June 10, 2014).
* Octopus will only pay attention to television if it is "high definition" (August 20, 2010).
* The octopus and the coconut (December 28, 2009).A book, listed on my page of Books: Suggestions for general science reading. Sy Montgomery, The Soul of an Octopus -- A surprising exploration into the wonder of consciousness (2015).
More cephalopods... Deceiving a rival male (August 28, 2012).
More about ion channels: Making an artificial ion channel from DNA (January 8, 2013).
Some history of our understanding of how genes function: Central Dogma of Molecular Biology (August 16, 2011).
More from Antarctica: Life in an Antarctic lake (April 22, 2013).
March 3, 2012
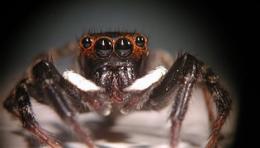
|
Hasarius adansoni, a jumping spider. Front view.
Such spiders catch their prey by jumping onto them from some distance. You can see four of the eyes. (It has eight in all.) The bigger middle pair are the principal eyes (PE); next to them are the anterior lateral eyes (ALE). The PE are sufficient for catching the prey. In fact, one PE is sufficient. This picture is from the news story listed below. It is similar to Figure 1A of the paper. |
What you can't see here is that the principal eyes have a retina with four layers of light receptors; therein lies the secret to catching dinner, according to a recent paper. Two of the layers are sensitive to green light, but of course the image can only be in focus in one place. What they suggest is that the spider uses the difference between the focused and defocused green-light images, on two retina layers, to measure distance. The theory of such a measurement is simple enough; it's a question of whether it is what the spiders do.
Their model predicts that the spiders would jump short in red light. Have a look at the following little video: 3-D Vision for Tiny Eyes in Hasarius adansoni: To Gauge Distance (YouTube, 1 minute). You may need to play it more than once to digest what it is showing, but I think you will find that it shows what they predicted. Of course, that is one example. Is it typical? Here are some detailed results, from Figure 3B of the paper...
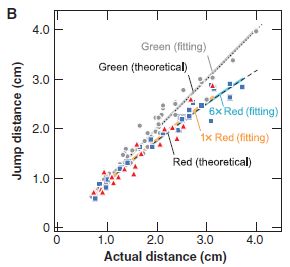
|
Each point is one test. The distance to the prey object is shown on the x-axis, labeled as "actual distance"; the distance the spider jumped is shown on the y-axis.
There are a lot of points, plus lines fitted to the data -- and theoretical lines. Let's simplify. Look at the upper right part of the graph -- for longer distances, where the effect is big enough to be clear. There are two clusters of points and lines. The upper one has a slope of about 1; that is, the spider jumps 4 cm when the prey is 4 cm away. The lower cluster has a lower slope; the spider jumps something less than 4 cm when the prey is 4 cm away. The upper one is for jumps with green light, the lower one is for jumps with red light. That is, under green light, the spider jumps are about right; under red light, the jumps tend to be short. The data says that is what happens, and the "theoretical" lines show that is what they expected. (Two different intensities of red light were used; it didn't matter.) |
So it seems, from actual measurements, that the spider can jump accurately under green light but not under red light. The effect is just what is expected if the key to depth perception, i.e., to measuring distance, is the defocused green-light image on one layer of the multi-layered retina.
News story: Jumping spider uses fuzzy eyesight to judge distance. (PhysOrg, January 27, 2012.)
* News story accompanying the article: Physiology: A Clearer View from Fuzzy Images. (M E Herberstein & D J Kemp, Science 335:409, January 27, 2012.)
* The article: Depth Perception from Image Defocus in a Jumping Spider. (T Nagata et al, Science 335:469, January 27, 2012.)
More about spider vision: How to seat a spider in front of the computer (September 28, 2010).
... and hearing: Spider uses an external antenna to enhance hearing (April 9, 2022).
More about jumping: Jumping -- flea-style (February 21, 2011).
March 2, 2012
You know the idea... You see something bright, and the pupils of your eyes contract. For example, you see one or the other of the following two pictures. Your pupils contract upon seeing the one at the left because it is brighter. Right?

Except it's wrong. The two pictures are equally bright. And yet, your pupils do contract upon seeing the one at the left. (Caution... How these appear on your computer screen may vary.)
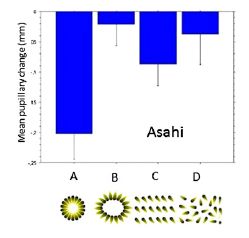
|
Here are some data, from a recent paper exploring this effect...
The graph shows the amount of pupil contraction when test subjects were presented with various pictures. Pictures A and B are the two shown above in this post. You can see that A, which we thought might be brighter, leads to greater pupil contraction: the bar goes down further. Separately, the scientists ask the subjects about the brightness of the two pictures. They say that picture A is brighter. Pictures C and D provide another test, with a similar, though smaller, effect. |
In part, this is a familiar story. We have here an optical illusion. Picture A appears brighter than picture B -- but is not. We are conscious of all this. We consciously choose to say that A is brighter, and eventually we consciously understand that it is an illusion. What is new here is finding that the reflexive action of pupil contraction is also affected by the illusion. Our conscious judgment is fooled; our reflex action is fooled.
News story: Optical Illusion experiment shows higher brain functions involved in pupil size control. (Medical Xpress, January 25, 2012.)
The article: Bright illusions reduce the eye's pupil. (B Laeng & T Endestad, PNAS 109:2162, February 7, 2012.)
The first figure above is reduced from one in the news story. The second is part of Figure 2 of the paper. (A small version of the first is also in the article, in various places, including Figure 2, above.)
Also see:
* Pupil dilation as an indicator of visual imagination (May 7, 2022).
* How flies perceive optical illusions (November 30, 2020).
* How to confuse a yeast -- a sensory illusion (January 15, 2016).
* Images from 30,000-year-old motion pictures (July 22, 2012).
* Bouba and kiki: A puzzler (April 12, 2011). It's not really related, but I keep thinking of it.
February 28, 2012
Life began. Somehow, somewhere, sometime. Beyond that, it is largely speculation -- and largely beyond our ability to test hypotheses. Nevertheless, the common view is that life began in the sea. Life is dominated by water, and there was a lot of sea. It seems a reasonable hypothesis.
A new paper is getting media attention, by offering a new hypothesis. The authors suggest that life started in geothermal pools -- something like those we might find nowadays in Yellowstone National Park (or other volcanically active areas). Their basic point is to note that the amounts of various minerals in modern life are more consistent with what is found in geothermal pools than in the sea. As an example -- perhaps their best example... All life uses a high ratio of potassium ions to sodium ions, K+/Na+. However, the oceans are rich in Na+ and low in K+. On the other hand, geothermal ponds are often relatively rich in K+. Thus the chemical composition of the ponds is more consistent with life than are the seas.
The paper raises some interesting points. However, most important is to recognize that it is presenting a hypothesis -- and there is probably little anyone can do to test it. So, I suggest that you enjoy the paper for its ideas, if you wish, but don't worry too much about it, or any other such paper suggesting how it might have been. As you read the paper, or the news stories, try to see what actual facts they have, how they interpret those facts, and what other interpretations are offered. In that way, this can be instructive, as well as fun. But don't expect an answer.
News stories:
* Debate bubbles over the origin of life -- Could life have originated in geothermal ponds? (Nature News, February 13, 2012.)
* Did Life's First Cells Evolve in Geothermal Pools? Based on some fundamental characteristics of cellular proteins, a team of scientists speculates that the last common ancestor of life on Earth got its start in the planet's natural hot tubs. (Scientific American, February 15, 2012.)
The article, which is freely available: Origin of first cells at terrestrial, anoxic geothermal fields. (A Y Mulkidjanian et al, PNAS 109:E821, April 3, 2012.)
More about geothermal areas... VPOW (July 14, 2010).
More about Yellowstone... Old Faithful Geyser: How does it work? (July 31, 2013).
More that may relate to the origin of life...
* The origin of life's chemicals: making an almost-Krebs-cycle in the lab (June 10, 2019).
* The origin of reactive phosphorus on Earth? (July 5, 2013).
* A novel type of polymer -- and its possible relevance to the origin of life (March 15, 2013).
February 27, 2012
The three major particles of the atom: the proton, electron, and neutron. It was only 80 years ago that that picture emerged. 80 years ago today, with the publication of a paper that notes "The difficulties disappear, however, if it be assumed that the radiation consists of particles of mass 1 and charge 0, or neutrons."
The basic idea behind the discovery is simple enough. Bombardment of beryllium-9 with alpha particles (nuclei of helium-4) led to making carbon -- plus a somewhat mysterious "radiation". The simple interpretation would be that the radiation was photons, but things just didn't add up right. The author says that this possibility "can only be upheld if the conservation of energy and momentum be relinquished at some point." Rather than relinquish those laws, he postulated the new particle.
We would now write the reaction as:
49Be + 24He →
612C + 01n
For each term, the leading subscript gives the atomic number (number of protons), and the leading superscript gives the mass number (which we now understand as the sum of the numbers of protons and neutrons). In the final term, the lower case n is used for the neutron. You can see that both subscript numbers and superscript numbers are conserved.
Three years later, James Chadwick received the Nobel prize in physics for the discovery of neutrons.
The article, which is freely available from the journal as part of a special feature of historic physics papers: Possible Existence of a Neutron. (J Chadwick, Nature 129:312, February 27 1932.) It's very short, just over a half page. Although it does have some technical complexities, I suspect that most readers will find much of it readable.
For those who want more... Chadwick published a more thorough case for the neutron later that year, and then a nice overview based on a public lecture the following year. The Wikipedia page on Chadwick gives little detail, but it links to those two papers, which are both freely available from the Royal Society. Wikipedia: James Chadwick.
* Previous post about a historical event: Quiz: What's the connection... (February 14, 2012).
* Next: Glenn Seaborg centennial (April 18, 2012).My page Internet resources: Miscellaneous contains a section on Science: history. It includes a list of related Musings posts.
More about neutrons: A new, simple way to measure bone loss? (September 14, 2012).
More about the nucleus:
* The proton -- and a 40 attometer mystery (March 17, 2013).
* Quark soup (August 15, 2011).The discovery of the neutron is also noted on my page of Introductory Chemistry -- Internet resources, in the section: Nuclei; Isotopes; Atomic weights.
February 26, 2012

|
The figure at left shows part of the experimental set-up used in a new paper in the Journal of Experimental Biology.
What do you think it is? |
Some readers, without examining the figure carefully, may naively suggest it is a zebra. That notion should be dispelled by looking at a more complete figure [link opens in new window]. (This figure and the one shown above are from the Horsetalk news story listed below.)
It should now be clear to you that the first figure is not a zebra but rather a model of a zebra. (The Hungarian countryside in the figures is real.)
The question at hand is why blood-sucking flies, known as tabanids or horseflies, don't pay much attention to zebras. The authors hypothesize that the coat pattern matters, and they even suggest why. The work consists, then, of two main parts. In the first part, they test directly whether the flies discriminate by the coat pattern. They find that stripes matter. Second, they explore why that is so. Let's look at some of their work on the first question.
|
Here are some of their data. This is Figure 3B from the paper. It's a complicated figure, so let's go slow.
The general plan was to test various materials, including the models shown above, to see whether horseflies were attracted to them. To measure this, the materials were made sticky, and they simply counted the number of flies that stuck. This is shown on the y-axis. (The time periods are not clear; I'll assume that key comparisons are over the same time periods.) A good place to start is with the four horizontal dashed lines. These are the results for the four models. The top line is for the black horse model, followed by the brown horse model. The lines for the white horse and the striped horse (i.e., the zebra) are very near the bottom. The striking result is that these last two are almost the same, even though the striped one is about half black. (For this part of the experiment, the x-axis has no meaning; the results are for the models, and are shown as horizontal lines for comparison.) |
|
The other curves are for various test patterns, with the data plotted versus the stripe width, shown on the x-axis. You can see that, regardless of the experimental details, there is a general pattern: with each curve, the number of flies stuck increases with the stripe width. Narrow stripes do not attract flies. As a specific example of one of their experiments... Compare the curve with open circles (yellow, the top curve) with the curve with open squares (maroon). The difference between the patterns used for these two cases was horizontal stripes (circles) versus vertical stripes (squares). You can see that the vertical stripes reduce fly attack. Of course, the main body stripes of zebras are vertical. The gray bar to the left marks the common stripe width of zebras. That is, zebra stripes are 7 cm and less. | |
Thus the overall conclusion is that the thin vertical stripes of a zebra reduce fly attack. In other parts of the work, they show that this may well be due to how the striping pattern reduces reflection of polarized light. The flies are attracted to polarized reflections; zebra striping minimizes such reflection.
Be careful to distinguish distinct aspects of this work. They show, in direct experimental work, that the striping pattern of zebras helps to protect them against a particular pest. We can question how completely they show this, but such questioning simply leads to more and better testing -- of something that is a straightforward factual matter. They also suggest that the protection was responsible for the zebras developing the striped coat. That is a stretch. They do not show that, and it is very hard to test. There may be many reasons why zebras developed stripes; perhaps this is one of them -- or perhaps not. It is speculative to say that it is. It is an interesting speculation, and perhaps a reasonable one, but not one that is proven, or likely will be tested. It may be a factual matter how zebras developed, but it is not something subject to direct observation or testing. You need to be careful to distinguish what is directly shown versus what is simply a speculation, no matter how reasonable that speculation might be.
News stories:
* Zebra stripes evolved to keep biting flies at bay. (BBC, February 9, 2012. Now archived.)
* Zebra stripes help deter horseflies, researchers find. (Horsetalk, February 10, 2012.) Now archived.
* News story accompanying the article: How the zebra got its stripes. (K Knight, Journal of Experimental Biology 215(5):iii, March 1, 2012.) For the pdf file, scroll down to page 3 for this item. It includes a cute cartoon summarizing the results.
* The article: Polarotactic tabanids find striped patterns with brightness and/or polarization modulation least attractive: an advantage of zebra stripes. (A Egri et al, Journal of Experimental Biology 215:736, March 1, 2012.)
A previous Musings post dealt with the issue of insects detecting water surface by light polarization: Aedes aegypti mosquitoes do not respond to polarized light when trying to land on water (May 22, 2010).
More about polarized light: Characterization of carbon nanotubes (December 3, 2013).
Another zebra that isn't: The artificial zebra (October 21, 2009).
More about horse colors: Leopard horses (December 2, 2011).
This work is discussed in a book listed on my page Books: Suggestions for general science reading. Grasset, How the Zebra Got its Stripes -- Darwinian stories told through evolutionary biology (2017).
February 24, 2012
Alzheimer's disease (AD) is a difficult disease to study. Diagnosis is often uncertain -- and commonly depends on autopsy. That is, there are many types of dementia; AD is only one of them. AD itself shows many biochemical and neurological changes; sorting out which are cause and which are effect -- and which are of little importance at all -- is difficult. In nature, AD is a slow disease; further, animal models are still of uncertain significance. A new paper offers a breakthrough in methodology; for now, the methodology is probably more important than the results.
What the authors did here was to make induced pluripotent stem cells (iPSC) from several people. Some had AD, some were controls with no known neurological problems. The AD patients were of two types. Some had a known mutation that increases the risk of AD; that is, they had what is called familial AD. Others had no known genetic risk; they had what is called sporadic AD. Making iPSC requires several steps... They first isolated skin cells (fibroblasts) from each person. They then "deprogrammed" these cells to the stem cell state, as iPSC. iPSC are cells that can be differentiated (reprogrammed) in the lab to make various kinds of specialized cells; that is what the p in iPSC means. In this case, they used the iPSC to make neurons. Thus, the overall result -- and the general strategy -- is that they made neurons from the various people, with various kinds of AD as well as "normal" controls. They can now study -- and compare -- these patient-specific neurons in the lab. A simple question is whether these lab neurons derived from AD patients show properties that relate to the disease of the individuals.
Let's start by looking at a (relatively) simple experiment.
|
In this experiment they measured the level of Aβ, a peptide commonly associated with AD. They measured it for fibroblasts (the original cell culture from patient cells, before deprogramming to iPSC), and they measured it for neurons (made from the iPSC). The results, on the y-axis, are shown on a relative scale. Results are shown for six patients: two each with familial AD (labeled APPDp, sporadic AD (sAD), and normal (NDC, which stands for non-demented control).
You can see that the results fall into two groups. For three patients, the levels are about 1 in both types of cells. For the other three patients, the levels are much higher in the neurons. The two control subjects are in the first group, as might be expected. Three of the four AD patients are in the second group, as might be expected. Perhaps oddly, one patient with sAD is showing results here that are more like normal than like the other AD patients. |
Thus this experiment shows that one common feature of AD patients can be demonstrated using lab-derived neurons. It also shows that patients vary in this feature, since the two patients with sAD give quite different results here. The significance of this finding is not clear at this point.
If you have followed this far, you have the main idea of the new work: the method holds promise. Now, let's look at a second experiment.
|
This experiment is much more complex, as must be obvious from a glance at the graph. (There are forty things plotted here!) So, let's go slowly, looking at some key points.
Results are shown here for four subjects (4 of the 6 discussed above). Fortunately for now, all gave similar results, so let's look mainly at one of them: patient sAD2, one of those with sporadic AD. |
|
The left hand frame of the graph is, once again, about the Aβ peptide; the y-axis shows the amount of this AD-associated peptide. There are five bars on the graph for this patient for this peptide. The first one is a "control", showing the "normal" level made under these conditions (the lab-derived neurons). The other four bars involve use of inhibitors, which reduce the production of Aβ. There are two steps to making Aβ; the first two bars are for inhibitors of one step, and the next two bars are for inhibitors of the other step. All four bars for tests with inhibitors show less Aβ. Makes sense... Inhibitors of steps needed for production of Aβ reduce production of Aβ. Now look at the right hand part of this figure. Here they measure an enzyme that is thought to be part of the disease process. More specifically, they measure what fraction of it is in an active form; the conversion between active and inactive enzyme is a known process, of interest. Again, just look at the one patient, sAD2. There are five bars, as before -- same conditions. The first (to the left) is high, the next two are low, the final two (to the right) are high. That is, inhibitors of the two steps are behaving differently here. Inhibition of one step reduces the amount of active enzyme, but inhibition of the other does not. Another way to look at this is to compare the two frames. The five bars for Aβ peptide (left frame) for sAD2 could be described simply as high-low-low-low-low; the five bars for active enzyme (right frame) are high-low-low-high-high. The amount of Aβ peptide does not correlate with the amount of enzyme; they disagree for the right hand two bars, which are for one step of making Aβ. If you start with the idea that the peptide is important in controlling the amount of active enzyme, this is a surprising result. I focused above on one patient, sAD2. You can see that the results for the other AD patient were similar. The two subjects to the left are controls. They have lower levels of both peptide and enzyme, as expected. The effects of the inhibitors seem qualitatively similar with the control subjects. | |
So this second experiment also yields a surprise. Aβ peptide is a famous marker associated with AD, but no one really knows what its role is. The results with one inhibitor of its production complicate this further. What does it mean?
The current paper presents a new approach to studying AD. The results in this first paper show that this approach will yield new information. Some of the information is simple: a common AD characteristic is observed in these patient-specific lab-derived neurons. On the other hand, it is clear that the two patients with sporadic AD are different, and the results with inhibitors raise new questions about the role of the Aβ peptide. There is plenty more to do, but a new tool is available.
News story: Alzheimer's Neurons from Pluripotent Stem Cells: First-Ever Feat Provides New Method to Understand Cause of Disease, Develop Drugs. (Science Daily, January 25, 2012.)
The article: Probing sporadic and familial Alzheimer's disease using induced pluripotent stem cells. (M A Israel et al, Nature 482:216, February 9, 2012.) The figures above are parts of Figure 2 of this paper: part b and a portion of part g.
More about Alzheimer's disease:
* A drug trial to prevent Alzheimer's disease (May 23, 2012).
* Insulin as a treatment for Alzheimer's disease? (January 28, 2012).More about using stem cells to study the brain: Artificial brain-like structures grown from human stem cells in the lab (October 1, 2013).
Posts on stem cells. They involve different types of stem cells and different uses.
* Using stem cells to study a heart condition (April 19, 2011). This post deals with studying a heart condition with the same type of approach, that is, with patient-specific iPSC.
* Cardiac stem cells as a treatment for heart damage: preliminary results are "very encouraging" (November 29, 2011). This post deals with the use of stem cells therapeutically. The cells here, too, are patient-specific, but they have undergone minimal treatment outside the body. That is, heart stem cells are isolated from the patient, grown up ("expanded") in the lab, and then given back to the patient.
* The role of the immune system in making stem cells (February 8, 2013). Progress in understanding how iPSC are made.The following is an older post on stem cells. It discusses -- and diagrams -- a variety of stem cells types and processes. Do you need some new brain cells? (March 22, 2010).
I have more on stem cells on my page Biotechnology in the News (BITN) - Cloning and stem cells. My BITN page for Other topics includes a section on Alzheimer's disease. Both contain listings of related Musings posts.
February 21, 2012
| Original post: Quiz: What's the connection... (February 14, 2012). As a reminder, the quiz presented the pair of figures shown at the right, and asked a question about them. |

|
|
| The question... What is the connection between the movie star sometimes called "the most beautiful woman in the world" (above, left), the self-styled "bad boy of American music", and the US patent (excerpt above, right) that established an approach for using multiple frequencies for secure wireless communication? | ||
I have updated the original post to include the "answer", with source information. Go to the original post: Quiz: What's the connection... (February 14, 2012).
February 20, 2012
This is a very simple story -- one that is very complex.
The simple story is that the likely cause of a 2009 outbreak of food poisoning, has been found: contaminated uncooked cookie dough, in commercial ready-to-bake products. It is thought likely that the flour in the cookie dough was the actual culprit, though there is no direct evidence on the point. (The actual toxic ingredient is a type of E coli bacteria, known as O157:H7, that makes a toxin. The toxin can be deadly.)
Ok, so cookie dough is contaminated. Maybe we need to tell people it is not safe to eat raw cookie dough. It's not supposed to be eaten raw, but I suppose it is human nature that people will do so. Maybe cookie dough manufacturers should work out a process for a safer cookie dough. They probably could. All this seems straightforward to deal with.
However, if flour is the underlying culprit, does this mean that all use of flour is suspect? We don't eat a lot of raw flour, but there is a lot of flour around. It's dusty, too, so we probably inhale it. This part of the story is quite unclear; hopefully it will get attention. The good news, perhaps, is that the whole event was relatively small. So we should not worry too much, for now. On the other hand, the best time to start addressing a problem is when it is small. That is why public health authorities try to understand every food poisoning event they can; it is part of surveillance, to help prevent more problems.
News story: Ready-To-Bake Cookie Dough Not Ready-To-Eat, Study of E. Coli Outbreak Finds. (Science Daily, December 9, 2011.) This is an excellent overview. I really suggest that everyone read this news story. The point of this post is to raise a complex issue; the news story discusses it very well. There is no need to get into the details of the data; more important than the results are the implications.
The article: A Novel Vehicle for Transmission of Escherichia coli O157:H7 to Humans: Multistate Outbreak of E. coli O157:H7 Infections Associated With Consumption of Ready-to-Bake Commercial Prepackaged Cookie Dough -- United States, 2009. (K P Neil et al, Clinical Infectious Diseases 54:511, February 15, 2012.)
Another post about E coli O157:H7... A vaccine to make food safe (December 15, 2009).
More on food poisoning...
* Killer chickens (December 2, 2009).
* Possible transmission of norovirus via reusable grocery bag (May 21, 2012).
February 18, 2012
It's a real concern -- if you are a baby spider weighing five micrograms (5 µg).
A new paper deals with where spiders keep their brains. It's a cute story, but also includes some issues of broad biological interest.
It's long been known that the brain (the central nervous system, CNS) is larger -- relative to the whole body -- in smaller animals. Ants have brains that are several times larger -- relative to body mass -- than humans do. It's also known that the brain is one of the most energy-consuming organs. Thus smaller animas spend a larger fraction of their energy budget on brain than do bigger animals. From both of these issues, we see that small animals might have a brain problem: they might have trouble finding room for it, and they might have trouble feeding it. Is there indeed some limit? Is there some point at which the usual trend of brain size vs body size breaks down for very small animals? If so, is there some ill consequence for the animals, compared to its larger relatives?
The new study examines several species of web-weaving spiders -- varying in body mass by a factor of a million. The smallest is about 5 µg -- a baby. Interestingly, the brain is about as big as you expect from the general trend -- even though it is so big it won't fit in the head.
|
The figure at the left (Figure 7 from the paper) shows some results. The graph shows brain size vs body mass for a range of spiders. You can see there is a general trend, so let's look more carefully.
Brain size is shown on the y-axis, as percent of the "head" occupied by the CNS. Body mass (milligrams) is shown on the x-axis, on a log scale. The x-scale is labeled with the logarithms: -2 means a mass of 10-2 = 0.01 mg (or 10 µg); +2 means 102 = 100 mg. The solid line shows the trend line for all the spiders examined; the dashed line shows the trend line for the adults. You can see that the trends seem rather good. In fact, at the low end, one point is very much above the trend line! |
A major part of the paper is anatomical observations of the spiders. The key finding is that for the very small spiders, the brain (CNS) extends beyond the head region.
This works speaks to the importance of the brain. Even when the expected brain exceeds what one would think would be possible, it is there. Something else gives. In this case, it is "body plan".
News story: Whole New Meaning for Thinking On Your Feet: Brains of Small Spiders Overflow Into Legs. (Science Daily, December 12, 2011.)
The article: The allometry of CNS size and consequences of miniaturization in orb-weaving and cleptoparasitic spiders. (R Quesada et al, Arthropod Structure & Development 40:521, November 2011.)
Also see...
More on body size relationships:
* The smallest frog (January 31, 2012). In that post we raised the issue of what the lower limit might be for the size of a vertebrate. We had no answer, but did see that limb function was likely poor in the tiny frogs.
* More on parasitic flies... TIGER discovers smallest known fly; does it live in the head of tiny ants? (July 31, 2012).Recent spider posts include:
* Spider silk: Can you teach an old silkworm new tricks? -- Update (February 11, 2012).
* How the spider avoids being attacked by the ants (January 10, 2012).More spiders: The spider with the mostest ... (and such) (January 2, 2018).
* A recent post about brains: Insulin as a treatment for Alzheimer's disease? (January 28, 2012). We even noted there that "the brain is a major site of glucose metabolism".
February 17, 2012
|
Sudoku puzzles challenge the player to fill out a 9x9 grid of numbers, according to game rules, starting with some clue numbers that are provided. The question is, what is the minimum number of clues needed -- to give a game that has a unique solution? We now have a proof that it is 17. That is, a 16-clue puzzle is impossible.
|

|
The Sudoku puzzle is math. There is nothing subjective about whether a solution is valid. So, designing or solving a Sudoku puzzle should be something a mathematician -- or a computer program -- can handle. Yet it turns out to be hard to answer what might seem to be a basic question: what is the minimum number of clues needed.
There is a simple logical argument that seven clues is not enough. With seven clues, the set of clues has no instances of two of the numbers. (For example... Imagine that the seven clues are one each of the numbers 1 through 7. Then there is no 8 or 9.) Any solution to the puzzle could be changed into another solution simply by reversing all cases of those two numbers (8, 9 in my example). Thus, seven clues cannot give a puzzle with a unique solution.
Ok, so a seven-clue puzzle is impossible. But experience with the puzzles has suggested that there are no 16-clue puzzles. (Many 17-clue puzzles are known.) There is a big gap between 7 and 16! The new paper proves (claims to prove) that there are no 16-clue puzzles. They do not do this by elegant mathematical logic, but by brute force. They simply examine all possible cases, and find no valid 16-clue puzzles.
Now, they do some elegant simplification along the way. For example... There are 6,670,903,752,021,072,936,960 possible completed solutions. (That's about 7x10²¹ -- or about a hundredth of a mole!) But some solutions are equivalent. Switching the first and second rows gives equivalent grids; if one of them requires a certain number of clues, so does the other. By extensively looking for such equivalences, they reduce the set to only 5,472,730,538 (about five billion) grids that need to be checked. That is quite a reduction. For each of those, they then check whether any set of 16 clues would give a valid game. Once again, they simplify by noting that some sets of clues would be equivalent. Still, in the end, they brute-force check all the possible choices; it takes something over seven million hours of CPU time. The finding: no possible set of 16 clues gives a valid game.
The authors review previous attempts to solve the problem, including some simple logical arguments that are suggestive, and including some alleged proofs that turned out to be invalid. They detail their logical approach, such as how they reduce the set of grids to be checked. They argue that their approach is applicable to other problems. These aspects of their approach may make this interesting to those beyond Sudoku.
News stories:
* Mathematician claims breakthrough in Sudoku puzzle -- Puzzles must have at least 17 clues to have a valid solution. (Nature News, January 6, 2012.)
* Mathematicians Solve Minimum Sudoku Problem -- Sudoku fanatics have long claimed that the smallest number of starting clues a puzzle can contain is 17. Now a year-long calculation proves there are no 16-clue puzzles. (Physics arXiv blog, from the MIT Technology Review, January 6, 2012.)
The article is freely available at: There is no 16-Clue Sudoku: Solving the Sudoku Minimum Number of Clues Problem. (G McGuire et al, arXiv, January 1, 2012.) (I do not know whether this is intended for formal publication. The arXiv serves as a repository for informal publications, as well as previews.)
Back to that puzzle shown above. It has 17 clues. It is shown in the paper as an example of a 17-clue puzzle. However, in the discussions following the two news stories, someone notes that this is not a valid puzzle -- that it does not have a unique solution.
This is a reminder to clarify a couple points. The story here is that there is no possible 16-clue puzzle. That does not mean that all puzzles with 17 clues are valid. And it does not mean that any completed puzzle can be presented with 17 clues.
February 14, 2012
|
|
|
| What is the connection between the movie star sometimes called "the most beautiful woman in the world" (above, left), the self-styled "bad boy of American music", and the US patent (excerpt above, right) that established an approach for using multiple frequencies for secure wireless communication? | |
I realize this has all the makings of a bad joke. But it isn't a joke at all, and it is not dependent on any movie knowledge.
Answer (and sources) next week. [See immediately below.]
* * * * *
Answer (posted February 21, 2012):
Simple answer: they did it. Here are the basic facts... The movie star is Hedy Lamarr. The musician is George Antheil. The patent is US Patent Number 2,292,387, "Secret Communications System", awarded August 11, 1942 to Hedy Keisler Markey and George Antheil. To complete the story, you need to know that Hedy Keisler Markey was the then-current married name for the person known professionally as Hedy Lamarr.
Thus we see that this historic invention was developed by a movie star and a composer. There is no connection between Lamarr's work in the two fields; her interest in weapons and communications came from her personal life story, and is discussed in the readings listed below. However, for Antheil there is a direct connection between his music work and the patent. The specific mechanism proposed here involved using punched tapes -- just as used for player pianos. Some may recall Antheil's famous Ballet Mecanique -- in which he tried to synchronize 16 player pianos. Compared to that, synchronizing one torpedo and its controller perhaps seemed a simple task.
The pictures are from the following web pages, both of which are worth reading for this story.
* The picture of Hedy Lamarr, from the 1941 movie Come Live With Me, is from: Wikipedia: Hedy Lamarr.
* The patent excerpt is trimmed from one shown at: Great Inventors: 1940's Film Goddess Hedy Lamarr Responsible For Pioneering Spread Spectrum. (America's Inventor - Online Edition. Now archived.)
If you would like to see the full patent, put the patent number into a search engine. One source is US Patent 2,292,387.
There is a new book about Hedy Lamarr and her invention. It is Hedy's Folly: The Life and Breakthrough Inventions of Hedy Lamarr, the Most Beautiful Woman in the World, by Richard Rhodes. I recently heard an interview with author Rhodes; that is how I learned of this topic.
For a short version of Antheil's Ballet Mecanique: YouTube: Ballet Mecanique. (10 minutes.) This is from a performance at the National Gallery of Art, Washington, DC, 2006. There are a lot of instruments on stage -- with no people playing them. Something about a LEMUR being involved. For more about the performance: Ballet Mecanique at the National Gallery of Art. (Now archived.)
Earlier post that included a ballet: Animals counting -- more (July 13, 2009).
More about this invention... National Inventors Hall of Fame: 2014 inductees (March 11, 2014).
More about wireless: From WiFi to WiSee (June 18, 2013).
More about computer security: Can computers talk to each other? Could it be a new type of security threat? (June 18, 2014).
* Next quiz: Quiz: What is it? (March 6, 2012).
* Previous quiz: Quiz: The monkey-cat (October 26, 2011).Next "What's the connection" post: What's the connection: rotten eggs and high-temperature superconductivity? (June 8, 2015).
Other history posts:
* Next: Discovery of the neutron: 80th anniversary (February 27, 2012).
* Previous: Benjamin Franklin and the electrical kite (November 22, 2011).My page Internet resources: Miscellaneous contains a section on Science: history. It includes a list of related Musings posts.
Also see... Hybrid formation between organisms that diverged 60 million years ago (May 8, 2015).
February 13, 2012
We noted that the space probe Rosetta flew by the asteroid Lutetia: Rendezvous with Lutetia (August 14, 2010). At that point, shortly after the encounter, we simply had some striking pictures -- including the one featured in that post, with Saturn in the background. Last October, the ESA scientists published a series of three papers presenting data from the encounter, and offering some interpretation of what they have learned about Lutetia. (ESA = European Space Agency.)
Here is a brief discussion of some findings from one of those three papers. The key ideas are that they are able to estimate the density and the age of this rock -- and both of those tell interesting stories. How do they make those measurements, and why are they interesting?
Density is mass per unit volume. Mass is directly involved in gravitational attraction. In this case, they measure the tug on the spacecraft as it goes by Lutetia; from that they can calculate the asteroid's mass. Volume is a geometry problem; the calculation is made difficult by the irregular shape, but they do the best they can, helped by the multitude of pictures. They end up with an estimate that the density of Lutetia is about 3400 kilograms per cubic meter. For those who think in more common chemistry units, that is 3.4 g/cm3. What does that mean? Well, the density of ice is about 1 g/cm3; it's clear that Lutetia is not a ball of ice. It's really a rock. In fact, with a density of 3.4 g/cm3, it must have quite a bit of iron, the common high density material of the solar system. Thus the density is a window onto the composition of astronomical bodies.
Age? Just look...
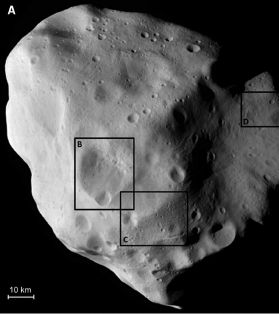
|
An image of the asteroid Lutetia, at Rosetta's closest approach. At that point, each camera pixel represented about 60 meters; thus the scale bar shown would be about 160 pixels.
The most prominent features, aside from the irregular shape, are the multitude of craters, with a wide range of sizes. Note that Box B marks a single large crater -- 21 kilometers in diameter. This is Figure 2A of the article. Larger picture [link opens in new window]. This is the "large" version of the figure available from the journal web site. For part A, it is about half of full resolution of the original picture. It also includes the other parts of the figure, which show other views of the boxed regions. |
From the cratering, the scientists are able to estimate the age of the object. More specifically, they estimate the age of the surface of the object. This is a complex analysis, and uses information both about the number of craters and their size distribution. The simple story is that this complex, highly-cratered surface is very old -- probably dating back to the early days of the solar system. It also shows signs of landslides, with pulverized rock on parts of the surface.
Putting together all they learned, including the points noted above, they reach an interesting conclusion about Lutetia. They suggest that it is a primordial body -- formed very early in the development of our solar system. It has been hit, but it has remained as a distinct body. This contrasts with other asteroids studied so far, which are thought to be products of collisions, or "rubble piles" of loosely-aggregated pieces.
News story: Asteroid Lutetia: Primitive Body from Solar System's Planet-Forming Period. (Science Daily, October 28, 2011.)
The article: Images of Asteroid 21 Lutetia: A Remnant Planetesimal from the Early Solar System. (H Sierks et al, Science 334:487, October 28, 2011.) (The other two articles on the Lutetia encounter immediately follow in the journal.)
Other asteroid issues...
* What has six tails -- and is beyond Mars? (November 20, 2013).
* Mining asteroids? (April 29, 2012).
* NEOShield: defense against Earth being hit by an asteroid (February 6, 2012).Rosetta's next adventure: Twins? A ducky? Spacecraft may soon be able to tell (August 4, 2014).
More from Rosetta: The universe -- as viewed from comet 67P/Churyumov-Gerasimenko (June 19, 2018).
More on planet formation... The youngest (known) planet? (October 30, 2011).
More craters... Mars: craters (August 11, 2012).
More landslides... How hot is a landslide? (April 16, 2019).
February 11, 2012
Original post: Spider silk: Can you teach an old silkworm new tricks? (October 13, 2010). We noted an announcement of developing a method for making spider silk in silkworms. At that point, all we had was a press release; now we have a published scientific article.
The article confirms the key points made earlier. It includes technical details, and data on the properties of the silk. The general point is that the silk is stronger than the native silkworm silk. The ScienceDaily story notes that they have a commercial venture to develop the product.
|
An example of their results measuring the mechanical properties of various silks. This is Figure 4 from the article.
In this test, they pull on a fiber, and measure its length. The pulling force (per unit area -- the cross-sectional area of the fiber) is called the stress, and is shown on the y-axis. The stretching of the fiber is called the strain, and is shown on the x-axis as percentage increase in length. The curve stops when the fiber breaks. (Yes, the usage of the two axes is backwards from what you might expect.) |
|
The lower curve, in blue and labeled pnd-w1, is for the natural silkworm silk. You can see that the stress-strain curve has distinct parts. At low stress, there is a regular stretching (strain). Then, as the stress approaches 200, the curve flattens: there is much stretching for small increases in stress. And then it breaks, at a stress of about 200. The red curve is for natural spider silk. The other three curves are for various types of spider silk made by the engineered silkworms. A simple point is that all of the spider silks made in silkworms can withstand a higher stress before breaking than the native silkworm silk. It also looks like they all stretch less at low stresses than the native silkworm silk. They note that fiber quality varies; the results shown here are "best case". | |
The most important part of this is probably establishing "proof-of-principle". They have developed methods to make genetic variants of the silkworm, able to make new types of silk. Whether the particular product they are now making turns out to be worthwhile (and that includes the economics of its production), they have opened the door to making novel silk-type proteins using a remarkable machine, one of mankind's great inventions -- the silkworm.
News stories:
* Silkworms spinning spider webs. (PhysOrg, January 3, 2012.) Note the misleading title. The silkworms do not make spider webs; they make spider silk -- for their cocoons. In fact, making webs is an inefficient way to make silk -- from our viewpoint.
* Hybrid Silkworms Spin Stronger Spider Silk. (Science Daily, January 6, 2012.)
The article: Silkworms transformed with chimeric silkworm/spider silk genes spin composite silk fibers with improved mechanical properties. (F Teule et al, PNAS 109:923, January 17, 2012.)
More about spiders:
* Bat meets spider (March 29, 2013).
* What to do if your brain won't fit in your head (February 18, 2012).More on spider silk:
* Stabilizing broken bones: could we use spider silk instead of metal plates? (June 24, 2018).
* Spiders and violins (May 4, 2012).More on silk: How do you get silkworms to make stronger silk, reinforced with graphene? (October 24, 2016).
More on stretching things: Stretchable electric wires (January 22, 2013).
Several Musings posts about silk are listed on my page Internet Resources for Organic and Biochemistry under Amino acids, proteins, genes.
February 10, 2012
Big earthquakes catch our attention. They make the news media with international coverage, and some cause huge human and economic losses. Those of us who live in areas at high risk for major quakes may take particular notice of these events. (A major fault runs through the UC Berkeley campus.)
There have been several super-quakes in recent years: 5 of magnitude M ≥ 8.5 since 2004. Is this a trend -- a trend of concern? Two recent papers report statistical analyses of large quakes, and say there is no trend.
|
The raw data. The graph shows the major earthquakes that have occurred. Each circle is one quake. The magnitude is shown on the y-axis. The x-axis is year, with the tick marks ranging from 1900 at the left to 2010 at the right. This is Fig 1A from the Shearer & Stark paper. To be more precise, this graph includes only "primary" events; it excludes quakes considered aftershocks or foreshocks.
As an exercise, cover the lower part of the graph. For example, cover everything below magnitude 8. Does it look like there might be a pattern? |
|
The following table gives an example of their analysis. |
|
|
This part of the table deals with quakes of magnitude ≥ 7 ("Magnitude threshold", left hand column).
The second column ("Removed") shows what part of the total data set is being analyzed. For the first row, "none" have been removed; the complete set is analyzed. Then aftershocks (AS) are removed, and then foreshocks (FS) are also removed. The next column ("Events") tells how many quakes are in the data set at that point. You can see that simply removing the AS removes more than half the quakes; removing both AS and FS removes more than 2/3 of them. That is, seismologists already know that some of the quakes are related. The question is whether there is any pattern to the others -- to those where we do not already know there is a connection. To test for such a relationship, they make a null hypothesis that there is no such relationship. They then run three tests of that hypothesis. The p values are presented in the final three columns, to the right. For the full data set, very low p values are obtained; in fact, p = 0 for two of the tests. The null hypothesis is rejected; there appears to be some relationship. But we already know that: the full dataset in the first row contains known related quakes -- lots of them. Removing those known related quakes -- in the next two rows -- leads to p values that are relatively high. Once we remove the known related quakes, there is no reason to reject the null hypothesis. Thus the analysis provides no evidence for any hidden relationship. The table above is part of Table 1 from the Shearer & Stark paper. The rest of their table shows the same type of analysis for larger quakes, with magnitude thresholds of 8 and 8.5. For those sets, with larger quakes, there are fewer events -- and smaller fractions of them are AS or FS. The overall picture is the same: there is no reason to reject the null hypothesis; there is no support for invoking hidden relationships. |
What does this mean? What the statistics show is that there is no evidence to reject the null hypothesis that the quake distribution is random. That is, this is not a proof that there is no effect; rather, it is an analysis that shows no evidence for an effect, as best we can tell -- and excluding the "obvious" related cases (AS and FS).
What is the significance of the issue? It is most important to the geologists trying to understand earthquakes. The idea that one earthquake may trigger another is accepted; what is not clear is the range over which this might act.
Paper 1
News story: Big quakes no more likely than in past: study. (Phys Org, December 19, 2011.)
* Commentary accompanying the article: How many great earthquakes should we expect? (G C Beroza, PNAS 109:651, January 17, 2012.)
* The article, which is freely available: Global risk of big earthquakes has not recently increased. (P M Shearer & P B Stark, PNAS 109:717, January 17, 2012.)
Paper 2
Announcement: Spate of Large Earthquakes Not Related. (USGS (United States Geological Survey), November 7, 2011. Now archived.)
The article: Random variability explains apparent global clustering of large earthquakes. (A J Michael, Geophysical Research Letters. 38:L21301, November 2, 2011.)
An earlier post addressed a variation of this question: Earthquakes: increasing? (March 30, 2010). The current post is entirely consistent with that, but with more information -- and published papers.
Other posts on earthquakes include:
* Could we block seismic waves from earthquakes? (June 23, 2014).
* The Quake-Catcher Network: Using your computer to detect earthquakes (October 14, 2011).Other large-scale risks... How frequent are volcanic eruptions that are truly catastrophic? (April 10, 2018).
February 7, 2012
Briefly noted...
|
A recent post was about the food web involving pythons and humans -- and by extension other animals in their size range: Snakes and humans: who eats whom? (January 23, 2012). The context there was a remote area of the Philippines and a traditional hunter-gatherer tribe. A week after that post we get a new paper dealing with pythons in the US, in the Everglades of southern Florida. It's the same type of python, the large Burmese pythons. The paper reports the explosive growth of the python population there -- and what appears to be corresponding severe declines in the populations of small prey in the area. It's a classic case of an ecological system being challenged by a sudden change, in this case introduction of a non-native (or "invasive") organism.
At the right... A little python. It is held by one of the authors of the paper. (I don't know how old it is. Apparently they are 18-24 inches long at birth.)
|

|
The python problem is not simply an issue for remote areas. Nor is the broader issue of non-native species.
News stories. Both of these give a good overview of what the paper finds, and of the problem.
* Pythons linked to Florida Everglades mammal decline. (BBC, January 30, 2012.)
* Severe Declines in Everglades Mammals Linked to Invasive Pythons, Researchers Find. (Science Daily, January 31, 2012.)
The article, which is freely available: Severe mammal declines coincide with proliferation of invasive Burmese pythons in Everglades National Park. (M E Dorcas et al, PNAS 109:2418, February 14, 2012.)
For more from Florida...
* Grapefruit and medicine (March 26, 2012).
* A small perk when living in Florida -- more (December 11, 2009).More about invasive organisms... How an American weed might interfere with control of malaria in Africa (November 13, 2015).
February 6, 2012
I'm not a big fan of simply announcing that we will study a problem; all too often, that is a delay tactic. However, in this case, it may be a serious useful step.
We have noted the problem of astronomical bodies, such as asteroids, colliding with Earth, with the potential of catastrophic damage. The announcement that the European Union (EU) is undertaking a serious scientific study of the threat from near earth objects (NEO) and what we might do about it seems worth noting.
News story: NEOShield to assess Earth defence. (BBC, January 20, 2012.)
An example of a post on collisions of asteroids with earth: Gravity tractor: protection from asteroid collisions (October 26, 2009). The gravity tractor is one option discussed in the news story listed here.
Other asteroid issues...
* An asteroid alert (February 11, 2013).
* Mining asteroids? (April 29, 2012).
* Lutetia: a primordial planetesimal? (February 13, 2012).
February 5, 2012
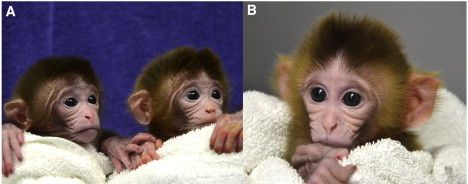
|
|
There they are. From the left: Roku, Hex, and Chimero. Age: 7 days.
4 Roku and Hex shared a womb; in that sense, they are twins. "Roku" means "six" in Japanese; "hex" means "six" in Greek; The figure here is Figure 3 parts A and B from the paper. |
A chimera is an individual that contains a mixture of genetically different cells -- from different zygotes. I suppose that a person who has received an organ from another individual is a chimera. In modern biology, making chimeric mice is common. To do that one injects embryonic stem cells (ESC) into an early stage embryo, called a blastocyst. (The movie listed below with the article illustrates this.) The injected cells mix with the blastocyst cells, resulting in a mouse containing cells of both types. This is useful because one can introduce new features by modifying the ESC before using them. The chimera itself, as a mixture, is not useful; however, gametes are of one cell type or the other, so breeding of the chimera leads to some animals carrying the modification. Thus making chimeras is one step in lab work introducing new mutations into mice.
Attempts to carry out the same procedure in monkeys have largely failed. A new paper confirms that, but shows that one can make chimeras in rhesus monkeys by going to an earlier stage of development. Their basic procedure is to fuse embryos at the 4-cell stage. In various experiments, they fused 3-6 such embryos. They did various analyses on them, but some were implanted in a surrogate mother, and two such mothers gave birth to live offspring: those results are shown in the picture above.
How do we know that these animals are chimeras? Of course, that was the intent -- the experimental design. Multiple embryos were fused; the idea is that the cells of those multiple embryos somehow form one animal. But how do we tell what actually happened? The key idea is that the embryos used to form the chimera can be distinguished; they test the resulting chimeric animal, and show that it has features from multiple parents. For example, embryos might contain different DNA markers.
It is not at all clear what the implications are of this work. Making chimeras per se is not a particularly useful result. What makes the work with mouse chimeras so useful is that it uses ESC, which can be grown and modified in the lab while still preserving their ability to function normally when returned to a blastocyst. So far, this cannot be done with the monkeys. Can the cells from the 4-cell stage be similarly grown and modified, and still preserve their ability to resume normal growth? Perhaps, but probably not. Will further analysis of this system, which now includes one way that does work to make a chimera, lead to better understanding of the entire reproductive system, and then to the ability to make chimeras using ESC? We'll see.
News stories:
* World's first chimeric monkeys are born. (PhysOrg, January 5, 2012.)
* Meet Roku, Hex, and Chimero, the World's First Chimeric Rhesus Monkeys. (GEN, January 6, 2012. Now archived.) This replaces a story listed previously, which is no longer freely available.
* News story accompanying the article: Chimeric Primates: Embryonic Stem Cells Need Not Apply. (A Trounson & U Grieshammer, Cell 148:19, January 20, 2012.)
* The article: Generation of Chimeric Rhesus Monkeys. (M Tachibana et al, Cell 148:285, January 20, 2012.)
There is a video file with the article; look for "Supplementary Content", at upper right. The movie has two parts. The first shows how one injects embryonic stem cells into the blastocyst. Remember, this method did not work for the monkeys. Nevertheless, the method is used with other animals, and what the movie shows is useful. The second half of the movie shows another injection.
Other posts about chimeras include:
* Unusual twins: neither monozygotic nor dizygotic, but... (March 11, 2019).
* Using human stem cells to make chimeras in pig embryos (February 25, 2017).
* On his right side, he is female (April 24, 2010).
* Children with two fathers (January 3, 2011).
* Male DNA found in human female brains (October 8, 2012).
Other posts about monkeys:
* Do monkeys make stone tools? (December 18, 2016).
* Prejudice against outsiders -- in monkeys (May 10, 2011).
* Speech: Taking turns (August 17, 2011).
* A newly described monkey species (October 22, 2012).
February 4, 2012
The clinical trial is a key part of the process by which we learn whether a new drug works, and is safe. (Similar trials are done for medical devices.) The details need not concern us here; what is important is the idea: a formally proposed and executed plan to test the new medical advance. Our understanding of a drug comes from integrating the information available from all the trials. However, this assumes that we know all the results -- assumes that the trials that people go to such great trouble and expense to conduct -- are reported.
Lack of publication of clinical trial results has long been a problem. Sometimes people think that lack of publication involves bias; for example, a company might report a trial only if it turned out favorable to their product. A few years ago, a registry for clinical trials was started in the US. Only trials that have been registered at the start can be published. That prevents people from doing a secret trial, and publishing only if they like the results.
We now have a flurry of new analyses, which show that many clinical trials are still not getting reported. It's not a simple issue of bias. Company-funded trials have a better publication rate than publicly-funded trials. When results were recovered for a number of trials, there was no evident bias that the missing results were favorable or unfavorable. It's just that trials are not getting published, thus leaving us with less than the best information about a drug.
It's a problem, and there seems no simple solution. I hope this post makes you aware of the problem.
A good place to start is to read a scathing editorial in the BMJ (British Medical Journal), which accompanies a set of papers: Missing clinical trial data -- A threat to the integrity of evidence based medicine. (R Lehman & E Loder, BMJ 344:d8158, January 3, 2012.) It's two pages -- densely packed with a summary of the papers -- and the authors' opinions. The main thrust of their opinions is clear from the extended title I showed here. If you want more, click on the "related content" tab, or go directly to "related content" for the editorial; it links to the individual papers. All the BMJ items are freely available.
One of the papers in the set was noted by Science Daily, along with the editorial. If you'd like...
* News story: Many NIH-Funded Clinical Trials Go Unpublished Over Two Years After Completion, U.S. Study Shows. (Science Daily, January 3, 2012.)
* The article: Publication of NIH funded trials registered in ClinicalTrials.gov: cross sectional analysis. (J S Ross et al, BMJ 344:d7292, January 3, 2012.)
For an interesting development on this topic: The missing clinical trials data: it's time to RIAT (July 22, 2013).
February 3, 2012
There is a lot of water on Earth. Where did it come from? The common view is that any water on the nascent Earth would have been lost, due to the high temperature during the early phase of Earth formation. That leaves "elsewhere" as the source: bombardment of the Earth with water-bearing objects, such as comets or asteroids. Such collisions occur, and were more frequent in the old days.
Planetary scientists have tried to figure out whether comets or asteroids were the major source. The evidence has not been consistent. A new paper makes the argument even more wide open.
The key idea is to measure the hydrogen isotope ratio of water: Earth water, and water from various possible sources. On Earth, we do that with a mass spectrometer. ESA's Herschel Space Observatory does it by measuring spectral bands in the infrared. In any case, one measures the ratio of 2H to 1H -- the D/H ratio. (2H is known as deuterium, symbolized as D.) What is it we should measure? Well, "ocean" is simple enough for Earth water -- and we have lots of data for that. And we can collect meteorites, many of which are thought to have the same composition as asteroids, so we measure their water.
The big problem is comets. Getting our hands -- or our instruments -- on cometary material is difficult, and only a few comet samples have been analyzed. The first few comet samples that were analyzed gave D/H ratios very different from that of Earth water. Thus, comets as a source of our water has gone out of favor.
Now we have a new cometary analysis -- and it fits right with Earth water. Comets are "in" again. What makes this result especially interesting is that this is a different type of comet than those measured previously; perhaps the new result reflects that type of comet, not just the individual comet.
Here is a summary of what we now know about the D/H ratio from various sources:
| Earth oceans | (1.558 ± 0.001) x 10-4 |
| Meteorites (carbonaceous chondrites) | (1.4 ± 0.1) x 10-4 |
| Oort cloud comets | (2.96 ± 0.25) x 10-4 |
| New measurement: a Jupiter-family comet 103P/Hartley 2 | (1.61 ± 0.24) x 10-4 |
You can see that most of the values shown are about the same, with D/H about 1.5x10⁻⁴. However, the value shown for the Oort cloud comets is twice that. Until this new work, those were the only measurements we had for cometary water. Now, we have a new measurement, which shows that at least this one comet has water like ours. The significance of this new result remains to be seen, but for now comets are "in" again as a possible source of Earth water.
News story: Herschel finds first evidence of Earth-like water in a comet. (Space Daily, October 6, 2011.)
The article: Ocean-like water in the Jupiter-family comet 103P/Hartley 2. (P Hartogh et al, Nature 478:218, October 13, 2011.) The data table above uses information in the abstract of this article.
Musings looked at another aspect of this question in the post Where did our oceans come from? (January 4, 2011). That post deals with the possibility that our water was actually homemade. That is, it questions the assumption made above that our original water was all lost.
More from the Herschel mission, also on water measurements:
* Ceres is leaking (February 18, 2014).
* A water fountain for Saturn (October 23, 2011).More about comets.
* Who is perturbing the orbit of Halley's comet? (October 3, 2016).
* What has six tails -- and is beyond Mars? (November 20, 2013).Collisions might have delivered more than water: Is it possible that asteroids helped provide the energy needed to get life started on Earth? (January 26, 2015).
My page of Introductory Chemistry Internet resources includes a section on Nuclei; Isotopes; Atomic weights. It includes a list of related Musings posts.
January 31, 2012

|
There it is -- about actual size. (Of course, how big it appears on your computer screen depends on your system.)
It is sitting on a US dime coin, our smallest coin: about 18 millimeters in diameter. The frog length is less than half of that. Want something bigger to see? bigger picture [link opens in new window]. But remember, it is still a 7 millimeter frog -- just over 1/4 inch long. Figure source: Wikipedia: Paedophryne amauensis. Pictures such as this, with the frog on a dime, are found in the article and in many stories about this frog. |
Finding a new organism at some extreme is fun. It reminds us of the diversity of Nature -- and that there is so much yet to be discovered. But what is really interesting about this finding? First, the frog species found here is part of a genus of small frogs. They are adapted to a special environment. This frog lives in the leaf litter; its small size allows it to scurry around through a rather dense environment. It probably eats tiny insects. And its feet are so tiny, it may have little ability to climb.
It's thought to be not only the smallest frog but also the smallest vertebrate. The paper discusses some of its rivals for that honor; the difference is small. I wonder, what is the size limit for a vertebrate? Why?
News story: World's smallest frog discovered. (BBC, January 11, 2012.)
The article, which is freely available: Ecological Guild Evolution and the Discovery of the World's Smallest Vertebrate. (E N Rittmeyer et al, PLoS ONE 7(1):e29797, January 11, 2012.)
As I was finishing up this post, I came across a related article. It, too, announced finding the smallest frog. Turns out that the work is closely related to the current paper. Both groups are studying the same genus of frogs, in New Guinea. The genus is characterized by the generally small size of the frogs. Together the two papers describe six new species, which are similar in size -- and habitat. The paper noted in this paragraph came out last December, and -- it would seem -- properly claimed finding the smallest frog. The paper featured above came out a month later, and claims an even smaller frog. News story: World's Smallest Frogs Discovered in New Guinea. (Science Daily, December 12, 2011.) This news story links to the article, which is freely available. The article includes more pictures (though no dimes). I found the picture of the feet interesting -- especially when I noticed that the scale bar said 1 millimeter. The author of this article, Fred Kraus, is apparently the person who first described this genus of frogs -- in 2010.
Also see...
* Another small frog: How to make yourself more transparent while you sleep (March 7, 2023).
* Previous frog post: Quiz: What is it? (October 5, 2011).
* Body size relationships and small brains: What to do if your brain won't fit in your head (February 18, 2012).
* We have previously used our small dime coin as a reference for weight, such as in the post: A microscope small enough that a mouse can wear it on its head (November 12, 2011).
January 30, 2012
Original post: Restricting excessive use of antibiotics on the farm (September 25, 2010). That post presents the issues: how use of antibiotics on the farm may be causing increased antibiotic resistance in human pathogens. That statement is disputed by some, especially in the farm industry. Nevertheless, there is a move toward restricting antibiotics used for humans from use on the farm. The New York Times story in that post is still a good introduction.
The US FDA (Food and Drug Administration) has now issued a rule. It makes a small step in the direction of restricting such antibiotics on the farm. Those on one side will be disappointed by the announcement, but at least it is in the right direction.
The announcement: FDA to protect important class of antimicrobial drugs for treating human illness. (FDA, January 4, 2012. Now archived.)
News story: Public health: Rules tighten on use of antibiotics on farms. (N Gilbert, Nature 481:125, January 12, 2012.)
More... Restricting excessive use of antibiotics on the farm -- follow-up #2 (April 16, 2012)
January 28, 2012
Insulin is a hormone made by the pancreas; its famous role is in regulation of glucose metabolism. It is used therapeutically to help control diabetes. Now we have a paper testing whether insulin therapy might be appropriate for Alzheimer's disease (AD). Why AD? Well, the brain is a major site of glucose metabolism. Further, there have been hints that AD might be associated with low levels of insulin. So, there is some basis for making the connection.
The general design of the testing was straightforward. A group of patients was randomly divided into three groups: two received specific doses of insulin (low and high dose), by nasal spray, and one group was a control, receiving a saline solution as a placebo. The reason for using nasal spray was to direct the insulin to the brain, with minimal effect on general metabolism. Each patient was tested by various standard criteria used for the evaluation of AD; testing was done prior to treatment ("baseline") and at two month intervals.
|
Here are two examples of their results, from Figure 2 of the paper.
Part C (left) shows the results for the Alzheimer Disease's Assessment Scale - cognitive subscale (ADAS-cog). The graph shows the change over four months for the three groups. You can see that the placebo (control) group showed the biggest change (which is in the direction of worsening); both treatment groups showed less change -- which is good. |
|
Part D (right) shows the results for the Alzheimer's Disease Cooperative Study - activities of daily living (ADCS-ADL) scale. As in Part C, the graph shows the change over four months for the three groups. In this case, they subdivide the subjects into two groups: amnestic mild cognitive impairment (aMCI, left) and Alzheimer disease (AD, right). (The former is a milder condition; it may be a precursor to full AD.) You can see that there is no particular effect at all for the MCI group. However, for the AD group, the placebo group showed substantial change (worsening), and both treatment groups show less change (which, again, is good). | |
The overall picture from the various tests, two of which are shown above, is that the insulin treatment has promise. There are various limitations and reservations, many of which they note. The study is small, and short term. The effects observed are small. Some of the details are not entirely consistent. I would add to the points they make one that is not apparent from the graphs above. The graphs show the changes observed for each group. However, looking at the data sets (shown in the paper) makes me wonder whether some of the apparent effects are due to some odd results for the placebo group.
So, what to do? Their own conclusion (last sentence of the paper): "Taken together, these results provide an impetus for future clinical trials of intranasal insulin therapy and for further mechanistic studies of insulin's role in the pathogenesis of AD." Fair enough. That is, the results (along with earlier work) are encouraging enough to warrant further work.
News stories:
* Insulin Nasal Spray Shows Promise for Alzheimer's Disease. (NIH, October 3, 2011.)
* Study Evaluates Intranasal Insulin Therapy for Adults With Mild Cognitive Impairment or Alzheimer's. (Science Daily, September 12, 2011.)
The article: Intranasal Insulin Therapy for Alzheimer Disease and Amnestic Mild Cognitive Impairment -- A Pilot Clinical Trial. (S Craft et al, Archives of Neurology 69:29, January 2012.)
More on Alzheimer's disease:
* Using patient-specific stem cells to study Alzheimer's disease (February 24, 2012).
* Reversing Alzheimer's disease (March 4, 2011).
* My page for Biotechnology in the News (BITN) -- Other topics includes a section on Alzheimer's disease. It includes a list of related Musings posts.More about insulin:
* A smart insulin patch that rapidly responds to glucose level (October 26, 2015).
* Making replacement insulin-producing cells: another way (May 14, 2010).
* My page for Biotechnology in the News (BITN) -- Other topics includes a section on Diabetes. It includes a list of related Musings posts.* More about brains: What to do if your brain won't fit in your head (February 18, 2012).
January 27, 2012
This post makes a connection between two ideas that have come up before. One is a serious and poorly understood problem of economic importance; the other is a fascinating behavioral issue involving parasites.
Bee colonies are being lost at an alarming rate, in a phenomenon known as colony collapse disorder (CCD). Various causes have been suggested, but none has been shown to be a key factor. In particular, nothing suggested so far explains a key observation of CCD: the bees seem to simply disappear. Here is a post on CCD: US Army attacks colony collapse problem -- and an ethics story (October 25, 2010).
We have also noted cases where a parasite seems to control the behavior of its host; sometimes we say that the host has become a zombie. A recent such post is Wasp hides under ladybug (January 3, 2012).
The main finding in the new work is that a particular parasitic fly can parasitize honeybees, and one of its effects is to cause hive abandonment. That is, the bees just leave the hive. This may be a zombie-type effect, with the fly controlling the behavior of the bees. (However, other explanations are possible. For example, it may be that the bees are sensed to be abnormal by their hive-mates, and are ejected from the hive.) Whatever the explanation, this behavior is reminiscent of a key aspect of CCD.
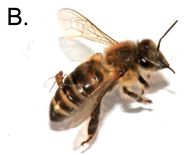
|
A parasitic fly, Apocephalus borealis, on the back of a bee. The fly is near the back end of the bee. It is -- probably -- about ready to inject an egg into the bee.
This is Figure 2B of the paper. The fly is about 3 millimeters long. (I infer that from part A of the figure, assuming that the flies in the two parts are about the same size.) |
So, is this parasitic fly responsible for CCD? Not so fast. First, the distribution of the fly does not seem to correspond to the distribution of CCD. Second, fly-infected bees were often found to be infected with other agents. This finding might suggest that the disorder is due to a combination of agents.
In summary, then, we have an agent -- a parasitic fly -- which seems to cause a behavior something like what is seen in CCD. However, it is questionable that it is what is actually causing the current CCD disease. This is still a useful finding, even if it is not "the answer". The implications of this finding will be the subject of future work. For example, studying how this fly causes hive abandonment may be useful.
News stories:
* Deadly fly parasite spotted for first time in honey bees. (Phys Org, January 3, 2012.)
* Parasitic Fly Dooms Bees to Death by Maggots. (Science Now, January 3, 2012.)
The article, which is freely available: A New Threat to Honey Bees, the Parasitic Phorid Fly Apocephalus borealis. (A Core et al, PLoS ONE 7(1):e29639, January 3, 2012.)
More on parasitic flies...
* Silent crickets (June 30, 2014).
* TIGER discovers smallest known fly; does it live in the head of tiny ants? (July 31, 2012).Another example of a parasite altering host behavior... Malaria-infected mosquitoes have greater attraction for people (May 28, 2013).
More about CCD:
* Neonicotinoid pesticides and bee decline (July 12, 2014).
* A plant virus that grows in bees: role in colony collapse? (February 17, 2014).
January 24, 2012
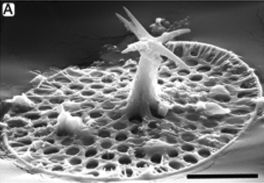
|
The fossil "scale" of an alga, of the genus Characodictyon. 750 million years old.
This picture is a scanning electron micrograph (SEM). The scale bar (lower right) is 5 µm. This is reduced from the lead figure in the Wired story listed below. It is probably Figure 1A of the paper. |
That's quite a picture. What's the story? The detailed structure above seems to be a skeletal material, based on calcium phosphate (apatite). That is, this is a "shell". And if the dating is correct, it is likely that this is the oldest shell known.
What's the significance of finding an old shell? It helps us understand biological history. Skeletons were common by about 550 million years ago, but evidence of their earlier history has been limited. This specimen, if their interpretation is confirmed and accepted, helps to establish that mineralized skeletons were developing 750 million years ago. But why? Why would an organism go to the expense of making a skeleton? One view is that skeletons arose as a defense against predation -- against being eaten. That is -- and again if their view becomes accepted -- this is evidence not only for skeletons, but for the existence of organisms that ate algae. These would most likely have been single-celled predators -- protozoa or such; it's early for animals, but making skeletons is a feature that would arise in many groups of animals. Given the state of our understanding of the early history of animals, every little clue is welcomed.
News story: Ancient Fossils Have Evolution's First Shells. (Wired, June 13, 2011.)
* News story accompanying the article, freely available at: The rise of predators. (S Porter, Geology 39:607, June 2011.)
* The article: Phosphate biomineralization in mid-Neoproterozoic protists. (P A Cohen et al, Geology 39:539, June 2011.)
A post on the early history of animals: Capsaspora owczarzaki and you or Where did animals come from? (April 10, 2011).
More old things... Claim of oldest fossilized cells refuted (May 3, 2015).
More about algae: Carnivorous algae -- that hunt large animals (October 7, 2012).
January 23, 2012
We've all heard of food chains. Big fish eats small fish, and that small fish eats smaller fish -- and so forth. Of course, in the real world, the patterns may be more complex, and we have food webs. It is not often that we talk about food webs involving humans.

|
The skin of a python, killed by a native tribe in the Philippines. The python yielded about 25 kg of meat.
This is reduced from a figure in the Cornell news story, which is also Fig 2 of the paper. |
Where are we going with this? A group of scientists has studied a hunter-gatherer tribe in the Philippines, a tribe that is thought to represent an early type of human society. In particular, they study the relationship of the people to snakes. And what is that relationship? Complex! People eat snakes, as the figure above suggests. And snakes eat people. And people and snakes compete for other small animal prey.
It's a fascinating story, even if a bit gruesome at times.
Are we really supposed to believe all the stories told in the paper? It's an interesting question, one that the authors address. It is plausible that the subjects might "enhance" some stories. The problem is not unlike interviewing witnesses to a crime. The authors note some of the precautions they took to try to minimize enhancements.
News story: Snake Tales -- An anthropologist and a herpetologist join forces to reveal the complex shared evolutionary and ecological history of pythons and primates. (The Scientist, March 1, 2012.)
Announcement: Study of man-eating snakes: Snakes are predators on, prey of, and competitors with primates. (Cornell University, December 13, 2011.) Good overview of the work.
The article: Hunter-gatherers and other primates as prey, predators, and competitors of snakes. (T N Headland & H W Greene, PNAS 108:E1470, December 27, 2011.)
More about pythons:
* Pythons in Florida (February 7, 2012).
* Heart health and python blood (December 28, 2011).More snakes: How to climb a pile of sand (November 7, 2014).
January 21, 2012
A new type of plant has been reported from the Brazilian desert. It was first discovered a few years ago, and there has been suspicion that it is a carnivore. These plants live near starvation: their challenge is to get enough nitrogen (or protein). They get their protein by eating tiny worms -- in the soil. Now, it's not obvious that one would eat soil worms using leaves; why not use roots? But use leaves is what they do. In fact, it's common that carnivorous plants use modified leaves in pursuit of meat. What's not so common is to do it underground.
|
Here is what the plant looks like. It is small: the coin is about 2 centimeters in diameter (as labeled in another paper on this plant). This one has been taken from the ground. The most prominent feature, near the bottom, is a group of leaves, which would normally be just under the soil surface. You can see one flower, near the top. And you can see lots of fruit. (Need some help? Put your cursor over the word "hint"; do not click. hint.)
This is Figure 1 B from the paper. The other parts of the figure give some additional nice views of the plant, including one close-up of a flower. |

|
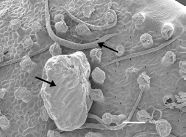
|
This is a scanning electron micrograph (SEM) of a portion of a leaf surface. There are two arrows. The upper one points to one of several worms; the lower one points to a sand grain. (Why didn't they use different symbols?) The small irregular, but near-circular things are glands that secrete sticky substances.
This is Figure 3 from the paper. The scale bar (white; lower right) is 100 µm. |
What's really new here is that they do a test of carnivory. The idea of the test is to feed the plant worms that have been labeled. In this case, the label is a heavy isotope of nitrogen. What they show is that the label from the worms is efficiently incorporated into the plants. This serves as rather direct evidence that the plant ate the worms.
News story: Carnivorous plant traps worms with sticky leaves. (Phys Org, January 9, 2012.)
The article: Underground leaves of Philcoxia trap and digest nematodes. (C G Pereira et al, PNAS 109:1154, January 24, 2012.)
Another type of carnivorous plant: How fast can a plant eat? (March 23, 2011).
Also see: Carnivorous plants: A blue glow (March 16, 2013).
And now, a carnivorous alga: Carnivorous algae -- that hunt large animals (October 7, 2012).
Another way that plants satisfy their need for nitrogen is to form a symbiosis with bacteria that can "fix" nitrogen from the atmosphere into a usable form. This was noted in the post Plants need bacteria, too (October 9, 2010).
Other plants have managed to get large animals (genus Homo) to set up complex factories, outside their own bodies, to fix atmospheric nitrogen into a usable product. The animals then spread this product, commonly called fertilizer, around where the plants grow. The plants repay those animals by providing food for them. For plants to simply eat animals as a source of nitrogen is relatively uncommon.
More from Brazil:
* Tarantulas in the trees (November 11, 2012).
* Lux aeterna: Mushrooms; Mozart (December 7, 2009)More unusual leaves: A plant that mimics the leaves of its host (May 30, 2014).
More worms: Worm count (August 27, 2019).
My page of Introductory Chemistry Internet resources includes a section on Nuclei; Isotopes; Atomic weights. It includes a list of related Musings posts.
January 20, 2012
A new virus has appeared -- and is causing fairly serious problems with milk production and fetal development in farm ruminants in Germany, Belgium, and the Netherlands. The virus was identified in November 2011. It is probably transmitted by midges.
Scientists have the genome sequence, and thus know the general type of virus. They can grow the virus in the lab. Beyond that, little is known. The good news is that they are fairly sure they have the right virus.
They briefly address the question of whether this new "Schmallenberg virus" (named after the German town where it was first discovered) infects humans. They suggest that it does not, because midges do not bite humans much. I find that less than reassuring. By the same argument they use for cattle, if pregnant humans were infected last summer, the results remain to be seen.
News story: New Animal Virus Takes Northern Europe by Surprise. (Science Now, January 13, 2012.) I suspect this tells most of what is known at this point. Nevertheless, it is remarkable that within weeks of a new virus emerging, we have this much information. It will be interesting to follow this story. Some might hope that it is not too interesting a story. In any case, it is an example of an emerging disease that we can watch from very near the beginning; as a matter of public health, biologists will follow it closely.
In the meantime, beware the midges.
More about emerging diseases is on my pages for Biotechnology in the News (BITN): Emerging diseases. That discusses some general issues, and also links to some specific diseases that have emerged in recent decades.
A Musings post on the broad issue of diseases: One health (November 15, 2010).
Several posts on the new flu strain that emerged in 2009, plus others about flu, are consolidated on the page: Musings: Influenza (Swine flu).
Another new virus: A new SARS-related virus seems to be emerging -- and an "ethics" story (February 4, 2013).
* * * * *
We'll add selected new developments from time to time, some with little comment...
A news story: Schmallenberg virus confirmed on farms in the UK. (Guardian, January 23, 2012.)
A Musings post: Is the Schmallenberg virus episode dying out on its own? (October 2, 2012)]
January 18, 2012
Right. Those are the results. The scientists interpret the results as meaning that the rats show empathy toward their imprisoned brethren. Be sure to separate the experimental work from the interpretation. The former is very clever, and fun. The latter is undoubtedly open to opinion. The motivation for doing work of this sort is to try to develop more and better evidence on the emotions of non-human -- even non-primate -- animals.
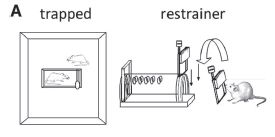
| Here is the basic experimental set-up, from Figure 1A of the paper. The left side shows the test chamber, top view. The test rat is in the main chamber. Inside is a small cage, which may contain a "trapped" rat. (In some tests, the inner cage may be empty, or may contain an inanimate object.) The right side shows the cage, and shows that it has a door -- one that the rat on the outside can learn to remove. It's an amazingly simple system. |
If you'd like to see what it really looks like, look at one of the movie files listed with the article below. For the moment, to get the basic idea of the set-up, either movie is fine.
So, they put a rat in the cage (the inner chamber), and another rat in the main chamber. The "outer rat" explores, and eventually learns that he can open the door and free the trapped rat. In subsequent trials, he does so more and more quickly. Movie 2 shows this basic finding. The basic observation, then, is that the rat learns to efficiently free the imprisoned rat -- and does so.
What does this mean? The authors want to interpret it as the rat showing empathy for the imprisoned rat. Interpretation of animal behavior is often contentious, and this one will no doubt be so. But they make the case, and it is worth reading what they consider.
As an example... A rat that has learned to open the door will do so to get a reward of some chocolate, as well as to free a trapped rat. What if a rat is presented two such inner chambers, one with chocolate and one with a prisoner? They find that the test rat in this case often frees the imprisoned rat first, even though this means it ends up sharing the chocolate with the freed rat. They interpret this as supporting their suggestion that the rat frees the imprisoned rat out of empathy.
It's fine if you are not convinced by their interpretations. They are pursuing some novel ideas. What is important is that they have a test system, and are trying to test the ideas. That we may not find the tests to be conclusive at this point is ok. See if you can suggest further tests. Try to develop tests that serve to distinguish one possible interpretation from another. On the final page of the paper, the authors discuss some possible alternative interpretations that they have considered. That discussion illustrates how doing a range of tests helps to distinguish among the possible interpretations.
News story: Helping your fellow rat: Rodents show empathy-driven behavior. (PhysOrg, December 8, 2011.) Good overview. The "Read also" at the end links to another PhysOrg story, which is an exchange with Panksepp, who wrote the news story accompanying the article, listed below.)
* News story accompanying the article: Behavior: Empathy and the Laws of Affect. (J Panksepp, Science 334:1358, December 9, 2011.) This news story deals largely with the broader questions raised, on studying emotions in non-humans. It says little about the specific work of the new paper. (For more on Panksepp's view of this work, see the PhysOrg news story, above. This may be useful if you cannot access the Science article.)
* The article: Empathy and Pro-Social Behavior in Rats. (I B-A Bartal et al, Science 334:1427, December 9, 2011.) There are two movie files listed under Supporting Online Material. Movie 2 shows how the test rat responds to the presence of a trapped rat over multiple test sessions. Movie 1 shows the initial response when the cage contains a rat, a toy, or nothing -- but does not show door opening or learning.
Update February 6, 2019. For more about rat sociality, see the article: When Rats Rescue Robots. (L K Quinn et al, Animal Behavior and Cognition 5:368, November 2018.) I have not found a freely available news story for this, but the article itself is freely available. There are some nice videos with this article. They seem to be available only from links within the pdf file.
* * * * *
For more on emotions in non-primate animals: How do you tell if bees are pessimistic? (August 5, 2011).
For more on rats:
* A rodent that can't chew (November 5, 2012).
* A smart rat (November 30, 2009).For more on chocolate:
* A better way to make chocolate, inspired by brake fluid (August 23, 2016).
* Better chocolate? Use better yeast? (May 3, 2016).
* Chocolate: 1200 years old (February 18, 2013).
January 17, 2012
Each month the cover of EID (Emerging Infectious Diseases) has a work of art. The editor writes an essay about the art, and somehow ends up connecting it to the journal content.
| This one is about a mosaic -- in the traditional art use of the term. It is a mosaic more than two millennia old, by Dioskurides of Samos. Much of the essay is about the mosaic, and may be interesting for both the technology and the history. Then the essay transitions to note some articles in this issue, some of which have the theme of historical microbiology. One of those articles is even about microbiology of the same era as that ancient mosaic: an attempt to deduce what microbe might have caused the plague that is noted in the Sophocles play Oedipus Rex. That "plague of Thebes" was likely a real historical event, but it was long before we knew anything about bacteria and their role in disease. |
The figure here is from the cover of the January 2012 issue of EID. The essay about it is: Tough Art and Microbial Drama. (Polyxeni Potter, EID cover story, January 2012.) EID, a publication of the US Centers for Disease Control, is entirely open access. The link here is to the journal archive at PubMed Central.
Another EID cover story: Why are musical instruments featured on the cover of EID? (June 7, 2010).
More about ancient diseases: A new approach for testing a Llullaillaco mummy for lung infection (August 17, 2012).
Also see: Bacteria found in rectum of old flea (October 16, 2015).
January 15, 2012
Graphene -- the wonder material. Graphene is a single layer of graphite, a layer one atom thick. It has electronic and optical properties of interest, and many are trying to develop commercial applications. We have noted graphene in various posts [example linked at the end].
A new paper explores the properties of the bubbles formed when a sheet of graphene is placed -- not quite perfectly -- on a surface.
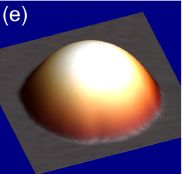
|
The picture at left is an image of one bubble taken by atomic force microscopy (AFM). The area scanned is about 3 µm on a side. Detailed analysis of this bubble showed that it is almost spherical.
At the right is another bubble, as observed by light microscopy. The colored rings, known as Newton rings, are interference patterns due to light being partially reflected by the bubble as well as by the support. |
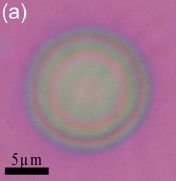
|
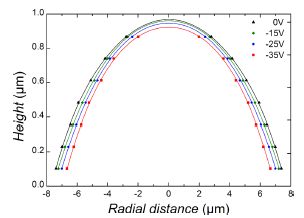
|
The figure at the left shows an analysis of the structure of one bubble as a function of the voltage applied to it. The analysis is done by measuring the details of the Newton rings (figure above), when observed with monochromatic light. The graph shows the bubble height vs position ("radial distance"). For example, compare the red curve vs the black curve. The red curve (with the largest voltage, -35 V) shows a smaller height at every position than the black curve (0 V). The effect is completely consistent over the voltage range shown here: the bubble gets smaller as (negative) voltage is applied.
That is, not only can graphene form bubbles, but the bubbles can be tuned. |
|
This is Figure 3 from the paper. The two figures above are parts of Figure 1. | |
The work shows that graphene forms bubbles, with a well-defined shape. Further, the bubbles can be tuned. Is this useful? They suggest that such tuned bubbles could be useful as tiny lenses.
News story: Graphene bubbles could make better lenses. (Physics World, September 19, 2011.) Physics World is a website from the Institute of Physics.
The article: Graphene bubbles with controllable curvature. (T Georgiou et al, Applied Physics Letters 99:093103, August 30, 2011.)
The 2010 Physics Nobel Prize was awarded to Andre Geim and Konstantin Novoselov, University of Manchester, "for groundbreaking experiments regarding the two-dimensional material graphene". See the Nobel page The Nobel Prize in Physics 2010. Both awardees are co-authors of the current paper.
Background post on graphene: Graphene by the roll -- and soon in your living room (July 31, 2010).
More graphene: Loudspeakers: From gold-coated pig intestine to graphene (April 27, 2013).
More atomic force microscopy: Nanorobots: Getting DNA to walk and to carry cargo (August 7, 2010).
For more on AFM, see a section of my page of Internet Resources for Introductory Chemistry: Atomic force microscopy and electron microscopy (AFM, EM). Some of the links are to galleries of AFM images.
More on interference of light waves: Gravitational waves (February 16, 2016).
Posts about lenses include...
* Making microlenses using bacteria (May 28, 2025).
* Chromatic aberration: is it how cephalopods see color with only one kind of photoreceptor? (October 14, 2016).This post is listed on my page Introduction to Organic and Biochemistry -- Internet resources in the section on Aromatic compounds.
January 14, 2012
Synesthesia might be thought of as a cross-talk between the senses. For example, people with a certain kind of synesthesia would see the number 4 as blue.
Is this "bad"? As so often when we are faced with the variability of humans, it can be hard for us to understand how people who are different might be "ok". In the case of synesthesia, some have argued that the cross-talk is a special feature, allowing such people to make connections that the rest of us would not make. They would suggest that there is some analogy between synesthesia and creativity, with both involving a "skill" of making connections between things that most would not consider related. Is this an innate skill for certain people, based on how their brains are wired, or is it a learned skill? Much evidence points to it being innate. For example, the connections that a person makes are stable over time, and study of the brain suggests that they are due to real brain activity in the expected regions.
The following figure suggests that heredity is involved in synesthesia. This is Figure 2 from the paper.
|
In each frame, the top row shows two parents, one of whom has synesthesia. The lower row shows the incidence of synesthesia among their children -- averaged over several studies. Squares represent males and circles females. The green shading represents synesthesia; for the offspring, the degree of shading represents the percentage who have synesthesia. For example... on the left, the mother is synesthetic; 40% of the male offspring are synesthetic.
Synesthesia affects only a few percent of the general population. The figure makes it clear that having a synesthetic parent greatly increases the chances. Beyond that, the hereditary aspects of synesthesia are unclear. |
If a tendency towards synesthesia is inherited, does that mean it is good -- that nature has selected for it? Or has this characteristic just come along for the ride, along with some other trait that is good? We don't know, but the data says we should ask the question.
News story: Why has synesthesia survived evolution? (Medical Xpress, November 22, 2011.) A short but useful overview of the ideas from the article.
The article, which is freely available: Survival of the Synesthesia Gene: Why Do People Hear Colors and Taste Words? (D Brang & V S Ramachandran, PLoS Biology 9:e1001205, November 22, 2011.) The article is good for browsing. It is classified in the journal as "Unsolved Mystery". The final section, "Towards a Solution", is a useful overview -- and emphasizes that the big story here is asking questions about this interesting condition.
More about synesthesia:
* Can people learn to be synesthetic? (January 7, 2015).
* Can you see your hand in total darkness? (April 14, 2014).
* What does blue light smell like? (July 18, 2010).
January 10, 2012
Ants generally do not travel on spider webs. Why not? A new paper explores this question, and provides evidence that the spider webs contain an ant repellent. The scientists show that if they wash the web silk, ants will travel the web. Further, they identify the chemical that serves as the repellent, and show that if they add it back to the washed webs, the ants again stay away.
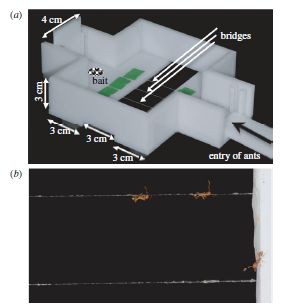
|
Here is a sampling of what they did...
Part a shows the assay chamber they designed. The ants enter at the right, seeking the bait at the left. To get there, they need to cross a bridge -- which is made of spider web silk. Part b shows photos giving two examples of the responses. The lower bridge is normal silk. The upper bridge is made of silk that has been washed to remove the ant-repellent. You can see that the ants travel the washed silk. You can also infer that they avoid the normal silk. This is Figure 1 from the paper. |
They also show that young spiders do not make ant-repellent webs. This means that production of silk and repellent are not completely coupled. They interpret this as suggesting that the young spiders do not need to add repellent, since their weaker webs would not support the ants. This interpretation seems open to question, but that is a matter for further work.
News story: Spiders Adopt Their Enemy's Weapons. (Scope (MIT), December 13, 2011.)
The article: A novel property of spider silk: chemical defence against ants. (S Zhang et al, Proc. R. Soc. B 279:1824, May 7, 2012.)
Also see:
* Happy Birthday (May 27, 2012). Another bridge post.
* What to do if your brain won't fit in your head (February 18, 2012).
* School of Ants -- you can help (October 16, 2011).
* What else are feet good for? (August 8, 2011).
* Why a tree cultivates ants (October 3, 2010).
* The vegetarian spider (October 21, 2009).
January 9, 2012
A recent "Profiles in Science" story in the New York Times is about neuroscientist Michael Gazzaniga. Gazzaniga is not only a leading scientist, but a fine communicator. The article is both fun and informative. Have a look!
The story: Decoding the Brain's Cacophony. (New York Times, October 31, 2011. Link is now to Internet Archive.)
I have recommended another book by Gazzaniga on my page of Book Suggestions: Gazzaniga book. That book was noted in the post: The animal mind (July 23, 2009).
January 8, 2012
A previous post, discussing various issues about rice, raised the issue of the arsenic (As) content of rice: What color is your rice? Rice, diabetes, and arsenic. (December 12, 2010). Key points include that the rice plant accumulates arsenic, and that the As is especially high in the bran (the outer layer, found in brown rice). Many readers contributed to the information in that post. Because rice is of wide interest, I want to note a new article on arsenic in rice -- even though the additional information is small.
The new study is simple... They measured the arsenic level in the urine of pregnant women. The key finding was that it was higher in those who reported eating rice in the two days prior to the urine sample. That's about it. The effect is small, and there is no claim that it is of medical significance -- for mother or fetus. Nevertheless, it does add to the evidence that rice may be a significant source of arsenic for us; that broad story needs further work.
Should you worry about this? Should you act on it? This is a type of question that comes up repeatedly for various exposures -- good or bad. The individual facts do not lead to clear conclusions. What matters, for example, is your total As. Well, it is more than that, since the specific chemical form of the As matters. As to rice, the As content varies, and in general you do not know what it is. The authors' main conclusion is simply that As exposure via rice should be studied further. They also suggest that rice should be tested and labeled for its As content. And they raise the question of whether we might develop lines of rice that do not accumulate As.
If you are pregnant and consume a high level of rice, and you want to cut back, ok. But if you simply substitute the rice with foods of unknown As content, that might not accomplish much. And if you are concerned about low levels of As from rice, maybe you should have your water supply tested. All these comments are meant primarily to illustrate the complexity of the situation. We know a few things, are not sure of their significance, and we lack knowledge of many things that may well be of equal importance.
News story: Rice as a source of arsenic exposure. (Medical Xpress, December 5, 2011.) Good overview.
The article, which is freely available: Rice consumption contributes to arsenic exposure in US women. (D Gilbert-Diamond et al, PNAS 108:20656, December 20, 2011.)
More about rice and arsenic... Rice and arsenic: rice syrup, baby food, and energy bars (April 23, 2012).
Another example of the difficulty of determining a suitable dose for a nutrient, in this case for a vitamin... Is folic acid good for you or bad for you? (April 10, 2010).
Other arsenic stories...
* When life imitates art... Bacteria blink for arsenic (April 15, 2012).
* NASA: Life with arsenic (December 7, 2010).
* How arsenic works against a cancer (June 16, 2010).
January 6, 2012
Hemophilia -- the failure of blood to clot properly -- is most often due to defects in the gene for coagulation factor VIII or IX, resulting in hemophilia A or B, respectively. Both genes are on the X chromosome, which means that the disease is common only in males. Several of Queen Victoria's male descendants, some on one or another European throne, suffered from the bleeding disease. The basis of the royal bleeding was not known at the time. However, modern genetic analysis of the remains of Alexei Romanov, son of the Russian Tsar and in the Victoria lineage, revealed a mutation in the gene for Factor IX (FIX). We thus infer that Queen Victoria carried a mutant FIX gene.
A new report shows that gene therapy -- adding a proper gene for the FIX protein -- shows promise in treating hemophilia B.
This is not a new idea. However, previous attempts to do such gene therapy have yielded limited benefit. Now, they have made technical improvements to the gene delivery system, and try again. Work with six patients is reported. The dose was escalated during the study: the first two patients received a low dose, the second two a medium dose, and the final two a high dose. Here are the results reported for the 6th patient.
|
To start, look at the upper line in the graph (squares). This shows the amount of Factor IX found in the patient's blood, over the 20 weeks observed so far. You can see that the curve is approximately flat over most of the time, with about 10 IU/dL (left hand scale; IU/dL = international units per deciliter).
The initial value for FIX is high, because the patient received a dose of the FIX protein at just about time 0. This is shown by the red arrow at time zero, labeled FIX. (Getting FIX protein is a conventional treatment for hemophilia B.) Importantly, this patient received no further doses of FIX protein; the curve stays flat over most of the 20 weeks because the patient is now producing FIX, from the gene therapy. |
|
The level of FIX seen here is about 10% of normal, but that is generally considered sufficient to avoid symptoms. Prior to the treatment, the patient was making less than 1% of normal FIX -- and was routinely taking FIX protein three times a week. Thus both the level of FIX and the lack of need to take FIX protein indicate that the treatment was effective. The patient is now making his own FIX, from the added gene.
The lower line in the graph shows the amount of the enzyme ALT (alanine aminotransferase; right hand scale). A rise in the level of this enzyme is a sign of liver toxicity. In fact, the beginnings of such toxicity were seen at about week 8. Prednisolone was given to treat this damage; the dosing is shown at the top (blue bars, labeled Pred). The liver problem seems to have resolved. | |
The figure above is Figure 1F from the paper; the complete Figure 1 shows such data for all six patients. Observations range out to 70 weeks (18 months) for patient 1 (lowest dose) down to the 20 weeks seen above for patient 6. There is much variability, but here are some general observations...
* All patients showed a rise is FIX levels, and clinical benefit. The latter is judged, for example, by a reduced need for taking the FIX protein.
* The level of FIX increased as the treatment dose increased.
* Liver toxicity, as noted above, was seen only for the two patients at the highest dose. In both cases, treatment of the liver damage seemed successful.
That's where it stands. Six patients, various doses, observations from 20-70 weeks. All show benefit -- sustained benefit. It's the best yet. Long term? We'll see.
News stories:
* Treatment for Blood Disease Is Gene Therapy Landmark. (New York Times, December 10, 2011. Link is now to Internet Archive.)
* Gene Therapy Achieves Early Success Against Hereditary Bleeding Disorder, Study Suggests. (Science Daily, December 11, 2011.)
* Editorial accompanying the article: Merry Christmas for Patients with Hemophilia B. (K P Ponder et al, New England Journal of Medicine 365:2424, December 22, 2011.) Includes a discussion of the likely merits of gene therapy with the FIX gene vs the conventional treatment with the FIX protein.
* The article: Adenovirus-Associated Virus Vector-Mediated Gene Transfer in Hemophilia B. (A C Nathwani et al, New England Journal of Medicine 365:2357, December 22, 2011.)
For another gene therapy approach to treating hemophilia, see Gene therapy: Curing an animal using a ZFN (August 9, 2011). This, and another gene therapy post referred to there, involve mice. It's important to note that the current work is gene therapy in people -- real patients.
For an approach to an HIV vaccine involving gene therapy, see A novel approach to providing immunity to HIV (March 12, 2012). Once again, it is with mice -- so far.
For another story about a sex-linked gene, see Quiz: The monkey-cat (October 26, 2011).
For more on gene therapy, see my page BITN: Agricultural biotechnology (GM foods) and Gene therapy.
Another post that includes the monitoring of liver toxicity by measuring the ALT enzyme: A better mouse -- it has a humanized liver (August 12, 2014).
More about bleeding:
* Mechanism of blood clotting: how the von Willebrand factor works (May 18, 2021).
* Type O blood and survival after severe trauma? (July 7, 2018).
* Blood thinning: a new approach (February 2, 2015).
January 4, 2012
Whale songs fascinate the general public. Scientists, too, are called to these sounds of whales. What do they mean? Now, scientists ask for your help in classifying the sounds from whales around the word.
News story: Scientists ask public to help decode whale song. (Guardian, November 29, 2011.)
The [original] whale song site: https://whale.fm/ (The Whale Project). See the "About" pages for information -- and pictures. See next paragraph for an update.
Update December 2019...
You can't help with this anymore. The project has been completed. The web site has been archived, with much information, but the original site is no longer available. Here is the final version of the page: The Whale Project (archived site).* * * * *
We recently noted work on the geographical distribution of whale songs: Tracking new songs as they cross the Pacific (June 21, 2011). That post introduces some of the key ideas, including the spectrographs used to analyze the songs.
Also see the post immediately below.
We also recently noted a project where you can help scientists study ants: School of Ants -- you can help (October 16, 2011). That project and the new one are part of an increasing number of projects where scientists want the help of the "common person" -- the amateur scientist.
More "citizen science"... Using your smartphone to detect cosmic rays (April 7, 2015).
Next whale post: Killer whales: menopause (October 1, 2012).
January 4, 2012
This accompanies the post on whale songs, immediately above. Vox Balaenae is a piece of music inspired by whale songs. It was composed in 1971 by the rather radical American composer George Crumb (1929-). The title is sometimes translated as Voice of the Humpback Whale.
Video: George Crumb - Vox Balaenae. (10 minutes.) The performance is identified on the YouTube page, and on the video itself.
Other music posts include: Quiz time... (June 15, 2011).
There is more about music on my page Internet resources: Miscellaneous in the section Art & Music.
January 3, 2012
This item is about a parasitic wasp and its host, a type of beetle that we commonly call a ladybug. The female wasp lays an egg inside the body cavity of the ladybug, and that is where wasp development begins. Then...
|
Part a shows the wasp larva (yellow) emerging from the ladybug.
Part b shows the wasp cocoon under the ladybug. This is how the wasp develops at this stage; the ladybug is largely paralyzed, but twitches at times, especially if stimulated. This is Figure 1 of the paper. |

|
The ladybug seems to serve as a bodyguard for the wasp during its final stages of development. The movie files available with the article show what happens when a predator of the wasp approaches a free cocoon and one that is guarded. The results in the following graph support that claim quantitatively.
|
The graph shows the results of an experiment to see how the ladybug protects the developing wasp. The height of the bar shows the percentage of cocoons that were eaten by a predator. The bar at the left is for wasps unprotected by a ladybug ("cocoon alone"). The bar at the right is for wasps protected by a live ladybug -- the normal situation. The middle bar shows what happens if the cocoon is put under a dead ladybug. (20? 20 wasp cocoons were tested in each case.)
It is clear that the wasp cocoons are subject to predation, but that being under a live ladybug provides substantial protection. Dead ladybugs are not adequate. This is Figure 2a of the paper. |
Since the wasp paralyzes the ladybug, this is an example of a parasite controlling the behavior of its host. The ladybug may properly be called a zombie during the time spent serving as a bodyguard for the wasp. Interestingly, in this case the ladybug often recovers fully after the adult wasp leaves the cocoon.
The paper also tests another idea about the parasite control. The parasite spends energy to control the host, even though we know little about how that all happens. Does the parasite pay a cost for this? They show that wasp fecundity declines the longer it remains under the ladybug. They interpret this as a cost to the wasp for exerting control. (Offhand, I can think of other ways to interpret the result, so the point here is to raise the issue, not to present a proof.)
News story: Parasitism: Wasp Uses Ladybug as 'Zombie Bodyguard'. (Science Daily, July 18, 2011.)
The article, which is freely available: The cost of a bodyguard. (F Maure et al, Biology Letters 7:843, December 23, 2011.) Choose "Data Supplement", and you will find three short movies illustrating some of the work.
Also see:
* Cockroach should be disinfected before eating it (February 12, 2013). More about parasitic wasps.
* A parasitic fly that causes hive abandonment in bees: Is this relevant to CCD? (January 27, 2012).
* Drumming affects caste development (March 21, 2011).
* Death-grip scars from zombie ants, 48 million years ago (November 9, 2010).
January 2, 2012
A new journal article is on work done on the International Space Station (ISS) -- and was submitted from there, ~350 km (~200 miles) beyond our planet. The journal claims that this is the first paper to be submitted by an author not on Earth.
Some ages ago, there must have been a first scientific paper based on looking upward from the Earth's surface and viewing the heavens. We have noted a 1781 paper by William Herschel: The first report of a new planet (March 13, 2011). Of course, many preceded him -- whether or not they wrote what we would now call scientific papers. [We also noted books from the early 17th century by Kepler and Galileo, based on their observations of the heavens: Book review: Galileo (October 6, 2010) -- and linked post.] In the 20th century, we began to get papers based on observations made in outer space. Now we have a paper written there and submitted from there.
What is the next event in this series? When will it happen?
News story: Journal receives its first paper from space. (EurekAlert, November 11, 2011.)
* Editorial accompanying the article: Is EPL a global journal? No, more! (M Schreiber, Europhysics Letters, December 2011.) The editorial tells the somewhat amusing background story behind the paper.
* The article, which is freely available: Direct measurement of the speed of sound in a complex plasma under microgravity conditions. (M Schwabe et al -- including S Volkov, Europhysics Letters, December 2011.) Check the author affiliations -- especially the current address for the last author. I should note, however, it is not at all clear from the paper per se that he is the one who submitted the paper, from that address. Oh, you can find out what the paper is about here; at least, peek at the abstract. But the content of the paper is not what this post is about.
The following page suggests that the claim made above is not quite right. I'll let folks check it for themselves as they wish. A letter from space. (Physics World blog, November 11, 2011.)
* * * * *
More from the space station: Which direction does blood flow in an astronaut? (January 7, 2020).
Older items are on the page
Musings: September-December 2011 (archive).
The main page for current items is Musings.
The first archive page is Musings Archive.
E-mail announcements -- information and sign-up: e-mail announcements. The list is being used only occasionally.
Contact information Site home page
Last update: May 6, 2026