Home
> Musings: Main
> Archive
> Archive for September-December 2016 (this page)
| Introduction
| e-mail announcements
| Contact
Musings: September-December 2016 (archive)
Musings is an informal newsletter mainly highlighting recent science. It is intended as both fun and instructive. Items are posted a few times each week. See the Introduction, listed below, for more information.
If you got here from a search engine... Do a simple text search of this page to find your topic. Searches for a single word (or root) are most likely to work.
Introduction (separate page).
This page:
2016 (September-December)
December 28
December 19
December 14
December 7
November 30
November 21
November 16
November 9
November 2
October 26
October 19
October 12
October 5
September 28
September 21
September 14
September 7
Also see the complete listing of Musings pages, immediately below.
All pages:
Most recent posts
2026
2025
2024
2023:
January-April
May-December
2022:
January-April
May-August
September-December
2021:
January-April
May-August
September-December
2020:
January-April
May-August
September-December
2019:
January-April
May-August
September-December
2018:
January-April
May-August
September-December
2017:
January-April
May-August
September-December
2016:
January-April
May-August
September-December: this page, see detail above
2015:
January-April
May-August
September-December
2014:
January-April
May-August
September-December
2013:
January-April
May-August
September-December
2012:
January-April
May-August
September-December
2011:
January-April
May-August
September-December
2010:
January-June
July-December
2009
2008
Links to external sites will open in a new window.
Archive items may be edited, to condense them a bit or to update links. Some links may require a subscription for full access, but I try to provide at least one useful open source for most items.
Please let me know of any broken links you find -- on my Musings pages or any of my regular web pages. Personal reports are often the first way I find out about such a problem.
December 28, 2016
Brain-computer interface -- without invasive electrodes
December 28, 2016
Our brain controls our body movements. However, some people cannot control body movements; there is a defect somewhere in the chain of events from brain signal to muscle action. It is a goal to develop ways to restore controlled movement to such people. The general approach is to somehow get the brain signals to bypass the defect. This involves capturing the brain signals, and then somehow artificially transmitting them. Transmission may be to a robotic device, or to a part of the person's body beyond the defect. A computer is an intermediate, thus leading to the common terms brain-computer or brain-machine interface. Musings has discussed some such work, showing, at least in the lab, some successes [links at the end].
In most such work, the brain signals are collected using electrodes that have been implanted in the brain. In some work, the brain waves are collected non-invasively, just as in making an electroencephalogram (EEG); however, the quality of such signals is much lower. A new article reports progress with external collection of brain waves and achieves good control of a robotic device.
To see what was accomplished, look at the following video. The subjects, healthy volunteers here, wore electrode-laden "skullcaps" to collect their brain waves, but did not have implanted electrodes. That is, there was no surgical preparation to do this work. Video: Noninvasive EEG-based control of a robotic arm for reach and grasp tasks. (YouTube, 1.2 minutes; no useful sound.)
The video shows that each subject, using only their thoughts and the resulting brain waves, was able to control the device: they could reach for an object, grasp it, and put it on a shelf.
The following figure shows a little detail about how well the subjects could control a device. This figure is based on a simpler, two-dimensional (2D), test.
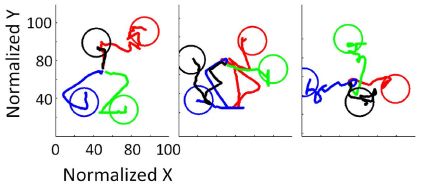
The figure shows the trajectories for getting to objects.
Each frame shows four objects, denoted by the four colored circles. In each test, the person starts near the center. Using their thoughts, they move the robotic arm to hover above the object. The movement at this step is only in the plane above the objects; that's the 2D nature of what is shown here. The line shows the trajectory for each case. All you see here are the trajectories and the circles representing the objects. The three frames are for three test subjects.
You can see that the subjects vary in how easily they reach the objects, but some are very efficient.
If you are wondering about trajectories that seem to enter and then leave the target circle... The test continues until the subject stays within the circle, above the object, for two seconds. In the full test, the subject then lowers the arm and attempts to grasp the object; results for that part of the test are not shown here.
This is the lower half of Figure 7a from the article. (The full Figure 7a shows the results for six subjects.)
|
As noted with the figure above, subjects were asked to break the task of getting to the object into stages. The first stage involved 2D movement to get above the object. The second stage was to lower the arm to the object. The purpose of this staging was to allow simplification of the software needed to analyze the brain signals.
The article represents further progress in developing brain-computer interfaces, allowing people to use their thoughts to achieve movement. It now seems likely that surgically implanted electrodes may not be needed. This is a significant simplification of the hardware.
News stories:
* How to control a robotic arm with your mind -- no implanted electrodes required. (Kurzweil, December 14, 2016.)
* Controlling Robotic Arms With The Brain. (Neuroscience News, December 17, 2016.)
The article, which is freely available: Noninvasive Electroencephalogram Based Control of a Robotic Arm for Reach and Grasp Tasks. (J Meng et al, Scientific Reports 6:38565, December 14, 2016.)
Background posts include...
* Brain-computer interface: Paralyzed patients control robotic arm by their thoughts (June 16, 2012). The article discussed here is a perhaps a classic article in the field, for its groundbreaking success. It is reference 2 of the current article.
* Using your brain waves to log on to the computer (April 29, 2013). In this work, the brain waves were collected non-invasively. However, the usage was very limited. The current work can be thought of as an extension of this -- a major extension.
More...
* Graphene-based sensors for capturing your brain waves (April 22, 2023).
* Using a brain-computer interface to direct synthetic speech (July 16, 2019).
* Progress toward a practical brain-computer interface: self-calibrating software (March 28, 2016).
More about brains is on my page Biotechnology in the News (BITN) -- Other topics under Brain. It includes a list of brain-related Musings posts.
Why does Santa Claus prefer the North Pole?
December 22, 2016
The news story listed below appeared in one of my regular and trusted sources a few days ago. It seems worth sharing.
The more important question might be why Santa Claus prefers poles. The author's title seems to include that issue, but he notes it only in passing at the end. Nevertheless, it's a fun story, and full of much good information about our Poles.
News story: Polarized: What makes the North Pole the ideal location for Santa and his crew? (Z Kerrigan, oceanbites, December 13, 2016.)
Kudos to oceanbites for a steady stream of well-written stories. The scope is broad, and the team is quite capable of combining fun and science. Check out the oceanbites site, and consider signing up for their e-mail announcements. It is from the Graduate School of Oceanography at the University of Rhode Island.
Previous post about Santa Claus: A flu shot for Santa Claus? (December 5, 2009)
Next: A bone from the original Santa Claus? (December 18, 2017).
Posts about the Earth's polar regions include...
* What if your compass pointed south? (October 24, 2014).
* IceCube finds 28 neutrinos -- from beyond the solar system (June 8, 2014). Good picture!
* A polar bear update (June 3, 2012).
* Mammoth hemoglobin (February 1, 2011).
December 19, 2016
3D printing: Make yourself a model of the universe
December 19, 2016
|
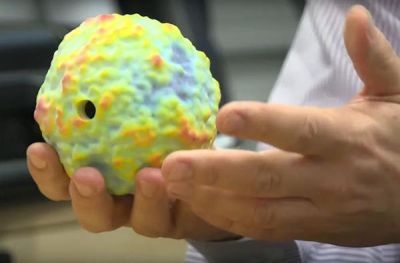
You, too, can hold the universe in your hand. Your very own model of the universe.
Just use the files provided with the article listed below, and print it out.
This is from the news story from 3Ders.org.
|
What's the point of the model? The topography of the model reflects the best information available on the cosmic microwave background (CMB).That's the afterglow from the early universe, about 300,000 years after the Big Bang. To a first approximation, it is uniform, but the detailed observations show that there are tiny fluctuations. The universe has cooled over the billions of years so that the CMB has an effective temperature of about 2.7 Kelvins. The fluctuations are a few tens of microkelvins.
Those fluctuations reflect small differences in the density of the early universe. Regions with a higher density became focal points for the condensation of matter by gravity. At least, that is the current model for the beginnings of the universe. Those high density regions are shown as bumps -- greatly exaggerated -- and also by color.
With this model, you can feel -- as well as see -- variations in the structure of the universe that were established over 13 billion years ago.
The authors intend that the model have educational value. The work was done largely by undergraduate students at Imperial Collage London, and much of the article discusses how the original data were adapted to allow this type of printing. They note that this could be a precedent for displaying other types of astronomical data.
News stories:
* How to 3D-print your own baby universe. (Kurzweil, November 1, 2016.)
* Scientists have made a tiny model of the universe that you can 3D print at home. (3Ders.org, October 28, 2016.)
Video: 3D print your own baby universe. (YouTube; 5 minutes.) Narrated by the lead author, Dave Clements. Perhaps a useful presentation.
The article, which may be freely available: Cosmic sculpture: a new way to visualise the cosmic microwave background. (D L Clements et al, European Journal of Physics 38:015601, published online October 28, 2016, to appear in January 2017 issue.)
Musings has not discussed the CMB, but posts on the early universe include...
* A galaxy far, far away: the story of MACS 1149-JD (October 12, 2012).
* Quark soup (August 15, 2011).
Well, there has been one post about microwaves in astronomy: Astronomers identify source of peryton signals received by radio telescopes: it is the microwave oven in the observatory kitchen (April 24, 2015).
There are numerous posts about 3D printing. The sampling here includes the most recent, plus a couple more making something useful and a couple making models. Some include links to more.
* Colloidal microswimmers: 3D printing a micro-boat (December 13, 2020).
* Need a new bone? Just print it out (November 13, 2016).
* 3D printing for space: a titanium woov, and more (April 29, 2014).
* 3D printing: simple inexpensive prosthetic arms (January 29, 2014).
* 3D printing: Sculplexity -- and a printed model of a forest fire (December 29, 2013).
* 3D printing: Neurosurgeons can practice on a printed model of a specific patient's head (December 16, 2013).
Do monkeys make stone tools?
December 18, 2016
It was an important step in human history when we learned to make stone tools. Right?
A new article presents an interesting observation of "stone tools", and provides a caution about how such a find should be interpreted.
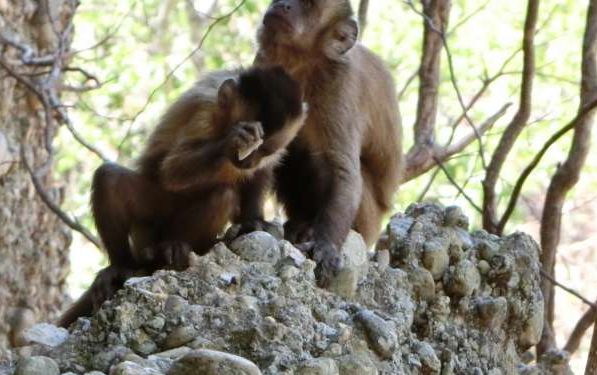
Look at the rock in his hand.
What is he going to do with it? It may be obvious, but go watch the video (see below) for the action.
These are New World monkeys: bearded capuchins, Sapajus libidinosus, in Brazil.
This is trimmed from the figure in the Phys.org news story.
|
Video: Wild monkeys flake stone tools. (YouTube; 7 minutes. No narration, but there is relevant sound; after all, this is percussion. Some labeling, in Portuguese.) The first half shows what the monkeys do; the second half shows some of the "stone tools" they made. Skip around as you wish.
Why the monkeys are doing this is unknown. They certainly are doing it intentionally, but it is not clear why. One small clue may be the observation of them licking the stones, but even then it is not clear why they would do that.
One thing does seem clear. There is no evidence that the monkeys use what they make in any way that could conceivably be called tool use. And that's the point. Finding "stone tools" does not imply tool use. We see here that primates not on the ape lineage can make things that look like stone tools, but it is unlikely that they are. Simply finding things that look like stone tools does not imply a tool-maker. The use of stone tools may be uniquely human; claims of tool use must be supported by some evidence of actual use. (On the other hand, it may be interesting to note that at least some animals have an ability -- and even a "desire" -- to make flaked stones; that may have led to tool use, and therefore tool making, at some point.)
Anyway, enjoy the video.
Capuchins use stones for breaking things, such as nuts. The current work is about stone tools with sharp edges for cutting.
The snake (in the video)? It's actually a monkey tail. I think.
Do the monkeys know they are being watched? I can't tell from anything in the article. Just watching the video, they certainly look like they are watching back.
News stories:
* Monkeys smash theory that only humans can make sharp stone tools. (H Devlin, Guardian, October 19, 2016.)
* Monkeys are seen making stone flakes so humans are 'not unique' after all. (Phys.org, October 19, 2016.)
* News story accompanying the article: Behavioural Biology: Stones that could cause ripples. (H Roche, Nature 539:34, November 3, 2016.)
* The article: Wild monkeys flake stone tools. (T Proffitt et al, Nature 539:85, November 3, 2016.) There are two videos posted with the article as Supplementary Information. I think that the video listed above is substantially a fusion of them.
More stone tool stories...
* Can we distinguish monkey tools and human tools? (April 17, 2023).
* How long ago did mankind arrive in the Americas? (March 18, 2016).
* Did Lucy butcher a cow? (February 11, 2011).
* Crocodiles, humans, and stones (November 13, 2009).
More monkeys:
* Also from Brazil... Use of instructional videos -- in the wild (November 3, 2014).
* Pink corn or blue? How do the monkeys decide? (June 9, 2013). Links to more.
* For those who like baby pictures... The first chimeric monkeys (February 5, 2012).
And maybe even a monkey tail? Quiz: The monkey-cat (October 26, 2011).
How long is a yawn?
December 16, 2016
Well, that may depend on how big your brain is.
Here's some data...
|
The graph shows the average length of yawns (in seconds) vs the average brain weight for the species, for 19 species of mammals.
Filled circles are for primates; open circles are for other mammals.
(The high point, just above 6 s, is for humans.)
This is Figure 1a from the article.
|
You can see that yawn duration tends to increase with brain size.
If the yawn data are plotted vs the average number of cortical neurons, the relationship looks even better (Figure 1c in the article).
That's it. That's the major finding from a recent article on yawn lengths.
What does this mean? I don't know. Someone measured something unusual, something we can at least relate to. It's interesting.
The authors note that yawning is poorly understood. Some proposed explanations suggest that it plays a role in brain function; such models may predict there should be a relationship between brain size and yawn length. That's the kind of reasoning that led them to do this work. The results here support such a relationship, and point to the need for further work. In fact, there is a table in the article full of suggestions for further work.
One question is whether the relationship might hold within a species. Do small humans have shorter yawns than bigger humans? Maybe related to age? Or to some cognitive ability? Is it possible that yawn length could help diagnose microcephaly in babies, a condition caused by Zika virus? That's pure speculation at this point, but perhaps worth checking.
News story: Yawning found to last longer in mammals with higher cortical numbers. (B Yirka, Phys.org, October 5, 2016.)
The article: Yawn duration predicts brain weight and cortical neuron number in mammals. (A C Gallup et al, Biology Letters 12:20160545, October 2016.)
Where did they get the yawns? Mostly from YouTube. The Supplemental Material posted with the article includes a list; you can check them out for yourself.
More about yawns: Do dogs respond to their owner's yawns? (May 29, 2012).
A post about Zika-related microcephaly: Zika: An estimate of the risk of microcephaly, outside Brazil (March 30, 2016).
My page for Biotechnology in the News (BITN) -- Other topics includes sections on Brain (autism, schizophrenia) and on Zika. Each includes a list of related posts.
Also see: How long is a hug? (March 29, 2011).
December 14, 2016
Immigration and asylum-seeking
December 14, 2016
Immigration is a big issue in many places. A divisive issue. It has played a role in numerous major elections recently. One aspect of immigration involves asylum seekers.
A team of scientists has looked at how people think about asylum seekers. They have done this as a scientific study, outside of the political arena. The basic plan of the study was to ask 18,000 people from diverse European countries to evaluate hypothetical asylum applications based on specific attributes that the scientists listed. The collection of applications contained random combinations of attributes.
Here is an excerpt to illustrate what the scientists did and how they reported the results...

Attribute questions and the possible choices are listed at the left. For example, the first attribute is "asylum testimony". It was scored as having no/minor/major inconsistencies -- the three choices listed under the attribute. (These choices were shown by the scientists on the application. That is, the interviewees were given the scoring.)
The x-axis is "Effect on probability of acceptance". The darker vertical line in the middle is zero. The white grid lines to each side mark +/- 0.1 intervals. (0.1 here means a 10% effect in the likelihood of being accepted.)
To understand the data presentation, let's focus on the upper left. There are three reddish points, one for each of the choices. The position of a point shows how that choice affected the probability of the 18,000 interviewees accepting the person for asylum. That comes from a statistical analysis of all the responses. Importantly, the first point is an open circle -- and is at zero on the x-axis scale. That's true for each attribute; the first response is set to zero, and the others are compared to it. In this case, the responses of minor or major inconsistencies in the application resulted in a small or larger penalty, respectively. With luck, those findings "make sense".
The next attribute, just below asylum testimony, is the gender of the asylum applicant. "Female" is set to zero; relative to that, males are viewed a little less favorably.
There is a long list of attributes; I've shown just a couple to illustrate the graph.
One presentation of the data is for the entire set of 18,000 interviewees as a single set. (That is Figure 2 of the article.) But the scientists also break the total set down into subgroups, in various ways. The graph above illustrates that. The data are shown separately for interviewees with low or high education (left and right sides, respectively). You can see that, qualitatively, the pattern is similar in both subgroups, although there are some quantitative differences.
This is an excerpt from Figure 3 from the article.
|
The asylum-seeker attributes studied include, in addition to the two shown above: country of origin, age, previous occupation, vulnerability, reason for migrating, religion, language skills.
The variables examined include, in addition to education level (shown above): ideology (left, right), age (young, old), and income (below or above median). In general, these variables showed only small effects, though some significant effects of ideology were found.
The study was conducted in 15 European countries, with a wide range in how many asylum applications they received (per capita).
It's hard to know what to make of all this. The scientists take an important public issue, and try to address it scientifically. They note that such studies should inform public policy. That is, public policy should take into account the views of the citizenry. Perhaps there are other roles for such studies, in trying to understand how the citizenry thinks, and addressing their concerns.
News coverage of such a study is inevitably messy, with some reflecting the news writer as much as the study. The two news stories listed below both give a good overview of the work. You can find a broader range of news coverage by putting the article title into a search engine. Be careful; some points in the article are complicated. If a point is important, or you find conflicting presentations of a point, be sure to check the article itself to see what they actually found.
I found it interesting that the work was done, and I enjoyed reading the article. In presenting it here, that's the idea... Read about what they did, but be very cautious about reaching conclusions.
News stories:
* These are the kinds of refugees that Europeans want to accept. (A Chen, The Verge, September 22, 2016.)
* Europeans Favour High-Skilled, Vulnerable And Christian Refugees. (Future Leadership Institute, September 24, 2016.)
The article: How economic, humanitarian, and religious concerns shape European attitudes toward asylum seekers. (K Bansak et al, Science 354:217, October 14, 2016.) The main text of the article is quite readable, but there is lot of detail, both procedures and data, behind it. (The file of Supplementary Materials accompanying the formal article is 121 pages.)
Also see:
* Political bias in Internet access? (January 23, 2017).
* Why some people don't leave fingerprints (September 19, 2011).
* Genomic information: What not to do. (January 16, 2010).
What if there isn't any dark matter? Is MOND an alternative?
December 12, 2016
Most of the matter in the universe, about 80%, is a type of matter we have never seen. We call it dark matter.
Or maybe not. Maybe there is no such thing as dark matter. After all, if we have never seen it, why are we so sure it is there?
It's a good question. The idea of dark matter was invoked many decades ago to explain a discrepancy between the motions of galaxies and their mass. But at least in principle there is an alternative way to explain the discrepancy, and that is to modify the law of gravity. It's called MOND, for modified Newtonian dynamics. People have explored modified gravity models, and they generally have not caught on. The discrepancy stands, and there is no real evidence for any explanation.
A new story in Quanta Magazine is a good discussion of the story of dark matter and MOND -- stimulated by some recent articles. In particular, one current article, posted at ArXiv as a preprint, offers a modified law of gravity that is derived from the laws of physics. It explains at least some of the observations that dark matter is supposed to explain. That is, it is not just an ad hoc gravity adjusted to fit the discrepancy, but a theoretical prediction that gravity should act this way.
It's all very complicated and almost incomprehensible. Physicists are intrigued by the new work, but even the author admits it is an incomplete story. Our goal here is to outline some of the questions. We have no answers; physicists have no answers. And in that spirit, our only source material here is the Quanta story, though it links to much more.
I encourage you to look over the Quanta story. If nothing else, it should remind us that dark matter is still a hypothesis, one whose verification has proven frustrating so far.
News story: The Case Against Dark Matter -- A proposed theory of gravity does away with dark matter, even as new astrophysical findings challenge the need for galaxies full of the invisible mystery particles. (N Wolchover, Quanta Magazine, November 29, 2016.) It links to the new and not-yet-published model on MOND at ArXiv. Caution...That is a long and very mathematical article. However, I found some of the introduction and discussion quite readable.
More about dark matter...
* A galaxy that lacks dark matter? (June 12, 2018).
* Should physicists be allowed to use lead from ancient Roman shipwrecks? (December 2, 2013).
* Where is the dark matter? (May 11, 2012). In this post we discussed why physicists postulated the existence of dark matter, but we did not consider alternatives.
More about gravity...
* Measuring a weak gravitational interaction (June 7, 2021).
* Gravitational waves: What caused them, and how do we know? (November 1, 2016).
Zebrafish reveal another clue about how to regenerate heart muscle
December 11, 2016
Zebrafish can regenerate heart tissue after an injury; (adult) mice -- and humans -- cannot. We would love to change that for the mice -- or at least for the humans. Is it possible that we can learn from the fish how to regenerate heart tissue in mammals? Even better, if we dream a little... What if we could inject something from the fish into the mouse heart that would stimulate regeneration there?
Look...
|
In this experiment, mice were given an artificial heart attack. They were then given various treatments, and heart function was measured for six weeks.
The measurement here is the ejection fraction (from the left ventricle). It is the fraction of the ventricle volume that is actually pumped out. High is good; a damaged heart is poor at pumping out blood.
|
The bottom curve (green triangles) is a control. No treatment; the mice were just injected with saline solution. The ejection fraction falls off over the six week period of observation.
All the other treatments gave better results. That is, the measurement of heart function declined less. That's of interest.
This is Figure 3C from the article.
|
What are these treatments that reduced the decline of heart function? The two best ones are labeled, after the first letter, zECM (black circles; red squares). zECM stands for zebrafish extracellular matrix. What's that? It's some tissue with the cells removed. That is, it's the stuff around the cells, which biologists call the extracellular matrix (ECM). (Much of it is collagen.) There has been a lot of work on ECM in recent years, with an increasing appreciation of its importance. It provides the environment for cells. And it affects them.
The two best treatments shown above are ECM from zebrafish. More specifically, from zebrafish heart. One says nzECM; the n stands for normal heart. The other is hzECM; the h stands for healing heart. This ECM is from fish heart that was itself healing. Both work, but the healing ECM is a little better. Other experiments in the article show that the zECM stimulates proliferation of heart cells in the recovering mice.
The other treatment? mECM (blue circles). Mouse ECM. Looks like it worked a little. But fish ECM worked better -- in the mice.
This is so full of hints that it is hard to know what to do next. It's not a cure. The best treatment shown above merely slows the decline in heart function. That's good, but is not enough. What happens over longer times? What more is needed? What is this z stuff doing, and why is hz better? Is that slight benefit for mECM real, and potentially useful if only we could enhance it? What about humans?
It's a tantalizing article.
News stories:
* A fishy solution to restoring the heart's regenerative abilities. (L-A Lee, New Atlas, November 23, 2016.) A useful overview of the work, despite some language problems.
* How do you mend a broken heart? (Science Daily, November 22, 2016.)
The article, which is freely available: Decellularized zebrafish cardiac extracellular matrix induces mammalian heart regeneration. (W C W Chen et al, Science Advances 2:e1600844, November 18, 2016.)
More about the ECM, also in the context of healing: Targeting growth factors to where they are needed (April 21, 2014).
More about heart damage...
* Failure to regenerate heart tissue: role of thyroid hormone (May 14, 2019).
* Heart regeneration? Role of MNDCMs (November 10, 2017).
* Human heart organoids show ability to regenerate (May 2, 2017).
* Synthetic stem cells? (April 30, 2017).
* The role of mutation in heart disease? (April 25, 2017).
* Can we pinpoint a specific molecular explanation for tissue damage following a heart attack? (March 24, 2015).
* Fixing the heart with some glue and light (July 27, 2014).
More zebrafish...
* What if zebrafish could get human cancer? (October 25, 2017).
* Scoliosis: an animal model (July 22, 2016).
I have a Biotechnology in the News (BITN) page for Cloning and stem cells. It includes an extensive list of Musings posts in those broad areas, including regeneration.
Alternative microbial sources of insecticidal proteins
December 9, 2016
The bacterium Bacillus thuringiensis, often called Bt, makes proteins that are toxic to certain insect pests. Bt is a useful insecticide in the field. Further, the genes for its toxic proteins have been cloned into various plants, thus allowing the plants to make their own Bt toxins.
With extensive use of Bt toxins, some pests have developed resistance to them. It's much like the situation with antibiotics, where development of resistance limits the use.
What next? We would like to have alternatives -- for both insecticides and antibiotics.
Musings has noted resistance to Bt toxins and one approach to developing alternatives [links at the end].
A recent article reports a new approach to finding alternatives: the use of other microbes. That is, the scientists screened other bacteria to see if they made insecticidal proteins.
The article focuses on one protein called IPD072Aa, isolated from Pseudomonas chlororaphis. It is active against an important insect pest, the western corn rootworm (WCR) (Diabrotica virgifera virgifera LeConte). The work presented below was done with corn to which the gene for this new insecticidal protein had been added, by the usual recombinant DNA technologies. That is, this is transgenic corn, coding for the Pseudomonas insecticidal protein.
The following figure shows some results for this system.
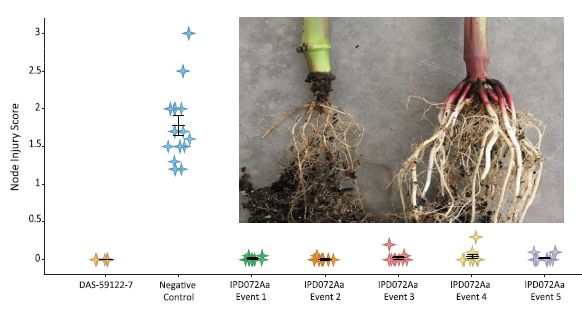
Let's start with the photo. It shows the roots of two corn plants, after infection with the western corn rootworm. One plant is wild type, one carries the gene for the new insecticidal protein. You can guess which is which.
The graph presents some quantitative data. The y-axis shows the "Node injury score"; the details of the score are not given in the article, except to note that the score can range from 0-3, as shown on the graph.
Each column is for one type of corn plant, as labeled across the bottom.
You can see that the injury scores are mostly near zero except for one column. That is the negative control: wild type corn, with no insecticide. All the other columns are for corn with an insecticide gene. The column at the left, with a DAS number, is for a commercial corn strain carrying a Bt toxin. It works. The several columns to the right, all labeled IPD072Aa, are for various corn strains with the new insecticide gene added. They all worked, more or less. (We don't know if the small differences between them are important.)
This is Figure 2 from the article.
|
In summary, the results above show that the new Pseudomonas insecticidal protein works, and is about as effective as a traditional Bt toxin.
In another test, the scientists used a mutant strain of the insect that has developed resistance to the Bt toxin. The new Pseudomonas toxin worked fine against it. That is, there seems to be no cross-resistance between old and new toxins.
The new toxin, from Pseudomonas, is promising, and deserves further testing. The work also suggests that further screening of microbes for new insecticides could be worthwhile.
News story: Scientists demonstrating future potential of new insect control traits in agriculture. (Phys.org, September 23, 2016.)
* News story accompanying the article: Biotechnology: Tips for battling billion-dollar beetles. (B E Tabashnik, Science 354:552, November 4, 2016.)
* The article: A selective insecticidal protein from Pseudomonas for controlling corn rootworms. (U Schellenberger et al, Science 354:634, November 4, 2016.) The article is from DuPont Pioneer.
Background posts:
* Resistance to Bt toxin: What next? (July 15, 2016).
* Development of insects resistant to Bt toxin from "genetically modified" corn (April 19, 2014). Studies the same kind of insect used in the current work.
More on corn:
* Atmospheric CO2 and the origin of domesticated corn (February 14, 2014).
* Pink corn or blue? How do the monkeys decide? (June 9, 2013).
For more on GM crops, see my Biotechnology in the News (BITN) page Agricultural biotechnology (GM foods) and Gene therapy.
More on novel sources of insecticides: A long worm with a novel toxin (April 28, 2018).
December 7, 2016
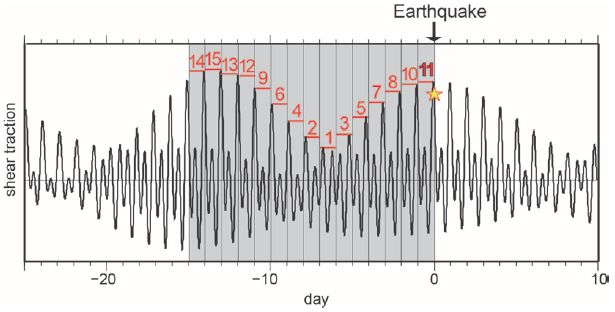
Violence within the species -- in various mammals; implications for the nature of humans
December 6, 2016
Humans kill other humans. Why? That's a complex issue, which is much debated.
A new article takes a novel approach, and offers some interesting food for thought.
The approach is to look at the frequency of con-specific violence -- killing one's own kind -- among diverse mammals, and then align the results with a phylogenetic tree. That is, the scientists ask if the level of con-specific violence looks like a heritable trait. There does not have to be a simple answer to that; the phylogenetic tree is a framework. They also look at the level of human violence in various human cultures, through the ages and with a variety of social structures. All of the data used here are from previously published work.
It's a big project; the brief article can only outline what was done. I suggest that readers emphasize following the approach and the points that are raised; exercise caution with the conclusions.
Level of con-specific violence is defined as the percent of individuals that is killed by a member of one's own species. For example, the level of human killing (or "lethal violence"), as used here, is the percentage of people killed by other people.
Let's start with a simple graph...
|
The graph shows the amount of con-specific killing for four groups of mammals. Each point summarizes the data for a couple hundred species with certain features.
The two variables are whether the species is social or solitary (x-axis), and whether it is territorial or not (labeled on the two lines on the graph).
You can see that the highest value for con-specific killing is for species that are both social and territorial. The lowest value is for species that are neither. There is about a 10-fold range between those extremes; the error bars within each group are relatively small.
This is Figure 2 from the article.
|
Perhaps that pattern makes some sense, and perhaps we can see how the two variables are related. In any case, we see that different species have different rates of violence, and that there is a connection to lifestyle.
What about humans? Well, they're complicated, aren't they? (Let's try to be detached about this.) For one thing, they have had many lifestyles, perhaps still do.
The following figure shows some data for human populations -- for different types of human societies.
It's a different type of graph, so let's get oriented. The graph above had a range of about 0-1% killing; that was for mammalian species in general. This graph, for humans, goes up to 65%. It's not really that bad. The graph show the results for many studies. ("n", shown at the bottom for each column, is the number of studies.) All the lone circles are outliers. The box part for each column shows the range of the middle 50% of the data; the black bar within the box shows the median of the data. The graph goes up to 65% because we are seeing lots of individual data points. And there is a lot of variability.
So, look at the medians -- those little bars in the "middle" of each box. Some of them are very low; a couple are near 5%. That is, the data for certain types of human societies suggests that they have a relatively high rate of humans killing humans. Those are for the groups labeled contemporary-bands and contemporary-tribes. The bar at the far right is also contemporary -- for those living in "states". And that bar shows a very low median.
This is Figure 3d from the article.
|
|
That's data. What does it mean?
The authors suggest that the con-specific killing in the earliest humans was probably very near what one would expect from their closest relatives, the apes. The apes have quite high rates of killing their own kind, around 2%. (It is about 0.3% for mammals overall.) It has varied -- a lot -- during human history, and depends strongly on the type of human society. In modern state-based societies, it is actually relatively low -- by the standard of human history. It may even be as low as 0.01% in some modern societies.
That phylogenetic tree I mentioned near the start? Figure 1 of the article shows that tree for 1024 mammalian species, color-coded by the level of con-specific killing. It's an overwhelming figure, and actually hard to read. Remember, the tree is part of their approach, not "the answer". We have discussed some parts of what they found. (That figure is included in Tarlach's news story, listed below.)
It's an intriguing article. Five pages, summarizing data on a thousand mammalian species and a wide range of human societies. As you can see, the data vary widely. I think the point of the article is to lay out the data, and suggest a type of analysis. The merit of the approach and certainly the validity of any interpretations must remain open for now.
News stories:
* Violence: Are Humans Bad To The Bone? (G Tarlach, Dead Things (blog at Discover), September 28, 2016.)
* The Origin of Human Lethal Violence -- Are humans the most violent animal? (A Fuentes, Psychology Today, September 29, 2016.) A critical view.
* News story accompanying the article: Animal Behaviour: Lethal violence deep in the human lineage. (M Pagel, Nature 538:180, October 13, 2016.)
* The article: The phylogenetic roots of human lethal violence. (J M Gómez et al, Nature 538:233, October 13, 2016.)
More on human violence
* In the aftermath of gun violence... (January 8, 2018).
* The earliest human warfare? (February 17, 2016).
* Human violence (November 28, 2011).
A dispute about an issue in a Musings post: the four-legged snake
December 5, 2016
In an earlier post, we noted a fossil that was claimed to be a four-legged snake. If true, it might represent a transitional form between lizards and modern snakes.
Original post: Quiz: What is it? (August 17, 2015).
That claim has now been challenged, with another group claiming that the fossil is simply a lizard. The challenge was made at a recent scientific meeting, and has not yet been formally published. The authors of the original work, not surprisingly, dispute the challenge.
There is not much we can do with this at this point. Fossil claims are often contentious. Over time, people discuss and debate them; with luck, a consensus is reached. And maybe new specimens are uncovered, adding new evidence to the story.
Additional issues have been raised, beyond the scientific interpretation. They involve the history of the specimen itself.
* There is concern whether the specimen, a Brazilian fossil studied in Germany, was acquired legally. The news stories describe the concern. It may be unresolvable. That is, the history of the specimen may be undocumented. (The claim of improper action here is not against the scientists who did the current work.)
* There was a question about whether the specimen is now available at all. This has been resolved, as noted in the story at Science labeled "update". It's status may not yet be clear, but at least we know where it is.
Science in progress. So long as the specimen is available for scientists to see and analyze, work will continue. The scientists may or may reach agreement on the nature of this specimen. Meanwhile, the question of how snakes evolved remains.
News stories:
* Update: Controversial 'four-legged snake' may be ancient lizard instead. (C Gramling, Science, November 11, 2016.) This page starts with a brief update, noting that the fossil is now available again. Beyond that is the original news story, from a few days earlier.
* Mistaken Identity? Debate Over Ancient 4-Legged Snake Heats Up. (L Geggel, Live Science, October 28, 2016.)
You might also want to read Ed Yong's news story linked to the original post. It hints at the controversy that has developed.
The oldest known syrinx
December 4, 2016
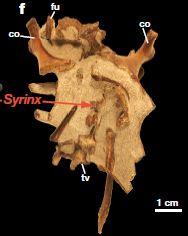
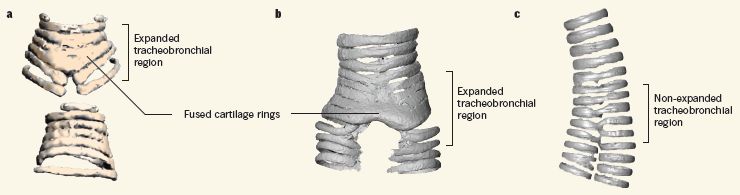
|
It's there at the tip of the red arrow.
This syrinx is from a bird called Vegavis iaai.
It's about 66 million years old.
This is Figure 1f from the article.
|
What is a syrinx? It is the vocal organ of birds. It is a variation of the larynx more generally found in vertebrates. The syrinx shown here is the oldest known syrinx (by at least 63 million years), and may offer clues about the origin of bird vocalizations. The syrinx is used for bird song, but also for the honking in geese; Vegavis is related to the geese and ducks.
What is special about the syrinx? The following figure gives the idea...
Skip frame a for the moment. Frame b shows the vocal organ structure in a modern bird (a duck); frame c shows the same region for an alligator.
The scientists analyzed the Vegavis fossil, using X-rays. They basically gave the bird a CT scan, and determined the detailed 3D structure. Frame a shows what the scientists found for the fossil bird here. It shows key features of how the cartilage rings, which support the sound-producing membranes, are arranged; it's more like a bird (frame b) than an alligator (frame c). It's a syrinx.
This is Figure 1 from the news story in Nature accompanying the article. Figure 3 of the article shows the syrinx and related structures from many birds and related animals.
|
The authors interpret the finding, the oldest known syrinx, as suggesting that the bird vocal organ evolved rather late in the development of birds, and that it is not present in the non-avian dinosaurs that were the bird ancestors. Vegavis may have honked, but its dinosaur ancestors did not.
It's all logical, given the evidence at hand, but remember that such conclusions may need changing as new fossils are found. Nevertheless, it is an interesting finding.
News stories:
* Vegavis iaai: Dinosaurs Likely Did Not Sing, Vocal Organ of Mesozoic Bird. (Sci.News, October 13, 2016.)
* Missing Syrinx Found! Mesozoic Vegavis vocalization verified. (G Laden, 10,000 Birds, October 18, 2016.)
* News story accompanying the article: Palaeontology: Ancient avian aria from Antarctica. (P M O'Connor, Nature 538:468, October 27, 2016.)
* The article: Fossil evidence of the avian vocal organ from the Mesozoic. (J A Clarke et al, Nature 538:502, October 27, 2016.)
The species name? This bird is named after an acronym. The IAA is the Instituto Antartico Argentino. Go check the Wikipedia page for the genus Vegavis.
Recent posts about song birds...
* Bird brains -- better than mammalian brains? (June 24, 2016).
* Huntington's disease: Mutant human protein disrupts singing in birds (April 18, 2016).
and dinosaurs... Red color vision in dinosaurs? (October 17, 2016).
More cartilage: Using your nose to fix knee damage (January 28, 2017).
Treating asthma with a hookworm protein?
December 2, 2016
Asthma is of increasing importance in our modern world. It seems to involve a hypersensitive immune system; other conditions that reflect immune hypersensitivity also increase in developed countries.
Maybe some intestinal worms would solve the problem. They keep the immune system in check; there is little asthma in areas where intestinal worms are common.
Musings has noted this issue before. The term hygiene hypothesis is sometimes used for the idea that our increased cleanliness leads to immune hypersensitivity. The underlying reason is that our immune system is not routinely exposed to the things it used to be exposed to. Not only do we miss their antigens, but common parasites actually send out regulatory proteins that modulate our immune system.
In one recent post, we noted that an experimental worm infection reduced immune hypersensitivity in mice [link at the end, along with that for another background post].
Can we do better? Can we reduce the asthma with something less drastic than a worm infection? Maybe just the part of the worm that does what we need?
A new article reports doing just that, again in mice. It's interesting, and encouraging.
The following figure summarizes the results of one experiment to illustrate the point...
|
The figure shows the amount of IgE antibodies made in the mice under four conditions. IgE antibodies are the ones associated with allergic reactions.
The four conditions are labeled at the bottom. For each bar, there are two pieces of information. The lower one is the stimulus; the upper one is the treatment.
|
The left hand bar is labeled PBS, PBS. PBS is the buffer. This is a negative control: no stimulus, no treatment. Nothing happened.
The next bar has a stimulus OVA. That's ovalbumin, a convenient protein for inducing allergy. No treatment (just the PBS buffer). A large allergic reaction, as expected.
The next two bars also have OVA stimulus. But the IgE response is almost gone. What happened? They were treated with hookworm stuff. AcES stands for Ancylostoma caninum excretory/secretory. The first part of that is the name of the hookworm. The second part is where the stuff comes from. That is, the treatment for the third bar (the gray one) is a crude mixture of stuff that comes out of the worm. That is the worm stuff we are most exposed to, and it works.
The final bar (right side; red) has a treatment with AIP-2 -- anti-inflammatory protein-2. It is one of those proteins from the AcES. It works just fine.
This is Figure 1D from the article.
|
The above graph shows that a single protein secreted by the hookworm can reduce the allergic response in a mouse model of asthma. The protein also reduced airway inflammation in the mice.
The scientists now make a clean version of this protein using a cloned gene in a yeast. It's no longer a hookworm infection or even a hookworm secretion.
If this worked in humans, it would offer the possibility of a simple treatment for asthma, and perhaps other problems of immune hypersensitivity. It is a treatment with the logical basis that it helps restore us to the state before asthma became prevalent -- but without the side effects of having intestinal worms. The scientists do have some evidence from human cell cultures that the protein acts similarly as in mouse cells. But it is still a big jump to actual use in humans. Safety issues, especially long term, would be paramount. After all, it is a treatment designed to interfere with the immune system.
It's a development worth following, but it will be a long road to show it is a useful treatment.
The same labs are also working with inflammatory bowel disease. They have evidence that the hookworms, and specifically the same protein studied here, may be effective for that condition, too.
News stories:
* Asthmatics could breathe easier in the future with help from an unlikely quarter -- parasitic hookworms. (Medical Xpress, October 26, 2016.)
* Hookworms could help treat asthma. (H Whiteman, Medical News Today, October 28, 2016.)
The article: Hookworm recombinant protein promotes regulatory T cell responses that suppress experimental asthma. (S Navarro et al, Science Translational Medicine 8:362ra143, October 26, 2016.)
Background posts:
* How intestinal worms benefit the host immune system (February 27, 2016).
* Reducing asthma: Should the child have a pet, perhaps a cow? (November 28, 2015).
More asthma: A vaccine against asthma? (July 3, 2021).
More inflammatory bowel disease: A phage treatment for inflammatory bowel disease (August 13, 2022).
November 30, 2016
How long can humans live?
November 29, 2016
Some data...
Start with part a (left side). The graph shows the age of the oldest person to die in a year vs year. For example... the first point shows that in the year 1969 (x-axis; the point might be at 1968) the oldest person to die that year was 111 years old (y-axis).
Data for early years (up through 1994) is shown with blue points; data for more recent years is shown with orange points.
Best-fit linear regression lines are shown for each of those two color-coded sets of data.
You can see that the oldest age at death increases with year for the blue set, and decreases with year for the orange set.
That is, it seems that the maximum lifespan of humans, as judged by the age of the oldest person to die, increased up to about 1994, but decreased after that.
Now look at part b (right side). This is similar, but shows not only the data for the oldest person to die each year, but also the second-oldest, third-oldest and so forth. This graph doesn't show the raw data points, but smoothed lines through them. (Actually, the points are shown for the oldest person; those are the same points as in part a.)
* MRAD = maximum reported age at death; that is what is plotted in part a. RAD = reported age at death.
You can see that the pattern is similar for the oldest and second-oldest persons, and so on. We won't specify how far that pattern holds.
This is part of Figure 2 from the article.
|
That's the data. The question is, what does it mean? Turns out it has stimulated considerable discussion and controversy. And it's not quibbling about the data or even the way lines are drawn. In particular, it doesn't matter (much) whether the curves decline after 1994 or merely level off. Let's assume that the data and patterns suggested above are more or less correct. What would it mean?
The authors are pessimists about the human lifespan. They think that the peak (age 122 in 1997, a very famous lady named Jeanne Calment) is something of a fluke, and that a MRAD that high may occur only rarely.
Others would argue that the advances in medicine we know so much about have not addressed the maximum lifespan, and that there is no reason to doubt that it can be addressed.
I find the graphs intriguing. Personally, I would be willing to just show the graphs and stop. Who knows what the future holds. But the two news stories below, one from a biased organization, will guide you through some of the debate. It's interesting and fun; just be cautious about drawing conclusions.
News stories:
* Human lifespan has hit its natural limit, research suggests. (N Davis, Guardian, October 5, 2016.)
* A Discussion of Natural Limits on Lifespan, for Some Definition of Natural. (Fight Aging!, October 5, 2016.) I am unfamiliar with this site, but the page seems worthwhile. It is a biased source, but much of what they say about the limitations of the study is good. Any speculative predictions, theirs or anyone else's, are just that. So read this recognizing the nature of the source; it's a good page about the current article.
This may be a good time to remind you... If you'd like more news stories about an article, a good approach is to copy the article title and paste it into your search engine. (For current articles, I usually limit the date to the "last year".) Browse the listings as you wish. Some articles, such as this one, generate extensive news coverage, with a wide range of opinions.
* News story accompanying the article: Ageing: Measuring our narrow strip of life. (S J Olshansky, Nature 538:175, October 13, 2016.)
* The article: Evidence for a limit to human lifespan. (X Dong et al, Nature 538:257, October 13, 2016.)
The article has generated considerable discussion at the journal web site. There are five formal responses posted there, each with a reply from the authors. I'm not sure there are any big lessons from that follow-up, but if you are intrigued, check it out. (You will need subscription access.)
Most recent post on aging: Extending lifespan by dietary restriction: can we fake it? (August 10, 2016).
Follow-up post: Follow-up: How long can humans live? (July 23, 2018).
More about the mammalian lifespan: Do naked mole rats get old? (April 20, 2018).
My page for Biotechnology in the News (BITN) -- Other topics includes a section on Aging. It includes a list of related Musings posts. There is also a separate list of posts about centenarians.
CRISPR: First clinical trial in humans
November 28, 2016
Briefly noted...
It has happened... For the first time, CRISPR has been used in a formal clinical trial with humans.
It is a Phase I trial; the main purpose at this point is safety. The number of patients so far is one. That's the proper way to start with something new: very cautiously. The number will grow to ten as the trial proceeds.
The trial involves a cancer treatment. Cells are removed from the patient. The cells are edited in the lab to inactivate a gene that limits the patient's immune response to the cancer. Edited cells are then injected back into the patient. The idea is that the patient's immune system will now act against the cancer. The general nature of the immune system intervention here is similar to that used with some other treatments; using CRISPR is an alternative way to achieve the result.
We won't know much more for a while -- hopefully. The only reason for news in the short term would be if something bad happens. With luck, the scientists will accumulate information over the coming months, mainly on safety. There is no particular expectation that the treatment will be effective in the Phase I trial, and any such information would be very preliminary.
It's step 1.
The following news story, which is freely available, is the main source of information at this point: CRISPR gene-editing tested in a person for the first time. (D Cyranoski, Nature News, November 15, 2016.)
Previous post about CRISPR: CRISPR notes (October 11, 2016).
More: Laika, the first de-PERVed pig (October 22, 2017).
A post that includes a complete list of posts on CRISPR and other gene editing techniques: CRISPR: an overview (February 15, 2015).
My page for Biotechnology in the News (BITN) -- Other topics includes a section on Cancer. It includes a list of related posts.
An example of what can happen when a clinical trial does not proceed cautiously is presented on that same BITN page in the section TGN1412: The clinical trial disaster.
How bumblebees learn to pull strings
November 27, 2016
Sometimes, to get what you want, you have to pull strings. It's such an important idea that the phrase has become a metaphor.
A new article explores the ability of bumblebees to learn to pull strings. Literally. By pulling a string, a bee can get to a meal.
Here is the test situation, in cartoon form...
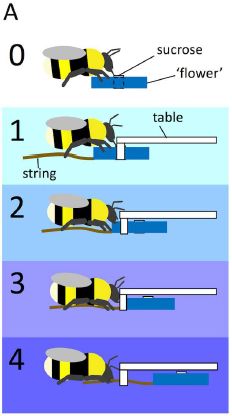
|
The top frame, labeled 0, shows a bee and a flower. The blue bar represents an artificial flower; it contains a small vial of sucrose solution in the middle. (The flower is actually round; it looks bar-shaped here because it is viewed edge-on. The vial of sugar water is in the middle, just as nectar would be in the middle of a flower.) All the bees tested were first familiarized with this basic set-up.
The bottom frame, 4, shows the test that was the focus of the new work. The flower is under a transparent table. The bee can see the flower, but cannot get to it directly. There is a string attached to the flower. If the bee pulls the string, it can pull the flower out, and get its meal.
We'll note the other frames below.
The small white rectangle at the left end of the table? A table leg, I suspect. It's a distraction; ignore it. In particular, don't confuse that prominent white bar, which is not important, with the barely-visible vial of sugar water in the flower.
This is Figure 1A from the article.
|
The article reports several tests. Here is a summary of some key findings...
Naive bees. It is very rare for "naive" bees to pull the string. (Naive bees, in context, are those who have never done it, have not received any training, and have not seen it done.) The authors note that bees are used to pulling things. They know how to remove debris from the nest, for example. But apparently it is not at all natural for a bee to pull a string to gain access to the meal it can see. The authors also note that the bees that did solve this task on their own were unusually exploratory.
Training. Bees can be trained to pull the string, by teaching them one small step at a time. Frames 1-3 of the figure above show some intermediate steps between the open flower of frame 0 and the completely covered flower of frame 4. For example, in frame 1, the flower is about half open and half covered. If the bees are trained on these as successive steps, they learn how to access each flower in a small number of trials.
Learning by watching. Bees can learn to pull the string by watching other bees do it. Over time, the ability to pull strings is acquired by much of the colony.
It's an intriguing story of an animal learning something unfamiliar. Pulling a string to access flower nectar is not a normal part of bee knowledge. Bees that see the string leading to their food rarely figure out the connection. Those that do figure it out probably do so more by accident than by logic. Yet the bees are capable of being trained to do it, and they can learn it from each other. It may well be important in nature that an occasional bee can figure out a new task, and that others can learn from the "innovator".
All this in a bee.
News stories:
* Bumblebees show social learning. (ScienceNordic, October 19, 2016.)
* Bumblebees Can Learn to Pull Strings for Reward, New Study Shows. (Sci.News, October 5, 2016.)
The article, which is freely available: Associative Mechanisms Allow for Social Learning and Cultural Transmission of String Pulling in an Insect. (S Alem et al, PLoS Biology 14:e1002564, October 4, 2016.)
The article includes 18 video files, which are listed under "Supporting Information". You can browse the descriptions, and check some as you wish. The videos do not have sound or labeling; you need to read the descriptions in the article. Length varies from a few seconds to a few minutes.
Videos S1-S4 record examples of the four stages of training tests shown in the figure. Each is about 15 seconds. I suggest you go through these four videos just to get a basic feel for the testing. S4 shows an experienced bee accessing a flower that is under the table; she makes it look easy.
Videos S6 and S7 (few minutes each) show bees using the string for the first time. The one in S7 has observed other bees do it. She seems to know that the string is useful, but doesn't know how to use it. These two videos are interesting, but you need to be patient.
Caution... The numbers on the video files themselves do not match the listings. They are offset by 2. That is, the video listed as "S1 Video" has the file name ending in "...s003.MP4". It gets confusing.
Related, from the same lab... Bumblebees play ball (March 20, 2017).
More about what bees can learn... Zero? Do bees understand? (July 20, 2018).
A recent post about bumblebees and flowers... How bumblebees detect the electric field (October 22, 2016).
Also see: What should a plant do if it hears bees coming? (December 10, 2019).
More about animals learning from each other...
* Use of instructional videos -- in the wild (November 3, 2014).
* Cultural transmission of fishing techniques among dolphins (September 13, 2011).
More about pulling strings: The paperfuge: a centrifuge that costs 20 cents (April 17, 2017).
November 21, 2016
Guaico Culex virus: the first example of an animal virus that packages segments of its genome in different particles
November 21, 2016
It's a classic test to show that a single virus particle is sufficient to establish an infection... Infect a batch of cells with half as many virus particles, and get half as many infected cells. (Assume that the number of virus particles is fairly low, so that few cells get more than one.)
The following graph shows the results for such an experiment with the recently discovered Guaico Culex virus (GCXV). This virus infects mosquitoes of the genus Culex (the CX of the GCXV name).
|
The graph shows the number of plaques vs the amount of virus added. Plaques represent infected cells. The amount of virus added is shown as a dilution factor (x-axis).
Before we look at the actual results, let's look at what is expected. There are several light lines on the graph, numbered 1 through 5. The upper such line, labeled 1, is what one would expect if it takes one particle to make an infection. The next line is what one would expect if it takes two particles to make an infection. And so forth.
There are data for three amounts of virus. The first is somewhat oddly labeled as dilution factor x. Doesn't really matter, since they use x consistently; what matters is the relative amounts. You can think of the x point as 1, and so forth.
|
The data points are shown, with a best-fit line (dark line) for them. The data are quite inconsistent with one particle resulting in an infection. In fact, the data suggest that it takes 3-4 particles to make an infection. (The best-fit curve says 3.3.)
This is Figure 3 from the article.
|
That's an unusual result for a virus. In fact, for an animal virus, it may be the first case.
What's going on? The scientists analyze the viral genome and show that it consists of short pieces. Further, those pieces are packaged one per particle. That is, "a virus" is not one particle, but a collection of particles.
Influenza virus is an example of a virus with its genome in pieces. But each virus particle contains one copy of each piece. So we still have one virus particle representing the entire virus, and being sufficient to initiate an infection.
How many pieces are there, according to the genome analysis? Five, but one of them may not be required for growth of the virus. So maybe it's four essential pieces. That's consistent with the dilution data shown above, suggesting a little over three particles needed for an infection.
A virus such as this is known as a multi-component virus. That means it not only has a segmented genome (as does the flu virus), but that it puts the segments in different particles, so that it takes multiple particles for an infection. Multi-component viruses have been found before among plant and fungal viruses, but this is the first example for an animal virus.
Why does a virus do this? We don't have an answer. The total genome size for this virus is similar to that of related viruses. Because each particle contains only a piece of the genome, the individual particles are smaller. It's not obvious that is of value; surely the total amount of protein needed to make the set of particles is not reduced. The smaller particle size might be of some advantage with plant and fungal viruses, which tend to infect through small wounds. That's not what animal viruses normally do, so we are left with no explanation for the multi-component nature of this virus.
Viruses are extremely diverse, and the current virus is just another example of that diversity. Whether any of the known viruses that appear related to GCXV, and have segmented genomes, are also multi-component is an open question; the authors note that the issue has not been addressed for the related viruses. In any case, we now have viruses that seem similar with single genomes, segmented genomes, and now at least one that is multi-component. That raises interesting questions about how these types of viruses are related.
News story: Guaico Culex Virus: Researchers Find Multicomponent Animal Virus. (E de Lazaro, Sci.News, August 26, 2016.)
The article: A Multicomponent Animal Virus Isolated from Mosquitoes. (J T Ladner et al, Cell Host & Microbe 20:357, September 14, 2016.)
We noted above that there are viruses whose genome is related to that of the current virus, but which have the "traditional" genome style of a single RNA molecule. Those related viruses are the flaviviruses, such as Zika virus. A recent post on these viruses: Finding host genes that are required for growth of Zika virus (and related viruses) (August 8, 2016).
Posts on the flu virus are listed on the page Musings: Influenza (Swine flu). Some other virus posts are noted there.
A recent post about mosquitoes: Can chickens prevent malaria? (August 12, 2016).
This post is noted on my page Unusual microbes.
Do dolphins talk to each other?
November 19, 2016
A scientist has been recording conversations between two dolphins. He reports some of his findings in a new article; it's interesting and provocative.
The following figure shows two parts of one conversation. Both are from a particular dolphin, named Yana.
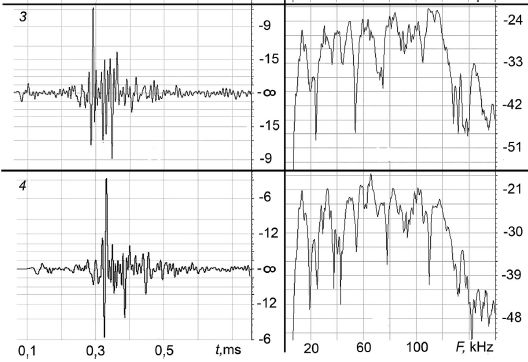
The left and right sides show two measured properties of what the dolphin said. Both are shown in decibels (dB), but don't worry about what the y-axis numbers mean. On the left is the loudness. It is plotted against time; note that the entire width of the graph is less than a millisecond (ms). On the right is the frequency distribution. It is plotted against the frequency, in kilohertz (kHz). The graph starts at about 10 kHz; the first label, 20 kHz, is at the upper end of human hearing. The high end was truncated at 160 kHz.
The key observation is that these two excerpts, called pulses, are different. If you look further at the full set of four (consecutive) pulses shown in the article, they are all different.
This is part of Figure 3 from the article. I chose to present two of the pulses for a sample comparison; using the last two, labeled above as 3 and 4, includes the graph x-axis labels.
|
The author suggests that the two pulses shown above are something like words from the conversation between his two dolphins. Further, a group (or "pack") of pulses is something like a sentence.
Let's step back and describe the situation. The author has a pair of dolphins. During feeding time, they are very near each other, and remain there doing little else. They "talk". The scientist records them. Because he uses multiple microphones, he can tell which dolphin is talking. The first observation is that they talk one at a time, often alternating.
He then goes on to do the high resolution analysis, as shown above. Clearly, the dolphins are not just making repetitive sounds. The pulses are complex and varied.
The author suggests that he is recording conversation between two intelligent animals. The give-and-take and the complexity of the sounds all suggest this is meaningful conversation. That is, he suggests that he is recording a spoken language of the dolphins.
Toward the end of the article, the author has a table that shows how various animals rate on criteria used to describe human language. The table lists 13 "design features" of spoken human language. He has columns for four animal languages: bee dancing, lark song, gibbon call, grey parrot's onomatopoeia. He rates those as best he can. For example, the gibbon call has 9 "+", 3 "-", and one "?". What happened to the dolphins? At the bottom, he says, "All of these design features ... are characteristic for the dolphin (and the human) spoken language... ."
What should we make of all this? I don't know. It is an interesting line of experimentation. At this point, it seems over-interpreted. What's important for now is that the work generate hypotheses, and lead to more testing. There is no need for us to reach a conclusion.
News stories:
* Researchers record dolphin 'conversation' revealing possible spoken language. (B Yirka, Phys.org, September 13, 2016.)
* Dolphin Dialects: first evidence of spoken language in cetaceans? (G Ober, oceanbites, September 14, 2016.)
The article, which is freely available: The study of acoustic signals and the supposed spoken language of the dolphins. (V A Ryabov, St. Petersburg Polytechnical University Journal: Physics and Mathematics 2:231, October 2016.)
Posts about dolphins include...
* How a dolphin signals it wants to play (December 11, 2024).
* Features of Alzheimer's disease in dolphins? (April 24, 2023).
* On a similarity of bats and dolphins (September 15, 2013).
* Cultural transmission of fishing techniques among dolphins (September 13, 2011).
Also see... Are some languages spoken faster than others? (November 21, 2011). The author of the current work argues that the dolphins speak about a hundred-fold faster than humans do.
November 16, 2016
How radioactive is your avocado (and some other common exposures)?
November 16, 2016
There is radiation all around us. Many natural materials have some level of radioactivity. A well known example is the banana, considered a good source of dietary potassium. But potassium is radioactive, because there is a small amount of the radioactive isotope K-40 in natural sources of potassium.
A new article surveys some common materials and measures the level of radiation we would get from them. The following graph is a summary...
|
<-- Bar is truncated; it goes to 1.5.
Radiation dose from various sources.
All the bars are for common household exposures, except for the uranium ore sample at the right.
This is Figure 10 from the article. The results are also tabulated in Table 1 of the article.
|
The first bar shows the level of background radiation at the particular site (near Raleigh, North Carolina). It is about 0.12 microgray per hour (µGy/h). (Background dose varies widely depending on where you live, largely due to variation in radon level. The background here is apparently "medium" level.)
An avocado gives about 0.03 µGy/h. The other exposures (other than that U ore) are broadly similar. They are low compared to background, even though most appear to be statistically significant.
All rates shown here are per hour. We are always exposed to the background radiation; if you spend an hour with an avocado, you will get the additional exposure.
There is nothing new or exciting here, just a reminder about our continuing exposure to low levels of radiation.
There are various technical details, including such things as sample size and distance, but in the general spirit of the article, we'll leave those. The measurements labeled "outside" are thought to reflect largely radon from the soil.
News story: Don't panic, but your avocado is radioactive -- study eyes background radiation of everyday objects. (R Hayes, Phys.org, October 7, 2016.) This may be by the senior author of the article. (It's not entirely clear.)
The article: Contributions of Various Radiological Sources to Background in a Suburban Environment. (R D Milvenan & R B Hayes, Health Physics 111 (Supplement 3):S193, November 2016.)
Also see: Measuring radiation: The banana standard (April 17, 2011).
Among the Musings posts on low level radiation... Berkeley RadWatch: Radiation in the environment (February 24, 2014).
My page of Introductory Chemistry Internet resources includes a section on Nucleosynthesis; astrochemistry; nuclear energy; radioactivity. That section contains some resources on the effects of radiation. The list of Musings posts there includes others on low level radiation.
This post is also listed there in the section Lanthanoids and actinoids.
Restoring lost hearing: lessons from the sea anemone
November 15, 2016
Hair cells play a key role in hearing. The vibrations of the tiny hairs are an early step. Damage to hair cells is an important cause of hearing loss. In mammals, such damage to hair cells is largely irreversible.
Some animals can repair damaged hair cells. Such animals include birds -- and sea anemones.
The hair cells of the sea anemones are from the tentacles, where they help detect vibrations in the water. The hair cells of mammals, of course, are from the cochlea of the ear. The nature of the hair cells is similar.
A recent article reports an intriguing experiment. The basic design of the experiment is to take mouse hair cells in the lab, damage them, and then add an extract from sea anemones. It's an extract that had been shown to repair damaged hair cells in the sea anemones. The following figure shows some results...
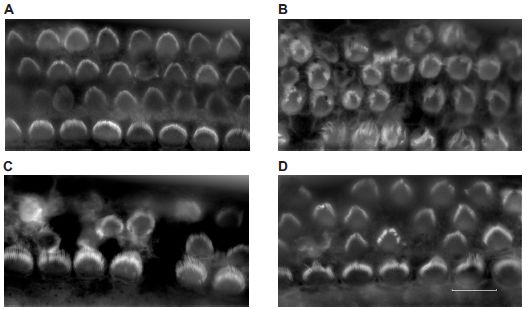
The main feature seen in the photos is the bundle of hairs on a cell surface. The integrity of the bundle is important for hair cell function.
A brief overview... Two of these frames (A & D) show cells that look healthy, and two (B & C) show cells that look damaged. The two healthy sets of cells are the controls (A) and the cells that have been damaged and then repaired by the sea anemone proteins (D).
(If you don't want to accept D as "healthy", will you at least accept that the cells in D look better than those in B or C?)
To be more thorough, here is a brief description of each frame...
A. Controls. Normal cells.
B. Cells that have been damaged (by a lab treatment).
C. Similar to B, after 1 hour.
D. Similar to C, but the hour included treatment with the sea anemone proteins.
That is, the key comparison is between C & D. In both cases, the cells have been damaged and then incubated for an hour. In D, they have been treated with the sea anemone proteins. The cells in D look healthier than those in C. (They are not as good as those in A. The repair is not complete.)
This is Figure 2 from the article. The four frames above are "representative" images. They do not show the same cells over time.
|
It seems clear that the sea anemone extract has improved the health of the damaged mouse hair cells.
The article also includes a test of one biochemical function of the cells. The results are in agreement with what is above.
What is the significance? Well, it's an early step in the project. The test situation here is artificial: lab cultures, a lab-induced damage, a crude treatment, and a superficial observation. There is nothing here about restoring hearing in an animal. But it is a step.
The scientists do proceed on one front, which also turns out to be intriguing. They know something about these sea anemone proteins. And they look in the genome databases for sea anemone and mouse... Turns out that the mouse genome codes for similar proteins. That's about it for now. Are these mouse proteins potentially functional, and just turned off? If not functional for hair cell repair, what do they do, and what might they do if we could "fix" them?
Are we moving toward treating hearing loss by injecting people with sea anemone extracts? I doubt it. But it might be fruitful to study repair of damage to hair cells in sea anemones, and to learn more about the related mammalian proteins.
News story: Sea anemone proteins could repair damaged hearing. (Phys.org, August 3, 2016.)
The article: Repair of traumatized mammalian hair cells via sea anemone repair proteins. (P-C Tang et al, Journal of Experimental Biology 219:2265, August 1, 2016.)
More about hair cells and hearing loss: Designing a less toxic form of an antibiotic (April 19, 2015).
Sea anemones are cnidarians, the same phylum as the jellyfish and corals. The possible use of sound by corals was noted in the post Are the corals listening to the shrimp? (July 16, 2010).
More about the nervous system of cnidarians: When do jellyfish sleep? (September 29, 2017).
More about sea anemones:
* Can a sea anemone make you smile? (June 21, 2021).
* The function of Hox genes in cnidarians (November 16, 2018).
Need a new bone? Just print it out
November 13, 2016
Replacing bones is an important and difficult issue. Bones do re-build, but it is a slow process. It helps to provide a scaffold for replacement bone to grow into, and it is good if that scaffold is strong enough to be useful on its own.
A new article reports a new bone material that has multiple advantages. It serves as a good scaffold and is itself strong. And it is simple and easy to make -- by 3D printing. It consists of two main ingredients. One is a mineral material, called hydroxyapatite, which is very similar to what is in natural bone. The other is a polymer, which provides flexibility. In fact, it can be folded, or otherwise adjusted as need during surgery to fit.
The material is called hyperelastic bone (HB).
The following figure shows one test on HB. A sample was printed as an example of a useful piece of bone suitable for implantation. The figure shows what happens when it is subjected to a compression test.
A stress test of a piece of the new bone material.
Look at the images from left to right... The bone is compressed so that it is about 25% less high. Upon removal of the stress, it returns to its original height.
The porosity that you can see in the end view is a key feature of the material. The pores are infiltrated by cells for making bone and blood vessels. Thus the material increasingly becomes normal bone over time.
The piece of bone here is a short length of HB that might be used to replace part of a human femur. It is about 3 centimeters high, as shown here in this end view. It is about 4 cm long (front to back, in these photos).
This is Figure 3H from the article.
|
That's impressive, but it is also rather qualitative. After testing many properties of the new bone material, the authors summarize that it is similar to natural bone and better than most artificial materials currently considered.
The appeal of the material is more than its strength. Importantly, it is easy to make -- customized for the application. As one example, the authors start with a jaw bone, and make a duplicate using the new material. What do they do? Scan the original and use that information to print a duplicate.
What happens when such a bone is implanted? The body uses it as a scaffold, and finishes development of a "normal" bone. The implanted structure is not the final bone, but it supports development of the final bone -- and is quite functional in the interim. There is no evidence from testing so far of any adverse response.
That the new bone material is based on hydroxyapatite, so similar to natural bone, is important in its success. But hydroxyapatite itself is brittle. Addition of the polymers provides flexibility. The scientists use polymers already considered acceptable for medical use. Working out how to combine the materials to achieve the multiple goals was the key part of the work.
In one animal test, the scientists printed a piece of HB to replace a missing piece in the skull of a monkey. The surgical junction healed over a few weeks, with signs that new bone was growing into the scaffold. The monkey is fine. The scientists see human trials with the material within a few years. It is not clear what further information they need before going to humans. Of course, there is little information on long term results at this point.
News stories:
* Synthetic 3D-printed material helps bones regrow. (Medical Xpress, September 28, 2016.)
* Synthetic 3D-printed 'hyperelastic bone' induces bone regeneration, could mend broken bones. (3Ders.org, September 29, 2016. Now archived.)
The article: Hyperelastic "bone": A highly versatile, growth factor-free, osteoregenerative, scalable, and surgically friendly biomaterial. (A E Jakus et al, Science Translational Medicine 8:358ra127, September 28, 2016.)
A recent post on 3D printing of material for human implantation: 3D printing of human tissues: the ITOP (May 24, 2016). Links to more. The current post is logically similar in some ways, but the current implant material is more likely to be retained in the final structure.
Next... 3D printing: Make yourself a model of the universe (December 19, 2016).
More on bones...
* Using eggshells to make a material for bone grafts (June 6, 2023).
* Skull surgery: Inca-style (August 21, 2018).
* Stabilizing broken bones: could we use spider silk instead of metal plates? (June 24, 2018).
* A test of a stem cell therapy based on iPSC, in monkeys (August 29, 2014). This earlier post focuses on the cell part of bone formation. The current post focuses on the scaffold part, and relies on endogenous cells.
More about replacement body parts is on my page of Biotechnology in the News (BITN) for Cloning and stem cells. It includes an extensive list of related Musings posts.
Another femur... A tiny titan (May 9, 2016).
A story of dirty toes: Why invading geckos are confined to a single building on Giraglia Island
November 12, 2016
There are two kinds of geckos on the tiny island of Giraglia, near Corsica. The native species has the run of the island. Another species, which was recently introduced to the island, is confined to one building. A concrete building, to be specific -- and relevant.
What's the problem with these invaders? Why don't they get around more?
A new article explores these questions. The answer? Their toes are dirty.
Geckos are fascinating creatures, in part because of their toes. Geckos can climb shear walls. That is because their toe structures -- specifically, the adhesive pads of their toes -- have a huge surface area, which allows good contact with anything, even if smooth and featureless. The nature of the contact is what chemists call London dispersion forces, which operate between any materials. These forces are fundamentally rather weak, but with a large surface they add up and can be significant. The gecko exploits them -- and has inspired development of gecko mimics.
But that ability to stick to anything can be a liability, as the case of the invading geckos on Giraglia Island attests. Giraglia is a dusty place. The ground there is a mineral called prasinite, which breaks down readily producing lots of dust. The dust gets on the gecko toes, and that's it. They can't even get good traction on level ground. They end up being restricted to the one place on the island that is not dusty, that concrete building.
Why, then, does the native gecko get around just fine on this dusty island? They have a different kind of toe structure. Look...
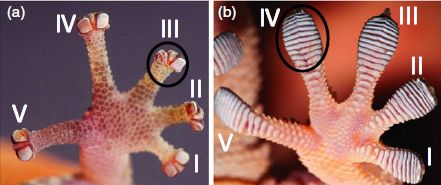
|
Frame a (left) shows the toe structure of the gecko species that is native to Giraglia Island, Euleptes europaea.
Frame b (right) shows the toe structure of the non-native gecko species there, Tarentola mauritanica.
|
You can see that the toe structures are quite different for the two types of gecko. What is important is where the adhesive pads are.
For the invading species, T mauritanica (right), the adhesive pads are those stripes you see along the toes. Essentially the entire toe is adhesive.
For the native species, E europaea (left), the adhesive pads are the two little structures on each side near the tip. Importantly, this gecko can fold those terminal pads out of the way when they are not useful. By doing this, the toe structure effectively becomes more like a claw, and the animal can move on dusty surfaces.
This is the top row of Figure 1 from the article.
|
Scientists have long known of these two patterns of adhesive structures on gecko toes. They have speculated on the functional significance, but there was little good evidence. The current work looks at a case where geckos with the two types of toes live in the same environment; the advantages of the configuration with smaller -- and more flexible -- adhesive pads becomes clear.
You might wonder... If the adhesive pads on the toes are so sticky, don't they inevitably become dirty and ineffective? Apparently, they are self-cleaning. The cleaning occurs when the animals are on clean surfaces. The problem with the invasive species on Giraglia is that there is insufficient clean surface -- unless they stay very near that one concrete building.
It's a story that is both amusing and biologically interesting.
News story: Invading giant geckos get stuck on a single building. (New Scientist, October 27, 2016.)
The article: Left in the dust: differential effectiveness of the two alternative adhesive pad configurations in geckos (Reptilia: Gekkota). (A P Russell & M-J Delaugerre, Journal of Zoology 301:61, January 2017.)
There are no Musings posts focusing on geckos. However, the article discussed in the following post includes similar work with geckos, and it is noted in the post: Acrobatic cockroaches inspire robot design (September 16, 2012).
A recent post about a lizard: Facultative endothermy: a lizard that is warm-blooded in October (February 1, 2016).
More about lizard toes: The effect of hurricanes on lizards (August 14, 2018).
Another animal story from the Mediterranean islands: Fossil discovered: A big stupid rabbit (April 22, 2011).
Another story of an invasive organism... How an American weed might interfere with control of malaria in Africa (November 13, 2015).
and more... What if a fishing dock fell into the ocean off the east coast of Japan? (October 29, 2017).
November 9, 2016
Progress toward an ultra-high density hard drive
November 9, 2016
Scientists at Delft University of Technology report progress toward a hard drive with 500 times the storage density of current commercial drives. It offers the possibility of being able to store all of mankind's books on a disk the size of a postage stamp.
We'll start with some data on the drive; then we'll go back and look at how it is done.
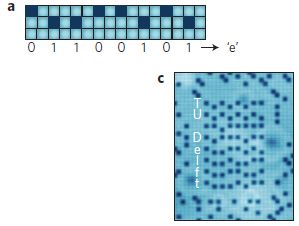
|
Frame a (upper) is a diagram showing how the letter e is coded.
Frame c (lower) shows an image of an actual recorded disk. The central block has had a text message written to it. It is 8 bytes, or 64 bits. Using ASCII coding, as shown in frame a, it carries an 8 character -- self-serving -- text message.
This is part of Figure 2 from the article.
|
The following figure shows how the data is encoded...
This figure shows a background structure of a sheet of copper atoms. On top of the Cu sheet are chlorine atoms (blue). Each Cl atom sits in the depression between four Cu atoms. In the middle, one Cl atom is missing. That is a Cl vacancy -- and is the secret to the coding. The pattern of Cl vacancies is the coding.
This is part of Figure 1 from the article.
|
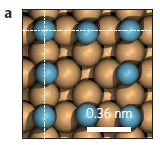
|
Those Cl vacancies are the key. In the top figure, the dark spots represent Cl vacancies. The coding is that a vacancy (V) above a Cl atom is a bit meaning 0. That bit pattern is referred to as V-Cl, Cl-V means 1. (And extra space is needed, to avoid having two vacancies together.) You should now be able to follow frame a in the top figure -- and frame c if you want to look up the ASCII codes. Just remember, the vacancy is the dark spot, perhaps the opposite of intuition.
The pattern of vacancies is both written and read by a scanning tunneling microscope (STM). Writing the data involves moving the Cl atoms around on the Cu surface. As preparation, the scientists deposit an incomplete layer of Cl atoms on the Cu surface; that is, they make a Cu sheet that includes both Cl atoms and vacancies, and then reposition the atoms as the data requires. That works better than trying to remove Cl atoms from the Cu. (The image in part c above is an STM image.)
There are limitations to this type of drive at this point. The biggest drive the scientists have made so far holds a kilobyte of data, takes 10 minutes to write, and needs to be kept in the freezer -- 77 K (liquid nitrogen). Still, it's an interesting technical development.
News stories. Both of these include a picture of the entire 1 kB drive, with data...
* Smallest hard disk to date writes information atom by atom. (Phys.org, July 18, 2016.)
* Chlorine vacancies make atomic memory. (Nanotechweb (IOP), July 25, 2016. Now archived.)
* News story accompanying the article: Scanning probe microscopy: A picture worth a thousand bytes. (S C Erwin, Nature Nanotechnology 11:919, November 2016.)
* The article: A kilobyte rewritable atomic memory. (F E Kalff et al, Nature Nanotechnology 11:926, November 2016.)
More about data storage...
* Information storage: One atom, one bit (May 15, 2017).
* Long-term data storage in glass (August 14, 2013).
* Using DNA for data storage (March 5, 2013).
Hard drives were also mentioned in the post: Penidiella and dysprosium (September 11, 2015).
The use of the STM for positioning single atoms dates back to Don Eigler's famous doodling, noted in the post The 35 most famous xenon atoms (June 29, 2010). Although both projects involve using the STM tip to move atoms, an important feature of the current work is that the surface layer is mostly Cl atoms. That high density of atoms helps to maintain the structure. The "occasional" individual vacancies are the distinctive features.
For more on STM and related techniques, see a section of my page of Internet Resources for Introductory Chemistry: Atomic force microscopy and electron microscopy (AFM, EM).
Another use of atomic vacancies: The smallest radio receiver (April 4, 2017).
Why growing sunflowers face the east each morning
November 8, 2016
Have you ever noticed... a field of sunflowers all facing east? (There is a good picture in the news story listed below.)
There is more. Young growing sunflower plants track the sun, with their stems facing east in the morning, west by day's end.
How does it happen? And why? A recent article explores some of this.
First, let's document the phenomenon...
|
The graph shows the angle of the apex (tip) of the growing stem vs time for two groups of sunflower plants.
90° is vertical. Angles less than that mean that the stem faces east (toward the morning sun); angles greater than 90° mean that the stem faces west (toward the evening sun).
|
One group of stems was measured near the autumn equinox. There was 12 h of light and 12 h of dark. That is labeled 12L:12D (blue circles). The other group of stems was measured in mid-summer, with 16 h light, 8 h dark (16L:8D; red squares).
The curves start at the beginning of a light period. Stem angles are low (east-facing) early. They then rise; they peak near the end of the light period, and the stems are then west-facing. During the dark period, the stem angles decrease to the earlier value -- ready for another morning.
Caution... If you look at the angle numbers on the y-axes, they are confusing. Turns out that the 12L:12D curve (blue) uses the y-axis scale on the left; the 16L:8D curve (red) uses the y-axis scale on the right. That makes sense; you can now see that both curves start below 90°. There is nothing on the original graph to make the axis usage clear; I have added a note on the right side.
This is part of Figure 1 from the article, slightly modified. I added a label to the y-axis scale on the right, as noted above.
|
That figure shows that the stems of growing sunflower plants change their angle during the day and night.
Further work helped to establish two important features of the system...
1) It behaves like a circadian rhythm. Curvature is not directly controlled by light. Instead, there is an internal clock that has been set by recent experience with light-dark cycles. For example, the angle pattern continues even when the plants are moved to an artificial environment with an altered light-dark cycle. (It continues for a few days, then adapts to the new condition. It's something like jet lag in sunflowers.)
2) The changes in curvature are due to growth patterns. Existing stems do not "bend"; instead, they grow more on one side or the other. They grow more on one side during the day, more on the other side during the night. Only sunflower plants that are actively growing track the Sun; if they are mature (not-growing), they no longer track the Sun.
Why does it matter? Experiments reported in the article show that plants that track the Sun as above grow better than those whose orientation is disrupted.
There is another part to this story. When the plants mature and develop flowers, they all face east. And that leads to another experiment...
In frame E (left), the temperature of three groups of sunflowers was measured over time during the morning.
In one group, the flowers faced east (E); that is normal. In a second group, the flowers had been rotated so that they faced west (W). In a third group, the flowers also faced west, but they were heated.
The graph shows that two of the groups of flowers warmed more than the third group. The two groups of warm flowers were those facing east, and those facing west but heated. The flowers facing west, but without heat, were significantly cooler.
|
|
Is it interesting that the two warm groups are very similar? Not really. The scientists adjusted the heating to get the west-facing flowers to be similar to the east-facing ones. This frame just lays the groundwork for the next part.
Now look at frame F (right). It shows the number of visits of pollinators to the various groups of flowers. The first two bars show that east-facing flowers get far more pollinators than west-facing flowers. Heating the west-facing flowers (W + heat) leads to a big increase in pollinator visits. That is, warm flowers get more pollinators than cool flowers.
By facing the morning Sun, the plants have warmer flowers, thus attracting more pollinators.
(However, warmed west-facing flowers don't get as many visits as the naturally warm east-facing flowers. It is another hint that there must be more to the story.)
This is part of Figure 3 from the article.
|
People have long noted that sunflowers face east, and that growing sunflower plants track the Sun. We are now learning some of the story behind how and why this all happens.
News story: Sunflowers move by the clock. (Phys.org, August 4, 2016.) Good overview.
* News story accompanying the article: Plant science: How do sunflowers follow the Sun -- and to what end? (W R Briggs, Science 353:541, August 5, 2016.)
* The article: Circadian regulation of sunflower heliotropism, floral orientation, and pollinator visits. (H S Atamian et al, Science 353:587, August 5, 2016.) It's very dense and not easy reading, but it's a nice story.
A recent post related to circadian rhythms: The genetics of being a "morning person"? (April 15, 2016).
More about plants anticipating light... Can a plant learn to associate a cue and a reward? (March 3, 2017).
More about sunflowers: Briefly noted... What color are sunflowers, and why? (July 6, 2022).
There are many posts about flowers. Among them...
* What if there weren't enough bees to pollinate the crops? (March 27, 2017).
* Did the earliest dinosaurs like flowers? (October 14, 2013).
* Better enzymes through nanoflowers (July 7, 2012).
Nanotechnology leads to the development of a superoleophobic polypropylene -- and a better shampoo bottle
November 6, 2016
How do you empty a shampoo bottle? Well, you just turn it upside down, and pour out the contents. Except that it doesn't work very well. Shampoo doesn't flow very well out of the bottle, because it sticks to the bottle surface.
A recent article reports the development of a plastic bottle surface to which shampoo doesn't stick. Look...
In these tests, shampoo is poured onto the little raised piece of plastic.
Two kinds of plastic are tested. In the upper row, it is ordinary, "untreated", polypropylene. In the lower row, it is the new treated plastic.
In each row, the three photos show three time points. The general observation is that the shampoo flows better off the treated plastic. Don't worry much about the details at this point.
For a better view of the test, go look at a short video... Soap That Slides Off the Bottle. (YouTube; 1 minute; no sound, but well labeled.) Includes several tests.
This is Figure 6 from the article.
|
What's this about? It's about wettability. We most often think about wettability in terms of water. It sticks to some things, and repels others. We call those things hydrophilic and hydrophobic, respectively. It's the same general idea with the shampoo, except that we're dealing with hydrophobic detergents sticking to the hydrophobic plastic.
The scientists modify the plastic surface so that the detergents don't stick. The surface is now oleophobic, where "oleo" refers to the fatty (or hydrophobic) nature of the detergents. They even use the term superoleophobic.
How do they make an oleophobic surface? It involves treating the plastic surface to effectively create a coating with a combination of physical and chemical features. The physical features, using nanoparticles, reduce the contact between detergent and plastic, and the chemical features make it as "unattractive" as possible. The scientists think their way of doing this is simple and economical, and may be practical. They also note limitations of the work so far, and that further work will be needed.
What's the goal? In fact, the goal really is to make better bottles for shampoos, and other soapy products. It's a huge market. The work is also part of our expanding understanding of how to manipulate the properties of surfaces. It might even have implications for medical devices.
News story: A shampoo bottle that empties completely - every last drop (w/video). (Nanowerk News, June 27, 2016.) The title is a little over-stated. Includes the video.
The article: Durable superoleophobic polypropylene surfaces. (P S Brown & B Bhushan, Philosophical Transactions of the Royal Society A 374:20160193, August 6, 2016.)
More about shampoo: Close-up view of an unwashed human (July 29, 2015).
More about wettability:
* An antiviral coating for medical textiles (July 12, 2020).
* Electronic devices that can work under water (November 7, 2011). The principle of the new work is very much like that of this earlier work.
A broad view of plastics: History of plastic -- by the numbers (October 23, 2017).
How the tomato plant resists the Cuscuta
November 4, 2016
Look at the two tomato plants in frame A of the figure below. In both cases, there is something wound around the stem of the plant. It's labeled, Cuscuta reflexa.
In one case, to the right, the Cuscuta is healthy. In the other, to the left, the Cuscuta is shriveled up. (Don't worry about the color of the tomato stem.)
What's this about? Cuscuta is a genus of parasitic plants. They have no roots, at least in the usual sense. They wrap themselves around other plants, and attach themselves to their host. They then extract nutrients from the host. The plant at the right is Solanum pennellii, a wild tomato species. It is susceptible to Cuscuta. The plant on the left is S lycopersicum, the common cultivated tomato. It is resistant to Cuscuta. (Cuscuta is sometimes known as dodder. It is of economic significance in some cases.)
A new article addresses how the common tomato plant resists the parasitic Cuscuta.
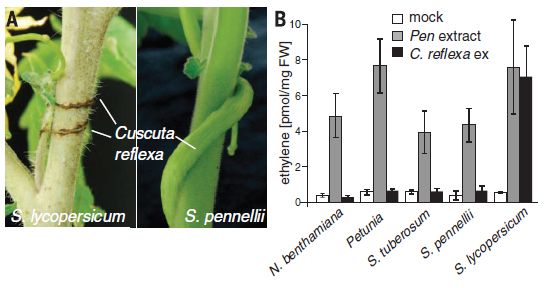
Frame B, to the right above, shows one line of evidence.
In this experiment, extracts from several plants were tested for their response to extracts from Cuscuta. The scientists measured the amount of ethylene gas made. In this context, ethylene is part of the defensive response of the plant.
The plants tested for their response are shown at the bottom. They are, from the left: tobacco, petunia, potato -- and then the wild and cultivated tomatoes we saw in frame A.
Three kinds of signal were tested. One was the Cuscuta extract of interest. One was an extract from Penicillium fungus, and one was a blank, or "mock" infection.
Look at the dark bars, for the Cuscuta extract. Only the bar for S lycopersicum shows any significant response. That is, only the cultivated tomato, the one plant resistant to the infection, shows the ethylene response.
All the bars for the mock infection were low, a negative control. All the bars for the Penicillium infection were high, a positive control showing that all the plants were capable of responding to a challenge by making ethylene.
The amount of ethylene made is shown on the y-axis scale as amount of ethylene made per amount of plant tissue tested. More specifically, it is picomoles of ethylene per milligram of fresh-weight (FW) of plant.
This is part of Figure 1 from the article.
|
That's the idea of Cuscuta, and establishes that one particular plant has a successful defensive response. The scientists go on to explore the mechanism of the resistance. Genetic crosses between the sensitive and resistant tomato species led to the identification of a gene for resistance. It codes for a receptor in the cell wall that recognizes a small molecule, probably a modified peptide, from the Cuscuta. That seems to be the signaling event that starts the tomato response. It's a familiar type of pathogen signaling, but this is the first time it is has been found to act against a plant.
Transfer of the gene for the receptor to other plants increased their resistance to Cuscuta. It may be interesting to extend this to host plants of agricultural importance. We also note that this receptor system is only one part of the tomato response.
What the tomato and Cuscuta do is a type of pathogen signaling used by animals, including us. We call that system the innate immune system.
News stories:
* Researchers uncover the mechanism that triggers host plant resistance against parasitic plants. (J Eberhardt, Phys.org, July 29, 2016.)
* Tomatoes to the rescue! (C Smith, Naked Scientists, August 2, 2016.) An interview with the senior author; also available as an audio file.
* News story accompanying the article: Plant biology: Parasitic plants -- A CuRe for what ails thee. (V Ntoukakis & S Gimenez-Ibanez, Science 353:442, July 29, 2016.) CuRe? That's the name given to the gene for "Cuscata receptor".
* The article: Detection of the plant parasite Cuscuta reflexa by a tomato cell surface receptor. (V Hegenauer et al, Science 353:478, July 29, 2016.)
More Cuscuta: Inter-plant communication via the Cuscuta parasite (September 15, 2017).
Other posts about plant defenses include...
* How rice recognizes a Xoo infection (August 28, 2015). This case is similar to the current one, except that the pathogen is a microbe.
* Underground messaging between bean plants (July 29, 2013).
A post on the innate immune system in mammals: Why mice don't get typhoid fever (November 26, 2012). The post notes that the findings reported there have turned out to be controversial. The post links to more on the innate immune system, and the key receptor proteins called toll-like receptors (TLR).
... and in simple animals: The immune response of cnidarians (e.g., corals) (November 1, 2021).
More about tomatoes: The chemistry of a tasty tomato (June 18, 2012).
A post that might seem to be -- but isn't -- about a parasitic plant: A "flower" that bites -- and eats -- its pollinator (December 27, 2013).
November 2, 2016
Gravitational waves: What caused them, and how do we know?
November 1, 2016
We noted the recent observation of gravitational waves [link at the end], a historic achievement. But what caused those waves? It was in the original work, but beyond what we could discuss in one post. Those first gravitational waves to be observed were caused by a collision of two black holes. One had a mass of 29 solar masses while the other had a mass of 36 solar masses. The event occurred 1.3 billion years ago, and the observed waves were released a few seconds before final collision.
Impressed? How could we possibly know all that? Well, it was too complex to explain then, and it is too complex to explain now. The short answer is that it was all worked out by computer simulations.
The development of computer simulations of black hole collisions is itself a big story, one that is almost incomprehensible -- but interesting.
The Caltech alumni magazine recently ran a story about the observation of gravitational waves, and it focused on the work to develop those simulations. It's quite readable; I encourage you to give it a try if you'd like a little more about those waves.
The story: "The Universe Has Spoken". (K Fesenmaier, E&S (Engineering & Science), Summer 2016, p 12.) From the alumni magazine at one of the lead institutions involved in LIGO and in the simulations. Some of it does read like a promotional piece, but overall it's good.
Background post: Gravitational waves (February 16, 2016). Links to more.
More gravity... What if there isn't any dark matter? Is MOND an alternative? (December 12, 2016).
Musical dissonance: is it innate?
October 31, 2016
We have an intriguing scientific article about the nature of music. It's not entirely clear what it means, so we'll emphasize the experimental approach.
If we hear two notes played together, we may distinguish two cases: a pleasant pairing, called consonance, and an unpleasant pairing, called dissonance. There are general patterns that describe which pairs are consonant and which are dissonant; we'll skip the rather arcane music terminology used to describe them.
The question is whether such a distinction is innate or learned. There is some reason to suggest that the distinction might be innate, but attempts to address the question by observation or experiment have not been conclusive.
The current article offers an interesting test.
The heart of the work is testing a group of people from a remote tribe that has had minimal contact with western music. Careful controlled tests on how they perceive sounds are done with these people, along with control groups.
Here is an example...
|
The basic experimental design is that each test subject heard a pair of tones played together. The two notes were, by common standards, consonant or dissonant. The listener was asked to rate the sound on a 4-point scale from like to dislike. Five groups of people were tested.
In the test for frame a, the sounds were synthetic, but similar to piano tones.
Look at the first pair of bars in frame a. The like-score for consonant pairs of notes (the blue bar to the left) was just above the third tic mark. The like-score for dissonant pairs of notes (red bar) was just below the second tic mark. The error bars for both sets are very small, and the difference tests as statistically significant. That result is what one would expect.
|
If you look at the five sets of results in frame a, for five groups of people, the same general pattern holds for the first four. However, the fifth group (at the right), shows no significant difference in like-score for consonant and dissonant pairs of notes.
Frame b shows a similar test, this time using pairs of notes from the human voice. The pattern is basically the same. In particular, that same fifth group gives the same score to consonant and dissonant pairs of tones.
Frame d shows a control test. The sounds tested here are recordings of humans laughing or gasping. All five groups distinguished these two sounds about the same way. This control shows that the failure to distinguish consonant and dissonant pairs of notes in the previous frames is specific for that feature.
Frame d also identifies the five groups, at the bottom. From the left... The first two groups are from the US: musicians (M) and non-musicians (NM). The next three groups are from Bolivia: from the capital city, a small town, and a remote village of the Tsimane' tribe. (The apostrophe? It's part of the name, at least as presented in the article.)
This is part of Figure 2 from the article.
|
Taken at face value, the results shown above suggest that the remote tribe does not distinguish consonant and dissonant note pairs the way the others do.
The article includes many more tests, which reinforce that point and help to refine what it means.
This shows that making the distinction between consonance and dissonance is not universal. By extension, it is apparently not innate. The simple suggestion is that the Tsimane' do not make this distinction because they have not learned to do so, having little exposure to western music.
Looking further leads to questions and reservations about the interpretation. For example, it turns out that the Tsimane' rarely play two notes together -- even when encouraged to do so by the scientists. That is, it may not just be that they react differently to pairings, but that the whole idea of judging pairs is new to them.
Nevertheless, the experimental approach is interesting, and seems worth pursuing. The question may be more nuanced than consonance vs dissonance; such experiments may be a way to explore how various people react to various sounds. Testing people from different cultural backgrounds would be one good part of that. Sadly, as the authors note, there are few groups of people left who lack any exposure to "western" music.
News stories:
* Another one bites the dust? (H Honing, Music Matters -- A blog on music cognition, July 13, 2016.)
* Why we like the music we do -- Musical tastes are cultural in origin, not hardwired in the brain, study suggests. (Science Daily, July 13, 2016.)
* News story accompanying the article: Human perception: Amazon music. (R Zatorre, Nature 535:496, July 28, 2016.)
* The article: Indifference to dissonance in native Amazonians reveals cultural variation in music perception. (J H McDermott et al, Nature 535:547, July 28, 2016.)
A recent post about music: Death by bagpipe (September 13, 2016).
There is more about music on my page Internet resources: Miscellaneous in the section Art & Music. It includes a list of related Musings posts.
An organoid for the gut: at last, a culture system for norovirus
October 30, 2016
This post is about two topics that have been discussed before. One is the emerging ability to modify cell fate in the lab. One result of this is the ability to make "organoids" -- small amounts of tissue of a particular type -- that can be studied in the lab. The other is norovirus, a major cause of food poisoning. Background posts on both topics are at the end.
A new article reports the use of gut organoids to support the growth of norovirus. This is important because there has been no reliable way to grow norovirus in the lab.
The following figure illustrates the system. It is about a test to find the optimal level of bile in the culture medium.
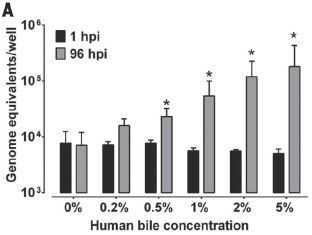
|
The graph shows virus production over 4 days as a function of the amount of bile added to the culture medium.
The x-axis shows the bile concentration.
The y-axis shows virus production, as "genome equivalents". That is, they measure viral RNA, and calculate it in terms of how many viruses that represents. It is a log scale.
|
For each bile concentration there are two bars. Look at the lighter (right-hand) bar. This shows the virus present at 4 days (= 96 hpi; hpi = hours post infection).
The general trend is clear: the amount of virus made over 4 days increases as the bile concentration increases.
The dark (left-hand) bars? They show the virus levels at 1 hpi. They are all similar. If there is some downward trend, it may be an effect of the bile on the viruses or on the measurement. It is not important for now.
This is Figure 2A from the article.
|
How did the scientists make these virus-susceptible tissues? As with previous organoid work, it's logically simple but with a lot of technical details that need to be worked out. It builds on the story of induced pluripotent stem cells (iPSC), in which regular cells are dedifferentiated in the lab. These cells, or sometimes even cells that have not been dedifferentiated, can then be treated with factors that direct them to form cells of the desired type. In this case, the scientists used a system that had been recently reported, based on stem cells isolated from various parts of the human intestinal system. The stem cells were induced to form organoids, or "enteroids", similar to the intestinal lining.
The previous examples of organoids discussed in Musings involved brain tissues. The current article is about a different organ, and shows that something useful has been achieved: a culture system that allows study of norovirus growth in the lab. The experiment shown above is a part of characterizing the system. It's not of much importance on its own; I chose it as an example. What's important here is the ability to grow a serious pathogen in the lab. This should lead to improved understanding of norovirus.
News stories:
* Norovirus culture system uncovered. (C Smith, Naked Scientists, August 25, 2016.)
* Baylor Scientists Grow Noroviruses In Lab For First Time. (MedicalResearch.com, August 29, 2016.) An interview with the senior author.
The article: Replication of human noroviruses in stem cell-derived human enteroids. (K Ettayebi et al, Science 353:1387, September 23, 2016.)
Other posts on organoids...
* Human heart organoids show ability to regenerate (May 2, 2017).
* How much would it cost to make a brain? (November 1, 2015).
* Autism in a dish? (September 4, 2015).
* Artificial brain-like structures grown from human stem cells in the lab (October 1, 2013).
Other posts on norovirus:
* Using a plasma to kill norovirus (June 5, 2015).
* Possible transmission of norovirus via reusable grocery bag (May 21, 2012).
Also see my Biotechnology in the News (BITN) page for Cloning and stem cells. It includes an extensive list of Musings posts in the field.
The post Killer chickens (December 2, 2009) links to a wide range of posts about food poisoning.
The history of brewing yeasts
October 28, 2016
We hear a lot about domestication of food plants and animals, and even pets. But what about microbes?
What microbes has mankind put to use over the long term, perhaps developing strains with special features more suited to what we want? Well, we use various fungi to make fermented products. A recent Musings post was about a fungus domesticated for cheesemaking [link at the end].
We now have a new article exploring the history of brewing yeasts, both those used for beer and for wine. It's an interesting story.
The approach was genomics. The scientists sequenced the genomes of 157 strains of Saccharomyces cerevisiae, encompassing a range of brewing yeasts. As usual, the genetic analysis is buried in complex figures and computer analyses. Let's just look at the picture that emerged.
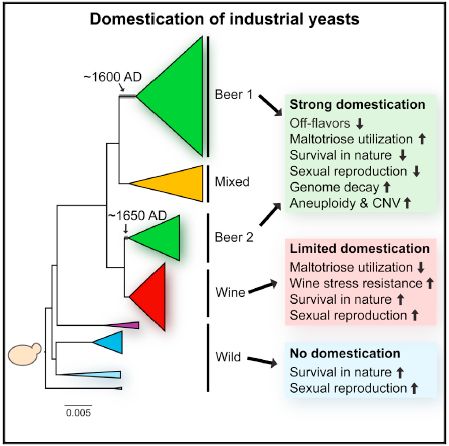
|
The figure shows the genealogy that was inferred from the genomic analysis.
The big picture is summarized in the labeling at the right. The scientists distinguish a few major groups of yeasts.
Some features are listed. An up-arrow by a feature means that the trait is enhanced in the strains of that group.
This is the Graphical Abstract from the article.
|
At the bottom of the figure are wild yeasts. They have traits suited for survival in nature. And they have sexual reproduction.
Above that are two main groups, showing limited domestication and strong domestication. These strains have gained traits useful for our purposes, such as maltotriose utilization and wine stress resistance. (Maltotriose? That's a trimer of glucose, connected the same way as the maltose dimer.) These strains also show traits often found in domesticated organisms, such as decay of the genome and loss of sexual reproduction.
Interestingly, wine yeasts are generally only weakly domesticated, whereas beer yeasts are more highly domesticated. The authors discuss this distinction, in terms of how the two types of fermentations are done. Wine fermentations use yeasts from the grapes each season. In contrast, beer making has long been more of an industrial process, using lab cultures -- even if we didn't know what they were.
That leads to another interesting point. Look at the dates shown on the genealogy chart above. The domesticated yeasts split off from the wild yeasts in the 17th century. (That is estimated from the amount of genomic differences, and a rough understanding of how fast such differences accumulate.) Domestication of yeasts began before we knew about them as organisms. That's fine. People used samples from previous fermentations to start new ones. These "starter cultures" contained the yeasts, whether we knew about them or not. We were domesticating yeasts even before we knew they existed.
News story: The history of beer yeast. (Science Daily, September 8, 2016.)
The article, which is freely available: Domestication and Divergence of Saccharomyces cerevisiae Beer Yeasts. (B Gallone et al, Cell 166:1397, September 8, 2016.)
Other posts about domestication include...
* How horses learned to walk (September 21, 2016).
* Cheese-making and horizontal gene transfer in domesticated fungi (January 19, 2016). Another fungus.
Another yeast fermentation... Better chocolate? Use better yeast? (May 3, 2016).
More about yeasts... What if yeast had only one chromosome? (August 26, 2018).
Posts about wine include...
* Improved ostracon analysis reveals 2600-year-old request for wine (July 23, 2017).
* Some shrimp in your wine? (August 27, 2016).
More beer... Climate change and the price of beer (November 26, 2018).
An intriguing post about a possible ancient fermentation: Antibiotics in ancient times (January 10, 2011).
There is more about genomes and sequencing on my page Biotechnology in the News (BITN) - DNA and the genome. It includes an extensive list of related Musings posts.
October 26, 2016
How easy is it to destroy any traces of 43 students by burning them?
October 25, 2016
Not easy, according to a scientist who is expert in fire -- and who did a test.
This post is about a recent news event -- one that raised the question, and has not been resolved. We'll focus here on the science part; the news stories below include the context.
The work has not yet been formally published, though that is planned. The news reports seem good, and we note the story briefly.
Overview... 43 students disappeared (September 2014). No trace of them has been found. One claim is that they were burned, a claim that was -- perhaps -- intended to put the whole story to rest. The fire-expert scientist first claimed, from calculations, that such a complete burning was not possible (under relevant conditions). Some questioned that claim, so he set out to test it -- which he did.
The story is both chilling and fascinating, and now we have interesting science playing an important role.
News stories:
* Arson Investigation Discredits Official Story of Mexico's 43 Missing Students. (S Augenstein, Forensic Magazine, September 15, 2016. Now archived.)
* 'Burning bodies' experiment casts doubt on fate of missing Mexican students. (Borderland Beat, September 15, 2016. Now archived.) This is a copy of a news story, by L Wade, for Science magazine. It credits and links to the original, and to a translation into Spanish.
More about the science of combustion: A candle for Christmas (December 20, 2010).
Other posts on forensic applications of science...
* Can one tell if a fingerprint is from a male or a female? (December 4, 2015).
* Atomic bombs and elephant poaching (October 25, 2013).
How do you get silkworms to make stronger silk, reinforced with graphene?
October 24, 2016
No problem. Just feed the silkworms some graphene, and they will incorporate it into the silk they make.
As background, it is known that treatment of silk to incorporate various kinds of strong carbon materials can lead to a stronger silk.
The advance in a new article is to show that such C-enhanced silk can be made in vivo by the silkworms. The procedure: spray a solution containing the C-material onto the mulberry leaves that is the silkworms' primary food. In this work, the scientists use both graphene (GR) and single-walled carbon nanotubes (SWNT).
The following table shows the results of testing the strength of the various silk materials.
The first line shows the results for the control silk. The silk breaks at a stress of 0.36 GPa, after stretching by 9%. (We will use those numbers for comparison. Don't worry about the specific values.)
The second line is for silk with SWNT. You can see that it took a greater stress to break that silk. Further, it stretched more before breaking. That is, a strength test shows that this SWNT silk is stronger than the control silk.
The fourth line (GR1-S) also shows a silk that is stronger than the control. This is a silk made with graphene added.
This is part of Table 1 from the article.
|
In summary, two of the four silks shown in the table with added C-materials are stronger than the control silk.
Now, you might notice that the other two silks made with added C-materials are less strong than the control silk. What gives?
For each additive (SWNT and GR), the stronger silk results from a low concentration of the additive. Adding more of the additive leads to a weaker silk.
This needs to be confirmed, of course, but there are some results from other labs that suggest that the enhancement of strength at low concentrations of additive is real.
The work raises other questions. How the silkworms use the added C-materials is not understood. The process appears to be environmentally friendly (compared to other ways of adding the C-materials to silk), but the economics are not known yet.
Thus the work reported here appears to open up the possibility of a simple way to enhance silk strength. Further work is needed.
News stories:
* Silkworms spin super silk after eating carbon nanotubes and graphene. (M Andrei, ZME Science, October 10, 2016.)
* Silkworms fed carbon nanotubes or graphene produce stronger silk. (B Yirka, Phys.org, October 11, 2016.)
The article: Feeding Single-Walled Carbon Nanotubes or Graphene to Silkworms for Reinforced Silk Fibers. (Q Wang et al, Nano Letters 16:6695, October 12, 2016.)
More on silk...
* A rigid silk basket (November 10, 2020).
* Stabilizing broken bones: could we use spider silk instead of metal plates? (June 24, 2018).
* Spider silk: Can you teach an old silkworm new tricks? -- Update (February 11, 2012). Includes a good discussion of the strength test shown above.
* Previous post on graphene: A simple way to make a supercapacitor with high energy storage? (January 6, 2014).
* Next: A better way to get to Alpha Centauri? (March 15, 2017).
Previous post on carbon nanotubes: Characterization of carbon nanotubes (December 3, 2013).
More about developing strong materials... The strongest bio-material? (May 30, 2018).
Several Musings posts about silk are listed on my page Internet Resources for Organic and Biochemistry under Amino acids, proteins, genes.
Another section of that page, Aromatic compounds, lists posts on graphene and carbon nanotubes.
How bumblebees detect the electric field
October 22, 2016
In an earlier post we noted work suggesting that bees sense the electric field around flowers [link at the end]. How they do it is not understood.
A new article, from the same lab, looks at how the bumblebees sense an electric field.
The work starts by proposing two candidates for detecting the electric field: the antennae and the body hairs. Both are already known to have sensory roles.
The scientists then look at what those appendages do when exposed to an electric field. Turns out... both move.
That leads to the next stage: look at the neural response.
|
In this experiment, the scientists inserted an electrode into the bee to record the neural firing spikes from the candidate electroreceptors.
The figure shows the number of spikes recorded over time, for hairs and antennae. An electric field was applied from 0-10 seconds (the gray part of the graph).
The hairs respond to the stimulus; the antennae do not.
|
Is it possible that the antenna are just "dead", perhaps damaged by the handling? As a control, the scientists gave an aroma; they got the anticipated response from the antennae.
The y-axis labeling is confusing. What is shown is "normalized". It is actually the ratio of the response seen during the stimulus to that seen without stimulus. The confusion does not affect the qualitative interpretation.
This is Figure 6C from the article.
|
It's a clear result... Bumblebees respond to an electric field through the hairs on their body. Those hairs are already known to sense mechanical deflections. The current work shows that the electric field also deflects them, and that this leads to a neural response.
The "big picture" here is not entirely clear. For example, we must wonder whether or how the bumblebees distinguish the various stimuli, such as wind and charge, that may activate the sensory hairs. Further, results with honey bees suggest that the antennae may be the electroreceptor. Is this a species difference, or is the experimental work incomplete at this point? For now, the current article is one interesting step in the study of electric charge detection by insects.
News story: Bumblebees' Electric Sense. (T Lewis, The Scientist, May 31, 2016.)
* Commentary accompanying the article: Electric fields of flowers stimulate the sensory hairs of bumble bees. (H H Zakon, PNAS 113:7020, June 28, 2016.)
* The article, which is freely available: Mechanosensory hairs in bumblebees (Bombus terrestris) detect weak electric fields. (G P Sutton et al, PNAS 113:7261, June 28, 2016.)
Background post... Bees and flowers: A 30-volt story (June 21, 2013).
Also see:
* Electric insects (February 27, 2023).
* A mosquito-like robot (August 18, 2020).
* How bumblebees learn to pull strings (November 27, 2016).
* Cuttlefish vs shark: the role of bioelectric crypsis (May 10, 2016).
* Bee history (February 13, 2016).
* The traveling bumblebee problem (January 11, 2011).
Does the moon affect earthquakes?
October 21, 2016
The following graph shows the moon-induced tidal stresses near an earthquake site, for a period of about a month around a particular major quake.
The tidal stress has two peaks each day, and a general pattern of a two-week cycle. The peaks are at new moon and full moon.
The time of the quake is marked with a yellow star; it is at day 0 on the x-axis.
The daily peaks for the 15 days prior to the quake are marked with a ranking. #1 is the lowest peak stress of those 15 days; #15 is the highest.
You can see that the quake occurred at the peak of that cycle of stresses, a peak that was the 5th highest of the preceding 15-day period. (It is ranked 11. Remember, 15 is the highest. If you find the numbering confusing, look at the peaks.)
The quake here is the 2004 Sumatra quake, magnitude 9.3.
This is Figure 2 from the Supplementary Information for the article. It is similar to Figure 1a from the article itself, but it shows the rankings.
|
That is, the graph above shows that the 2004 Sumatra quake, a major earthquake, occurred at a peak of tidal stress.
Is this significant? Are quakes associated with peaks of tidal stress? More broadly, are quakes influenced by the moon-induced tides?
Such questions have long intrigued people. The common view has been that it is unlikely; the tidal stress is quite small compared to anything going on at the site of action.
A new article analyses a large set of data, and suggests that there is a correlation between tides and quakes, mainly for very large quakes.
What do the scientists do to reach this suggestion? Briefly, they analyze each quake as in the graph above. The quake noted above happened on rank 11 -- the 5th highest of the 15 preceding days, as explained above.
Here's more...
|
The graph shows those rankings for all the quakes in their study with magnitude above 8.2.
It is clear that most of the rankings are high.
This is Figure 2a from the article.
|
That is... Using that indicator, the scientists show that large quakes occur more frequently with high stress ranks. (In other parts of the figure, they show that no effect is seen for smaller quakes.)
Is that conclusion for real? Or is it merely a statistical fluke? After all, there are only 12 quakes in that group; large quakes are rare. If the conclusion is real, how does this work? As noted, the magnitude of the tidal stresses is quite small. Is it possible that they are "the straw that broke the camel's back" -- that in some cases, a small extra "pull", from the moon, is enough to stress something over its limit, and a large quake is more likely to happen? A variation of this, according to the authors... once a quake has started, very small stresses might affect how large it becomes.
It's a provocative result, and not easily accepted. Seismologists will think about it -- think about possible mechanisms. And they will collect more data -- but data on very large earthquakes is always sparse.
News stories:
* Study links big earthquakes to Earth-Moon-Sun alignments. (transients, September 14, 2016. Now archived.)
* Moon's pull can trigger big earthquakes -- Geologic strain of tides during full and new moons could increase magnitude of tremors. (A Witze, Nature News, September 12, 2016.)
The article: Earthquake potential revealed by tidal influence on earthquake size-frequency statistics. (S Ide et al, Nature Geoscience 9:834, November 2016.)
Other posts about earthquakes include...
* A significant local earthquake: identifying a contributing "cause"? (July 31, 2018).
* Detecting earthquakes using the optical fiber cabling that is already installed underground (February 28, 2018).
* How PBRs survive major earthquakes; why being near two faults may be safer than being near just one (September 22, 2015).
* Fracking: the earthquake connection (June 19, 2015).
* Groundwater depletion in the nearby valley may be why California's mountains are rising (June 20, 2014).
More about tides -- and not just from the Moon:
* "Tidal" effects of Mars on Earth climate? (June 12, 2024).
* Titan: tides, and the possibility of a sub-surface water ocean (August 4, 2012).
More about the Moon: Formation of the Moon: the California connection (October 10, 2014).
More from Sumatra: A new species of orangutan? (January 16, 2018).
October 19, 2016
US Presidential candidates weigh in on science questions
October 18, 2016
A science organization has put together a list of questions for the US presidential candidates, and posted the responses from four candidates. The responses are from the candidates from the two major parties as well as those from two "minor" parties, one on each side of the political spectrum.
It may be interesting to see what questions the scientists chose to ask, and then to see how candidates responded to them. The format allowed for well thought out written answers,
Much of it is probably unsurprising and unenlightening. I would not suggest that this should be a major influence in choosing a candidate (just in case there is anyone out there who hasn't chosen yet). It is perhaps more noteworthy that little of the science debate makes it into the regular political dialog.
I noticed a couple of outrageous comments, seemingly reflecting poor understanding. One was a blanket statement against nuclear power, one was a comment about opioid abuse that ignored the major role of prescription drugs. Perhaps there are others I didn't catch.
The science debate: The Candidates' Views on America's Top 20 Science, Engineering, Tech, Health & Environmental Issues in 2016. (ScienceDebate.org, September 13, 2016, and updates. Now archived.)
Also see: Obama and science (November 13, 2008). This is a preview, following the 2008 election.
Posts about government science advisers...
* The role of a government science adviser (April 22, 2014).
* Science in the White House (June 11, 2009).
My page for Biotechnology in the News (BITN) -- Other topics includes a section on Ethical and social issues; the nature of science. It includes a list of related Musings posts.
Red color vision in dinosaurs?
October 17, 2016
Let's look at some results from a recent article...
|
The graph shows the level of expression of a particular gene in western painted turtles.
The gene is CYP2J19. We'll talk about what it does later.
The y-axis shows the expression level, as judged by amount of messenger RNA. It is shown relative to the amount for a reference gene; in effect, the y-axis scale is an arbitrary scale.
|
The bars show the CYP2J19 mRNA level in various turtle tissues, for both males and females.
The basic finding is that the turtle expresses this gene mainly in two places: the retina and the red plastron. (Plastron? That's a part of a turtle shell. These painted turtles have red and black plastrons. The gene studied here is expressed in the red ones.) Qualitatively, the gene is expressed in both sexes.
This is Figure 2 from the article.
|
That's the main experimental result from the article, and it is interesting.
From this result, the authors suggest that ancient dinosaurs could see red.
That's quite a jump. Let's go back and look at what this gene is about.
CYP2J19 is a gene involved in the synthesis of a type of red pigment, specifically red carotenoids. Animals do not typically make carotenoids, but rather obtain them from their diet; however, they may modify what they eat to make novel carotenoids. The red carotenoids are common in birds. Interestingly, they are found in two parts of the bird. One is in surface structures, where they provide red color. The other is in the retina, where they are found in oil droplets, and serve as a filter, influencing how the bird perceives red.
The red carotenoids are not common outside the birds. One exception is turtles, which do have red retinal oil drops; a few also have red coloration. It is plausible that turtles could obtain the pigment from their diet, so simply having the red carotenoids does not prove they make it.
The current article shows that one of those red turtles indeed has the CYP2J19 gene active -- in exactly the same two places. It's not quite a proof that the turtles are making the red carotenoid, in retina and body surface, but it's getting close.
Then the big jump... If birds and turtles make the red carotenoid, then the key gene was probably present in their common ancestor. That would be ancient reptiles, including the dinosaurs.
The authors offer a genealogy chart to show where the gene occurs, and where it is and is not active.
Invoking more evidence, the authors suggest that the use of the red carotenoid originally was in the retina, and that its use for coloration in some animals came later, by altering gene regulation.
It's a logical argument, but it is only a hypothesis. It will be interesting to see what other evidence people can bring to bear, pro or con. In any case, the story of the red carotenoid makes this an interesting little article. It was only earlier this year that the CYP2J19 gene was connected to the red pigment in birds; within months, it has been connected to turtles and, at least speculatively, to ancient dinosaurs.
News story: 'Red gene' in birds and turtles suggests dinosaurs had bird-like color vision. (Phys.org, August 2, 2016.)
The article: Seeing red to being red: conserved genetic mechanism for red cone oil droplets and co-option for red coloration in birds and turtles. (H Twyman et al, Proceedings of the Royal Society B 283:20161208, August 17, 2016.)
Another story of red in dinosaurs: A dinosaur in color (April 5, 2010). It's a different pigment, so is unrelated to the current work.
More dinosaurs...
* Evidence for dinosaur protein extended by a hundred million years (May 12, 2017).
* The oldest known syrinx (December 4, 2016).
More about carotenoids: Red and green aphids (June 2, 2010). In this case, it was found that the aphids contain an entire biosynthetic pathway for making carotenoids -- a novel trait for an animal.
Previous post about turtles: Magnetic turtles (July 5, 2015).
More...
* Watching barnacles move (October 19, 2021).
* Why robo-turtles may be useful (April 25, 2020).
Another example of filters in color vision: How can the mantis shrimp see so many colors of UV? They use filters (August 30, 2014).
Also see a section of my page Internet resources: Biology - Miscellaneous on Medicine: color vision and color blindness.
How many species of wolf are there, and why does it matter?
October 16, 2016
The first part of the title question would seem simple enough. We just count them -- assuming we can figure out how to define what we mean by a species.
The second part of the question may be more interesting. It is why we note a recent article challenging a conventional classification of wolves. How we classify wolves has conservation -- and political -- implications.
Some wolf species are considered endangered, and are the subject of formal conservation efforts. In the US, such efforts are guided by the terms of the Endangered Species Act. We don't need to deal with any legal specifics. The point is that if wolf species are the focus of conservation efforts, it really matters how we define species. There is often political debate about conservation. Therefore, different views about how species are defined can have political implications. Uncertainty about species designations can hinder conservation efforts.
Here is an overview of the new article.
The following figure sets the stage, with a simple and traditional view of some canid species found in North America. Canid refers to the genus Canis, a group of closely related animals including the wolf, coyote, and dog. For convenience, they are sometimes referred to as wolf-like, or even just as wolves.
The dark lines show five types of canids that have separated over the last million years (1 Ma).
The first two are actually subspecies (and the Mexican wolf is not really relevant to the current study). That is, we are concerned with four species, the last four of the five types shown.
This is the top part of Figure 1 from the article.
|
Now what? A team of scientists has done extensive DNA sequencing of many animals from these populations. The basic conclusion is that the genetic data do not support that dark-line part of the chart above.
In fact, the new results are shown on that figure, at least in part. Look at the lighter lines connecting the lower four wolves. The point is that the genomes support that the gray wolf and the coyote are distinct species, However, the two shown between them, the Great Lakes wolf and the red wolf, are not well-defined species. They have various gene sets, and no clear line of descent from the others. They appear to be hybrids, arising repeatedly from the two true species.
I don't want to get into the somewhat arcane arguments about the wolf status under US law. The point is that, like many conservation efforts, it is based on understanding what the animals are -- in particular, identifying them at the species level. If we don't know what the species are, how can we protect species? Many species identifications in natural populations are questionable, open to change as we learn more. Modern molecular techniques, such as DNA sequencing, are just the most recent source of new knowledge. The authors also note that the law does not have any provision for considering the state of hybrids, even though they may actually be an important part of nature.
In one sense, the current article has increased our understanding of some types of wolves. But it has muddled their legal status. The immediate challenge is for the conservation regulators to catch up with the latest knowledge.
News story: Should the gray wolf keep its endangered species protection? New genomic research provides the scientific answer. (Phys.org, July 27, 2016.)
The article, which is freely available: Whole-genome sequence analysis shows that two endemic species of North American wolf are admixtures of the coyote and gray wolf. (B M vonHoldt et al, Science Advances 2:e1501714, July 27, 2016.)
Another conservation story, which also dealt with hybrids... Re-introducing captive animals into the wild: an orang-utan mix-up (June 27, 2016).
A previous post connecting the canids wolf and dog: Man's best friend (October 22, 2008). The dog, by the way, is classified as Canis lupus familiaris or Canis familiaris. The first of those recognizes the closeness of the dog and wolf; the two animals can -- and do -- interbreed.
More... Will a wolf puppy play ball with you? (February 7, 2020).
There is more about genomes and sequencing on my page Biotechnology in the News (BITN) - DNA and the genome. It includes an extensive list of related Musings posts.
Chromatic aberration: is it how cephalopods see color with only one kind of photoreceptor?
October 14, 2016
Lenses focus light. However, the focus varies with the wavelength -- the color -- of the light. With a simple lens, not all colors are in focus at once. That causes problems in some applications of lenses, resulting in what is called chromatic aberration. It can be annoying.
Let's turn the situation around. What if we take a simple lens, and measure its focal length for various colors of light. We can use that information to identify colors!
In a recent article, scientists suggest that some animals may do just that as a way to see color. The common way to see color is to have multiple photoreceptors, tuned for different colors. However, cephalopods, such as octopuses and cuttlefish, have only one photoreceptor, yet it seems rather likely from their behavior that they see color.
Here's the idea, based on calculating how the eye would behave...
|
The graph shows how an eye would focus on objects of various colors, as a function of distance. The y-axis is what is called the "accommodation"; it is the distance from lens to retina.
The first observation is that the curves for the different colors are different.
The next observation is more subtle, but important. Once the object is far enough away (say, about a meter), the accommodation distance is mainly dependent on the color, not on the distance.
This is Figure 3 from the article.
|
That is, the figure suggests that one could determine the color of an object by measuring what it takes to focus on it. So long as the object isn't too close, that could give a good idea of the color.
Do octopuses (for example) actually make use of this mechanism for seeing color? We don't know; it is a hypothesis for now. Again, the basic observation is that they have only one photoreceptor, but color seems to play an important role in their behavior. For example, some cephalopods engage in camouflage, matching their body color to the surroundings. Doesn't this imply they can see color?
The authors add one consideration... The cephalopods have an unusual eye pupil. It is annular (ring-shaped), and quite large. Those factors would enhance chromatic aberration. Why does the animal have a lens that enhances chromatic aberration? Perhaps it makes use of it.
News stories:
* Study proposes explanation for how cephalopods see color, despite black and white vision. (Phys.org, July 4, 2016.)
* Weird pupils let octopuses see their colorful gardens. (R Sanders, UC Berkeley, July 5, 2016.) From one of the institutions.
The article, which is freely available: Spectral discrimination in color blind animals via chromatic aberration and pupil shape. (A L Stubbs & C W Stubbs, PNAS 113:8206, July 19, 2016.) A quite readable article, especially for the background information. It (and the news stories) include pictures of the eyes of various cephalopods; also see the movie files with the article.
The article has gotten special attention in the news because of the somewhat unusual collaboration, between a UC Berkeley graduate student in biology and a Harvard physics professor. But I suspect it is not the first time that the youngster has asked his dad for help with a problem.
A post about cehalopod camouflage, partly involving coloration: Deceiving a rival male (August 28, 2012).
and maybe... A deceptive robot (September 4, 2012). (It's not clear from the post, but the robot development was, in part, inspired by octopuses. A later form of the robot is known as the Octobot.)
* Most recent post about octopuses... Why don't your arms get entangled or stuck together? (June 10, 2014).
* Next: RNA editing is a major contributor to protein diversity in cephalopod brains (June 23, 2017).
More about octopuses: Sleep stages in octopuses -- do they dream? (July 13, 2021). Includes an extensive list of posts about octopuses and other cephalopods.
Other posts about lenses include...
* How a spider can help you do better microscopy (September 9, 2016).
* A galaxy far, far away: the story of MACS 1149-JD (October 12, 2012).
* Graphene bubbles: tiny adjustable lenses? (January 15, 2012).
More about color vision as a function of the number of kinds of photoreceptors: Color vision: The advantage of having twelve kinds of photoreceptors? (February 21, 2014).
More animal vision... How reindeer see in the dark of the arctic winter (January 9, 2024).
Also see a section of my page Internet resources: Biology - Miscellaneous on Medicine: color vision and color blindness.
October 12, 2016
CRISPR notes
October 11, 2016
There is an important update to this post, in the pink box at the end.
The gene editing tool CRISPR is a hot subject, which we have discussed in several Musings posts. Of course, we can only sample the developments.
Nature recently published two one-page news stories noting some CRISPR issues in progress. Both deal, in general, with limitations and possible alternatives.
One focuses on one alternative to CRISPR that was published recently. It might have significant advantages -- if it actually works. So far, the major reaction has been that others can't get it to work. This will get resolved at some point, but there is no way we can judge it from what is published. The other uses that story as a lead to briefly survey developments that focus on the limitations of CRISPR. Update August 9, 2017... See the update note below, in the pink box, for further developments on the proposed alternative.
If you'd like a little update on some CRISPR issues, try these two news stories. They can be read independently. In particular, if you don't find the controversy of the first one interesting, skip to the second for a more general update.
News stories. Both of the following were posted at Nature News, then published together in the print journal: 536:136, August 8, 2016. They both start on that page, and both continue on to the next page. As a result of the layout, the pdf files you find for the two stories are the same, containing both.
* Replications, ridicule and a recluse: the controversy over NgAgo gene-editing intensifies -- As failures to replicate results using the CRISPR alternative stack up, a quiet scientist stands by his claims. (D Cyranoski, Nature News, August 8, 2016.) Update August 9, 2017... See the update note below, in the pink box, for further developments on this proposed alternative.
* Beyond CRISPR: A guide to the many other ways to edit a genome -- The popular technique has limitations that have sparked searches for alternatives. (H Ledford, Nature News, August 8, 2016.)
* Previous post about CRISPR: Using CRISPR to change cell fate (September 10, 2016).
* Next: CRISPR: First clinical trial in humans (November 28, 2016).
A post that includes a complete list of posts on CRISPR and other gene editing techniques: CRISPR: an overview (February 15, 2015).
Also see (re the pink box below): A tale of scientific reproducibility (September 27, 2017).
Copper ions in your nose: a key to smelling sulfur compounds
October 10, 2016
Humans can detect compounds with -SH groups, such as H2S and CH3SH, at extremely low concentrations. That's probably good, since such compounds are usually either toxic or indicative of rotten materials.
It was recognized back in the 19th century that we can detect CH3CH2SH (ethanethiol) at about a hundred million times lower concentration than the similar compound CH3CH2OH (ethyl alcohol). The latter differs only in having an O instead of an S.
The basis of the extreme sensitivity for S compounds has not been understood. One possibility is that certain metals, such as copper, might be involved. Copper ions bind S much more strongly than they bind O.
A new article provides evidence for the role of copper ions in the detection of sulfur compounds by a human odor receptor.
The following figure shows some parts of the story...
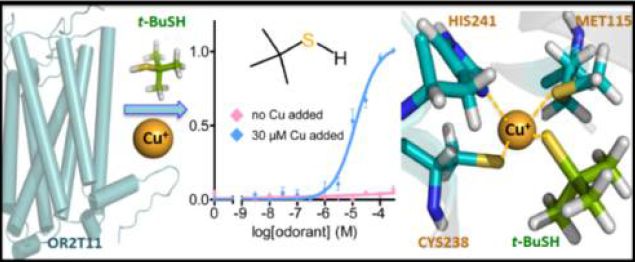
Let's start with the middle part of the figure, the graph. It shows some experimental data.
The experiment here is an artificial test in a chem lab. The odor receptor that detects certain S compounds has been hooked up so that light is emitted if it is activated. The y-axis shows the response, in arbitrary units.
The x-axis is the concentration of the odorant. It's a log scale; -6 means 10-6 M. The specific odorant tested here is 2-methyl-2-propanethiol (also called tertiary-butyl mercaptan, and abbreviated tBuSH); this is one of the compounds added to natural gas so we can detect it by odor in the event of a gas leak. The structure of the compound is shown at the top of the graph.
There are two curves. One has added copper; it is added as CuCl2, containing the Cu2+ ion.
You can see that the receptor response to tBuSH is much higher in the presence of Cu. That is the key finding.
This is the Graphical Abstract from the article. The data graph is probably the same as the upper right frame of Figure 2A in the article. The corresponding graph for the similar compound with O instead of S shows no response at all over the same concentration range, with or without Cu.
|
The other parts of the figure show some of the players.
The left-hand part diagrams the overall structure of the receptor protein. In particular, it has seven helical sections, shown here as rods, which span the cell membrane. OR2T11, at the bottom, is the name of this particular receptor.
A portion of the protein is shown in detail at the right. You can see the Cu ion, now Cu+, bound to three of the amino acids. Then the (yellow) S of the tBuSH odorant binds to the Cu ion in the receptor. If the scientists make a mutant receptor that lacks one of those Cu-binding amino acids, the response to Cu and the high sensitivity for the S odorant are lost.
The new work establishes that copper ions play a key role in our remarkable ability to detect the foul odor of -SH compounds. This supports earlier work from the same labs on a mouse receptor. These are the first cases where a role for a metal ion in odor reception has been documented.
The scientists also show that silver ions can substitute for the copper, though it is likely that copper is the metal naturally functioning there.
The work above is with one odor receptor for -SH compounds. The scientists have some evidence for a Cu effect for a few others. However, it remains to be seen how general it is. That's fine. It is a significant step toward better understanding how -SH receptors work.
News story: Copper key to our sensitivity to rotten eggs' foul smell. (F Gomollon-Bel, Chemistry World, September 30, 2016.)
The article: Smelling Sulfur: Copper and Silver Regulate the Response of Human Odorant Receptor OR2T11 to Low-Molecular-Weight Thiols. (S Li et al, Journal of the American Chemical Society 138:13281, October 12, 2016.)
The particular receptor studied here does not respond to the most famous sulfur smell, hydrogen sulfide, H2S, commonly associated with rotten eggs. It is open for further work to see if there is a Cu effect, or similar metal effect, for H2S detection.
Among many Musings posts on odor and its detection...
* Why does a durian smell so bad? (February 14, 2017).
* What's the connection: blue cheese, rotten coconuts, and the odorous house ant? (August 24, 2015).
* Why don't black African mosquitoes bite humans? (December 19, 2014).
* What happens if you block the left nostril of a mole's nose? (April 19, 2013).
* Rats, bananas, and tuberculosis (March 11, 2011).
* What does blue light smell like? (July 18, 2010).
* An electronic nose to monitor air quality on spacecraft (March 2, 2010).
More about the nose: Using your nose to fix knee damage (January 28, 2017).
More copper biology:
* Bacteria that make atomic copper (May 8, 2021).
* What's the connection: histones and copper ions? (August 15, 2020).
Staph in your nose -- making antibiotics
October 9, 2016
"Staph", typically referring to Staphylococcus aureus, is a human pathogen of concern. We have previously noted the possibility that other bacteria, including other strains of Staphylococcus, may help to keep the pathogenic Staph in check [link at the end].
A recent article reveals another piece of this story: the scientists find a strain of Staphylococcus that makes an antibiotic active against other Staph, including strains that are resistant to common antibiotics.
The new antibiotic is called lugdunin, after the name of the organism that makes it, Staphylococcus lugdunensis.
Here is a simple experiment showing what the antibiotic does...
|
In this experiment, two cultures of S aureus were grown, one with lugdunin, the new antibiotic. The graph shows the two growth curves.
The control culture behaved normally. It grew rapidly for several hours, then leveled off (or grew very slowly).
The culture with the antibiotic did not grow at all. In fact, the bacteria died off, and became undetectable after 30 hours. This result shows that the antibiotic is bactericidal: it kills the bacteria. (Some antibiotics are merely bacteriostatic, stopping the bacteria from growing, but leaving them alive.)
This is Figure 3a from the article.
|
Lugdunin kills Staph.
What led the scientists to finding this antibiotic? They looked. They started by screening a collection of bacterial strains isolated from people's noses.
In other parts of the work, the scientists show...
* The presence of S lugdunensis, the species that makes this antibiotic, in people's noses correlates with absence of S aureus.
* The antibiotic, lugdunin, is effective, in lab cultures, against a broad sample of Gram-positive bacteria, including some resistant to common antibiotics. That includes MRSA, the famous methicillin-resistant Staph aureus.
* Lugdunin is effective in a couple of animal model tests, involving rodents infected with Staph.
* The scientists determine the structure of the antibiotic, and find the genes responsible for its synthesis.
The work is interesting for two reasons. First, it provides more insight into the natural world. It shows a natural competition between bacteria -- in your nose, with practical implications. Second, it offers a new antibiotic, which can be tested further. We caution, of course, that few antibiotics that test well in early tests prove to be commercially useful. (In fact, there already is some concern about the toxicity of lugdunin.)
The authors note that the most common source for antibiotics in the past has been soil, where it is thought that the antibiotics play a role in the natural competition among microbes. They suggest that it might be good to look further for novel antibiotics from the human microbiome. Natural competition among microbes presumably is common there, too.
News story: Scientists find new antibiotic right under our noses. (F Jordans, Phys.org, July 27, 2016.)
* News story accompanying the article: Microbiology: Antibiotics right under our nose. (K Lewis & P Strandwitz, Nature 535:501, July 28, 2016.)
* The article: Human commensals producing a novel antibiotic impair pathogen colonization. (A Zipperer et al, Nature 535:511, July 28, 2016.)
Background post: Can the Staph solve the Staph problem? (July 12, 2010). Includes some useful background about Staph. The stories in this earlier post and the current post involve different species of Staphylococcus, and different mechanisms. That's fine. Each may be a part of a bigger, more complex story. Microbiomes are complex, and undoubtedly involve many interactions. The current article notes the article of the earlier post (as its ref 46).
More... Staph fighting Staph: a small clinical trial (April 8, 2017).
A recent post about the discovery of a new antibiotic: A new antibiotic: an interesting story about the discovery and action of teixobactin (March 7, 2015).
More about antibiotics: Antibiotic resistance genes in "ancient" bacteria (February 11, 2017).
My page Biotechnology in the News (BITN) -- Other topics has a section on Antibiotics. It includes a list of related Musings posts; some are on resistance issues.
The limits of the human visual system: can humans detect single photons?
October 7, 2016
The smallest possible amount of light is one photon; that is, one photon is one "particle" of light. Can a human detect a single photon?
It's been known that the photoreceptors in the eye can respond to a single photon. However, whether a person would claim to have noticed is an open question. That is, the underlying mechanism for sensing a single photon is present, but it is not clear whether the brain records such an event.
A recent article offers a new test.
The basic plan of the main experiment is that a piece of equipment does or does not shine one photon into the test subject's eye. The person must say yes or no, but then is asked to state how confident he is in the choice. (He? All the test subjects were male.)
The top part of the following figure, part a, shows the results of this basic experiment.
|
The y-axis scale shows the experimental result: the fraction of correct responses.
There are two bars. Start with the right hand (green) bar. This is for choices that were reported with "high" confidence (on a 3-point scale). These high-confidence choices were about 60% correct -- a result that tests as statistically significant. (Remember, random choice would lead to 50% correct responses -- 0.5 on the scale.)
The left-hand (brown) bar is for all results, regardless of the confidence expressed by the observer. That bar is slightly above 50%, and the authors claim it is significant. Let's not quibble about that for now, but look at a follow-up experiment.
The lower part of the figure (c) shows a follow-up.
It is similar, except that now there is a leading photon, then a gap of variable length, and then the test event. There is a diagram of the plan at the top of part c.
Look at the main part of the graph. It shows the fraction of correct responses, as before, now plotted against the length of the gap. You can see that the points toward the left, for shorter gaps, are higher than the points to the right, for longer gaps. That is, it appears that seeing one photon may make it easier to see another -- within the next 5 seconds or so.
The inset shows the same plot for choices with high confidence. There seems to be little effect of photon 1 for those choices.
This is part of Figure 2 from the article.
|
To summarize the key points... Two results show that people can detect single photons better than expected by chance. The first is that choices stated with high confidence appear to be significantly correct. Second, one photon can make it easier to detect another that follows closely -- especially enhancing choices that were not high confidence in the first place.
Taken together, the results suggest that people are responding to single photons.
There are many technical issues about how the experiment is done. Some are noted in the news stories. I'm sure they will be the subject of discussion as scientists attempt to verify, extend, and explain the current results.
News stories:
* People can sense single photons. (D Castelvecchi, Nature News, July 19, 2016.)
* The Eye Can Spy a Single Photon. (K N Smith, Discover, July 19, 2016.)
The article, which is freely available: Direct detection of a single photon by humans. (J N Tinsley et al, Nature Communications, 7:12172, July 19, 2016.)
More on the limits of human vision... Can the naked human eye measure distance to nanometer accuracy? (July 20, 2015).
Among many posts on vision...
* Color vision: The advantage of having twelve kinds of photoreceptors? (February 21, 2014).
* What if you had eyes on your tail? (July 27, 2013).
* With 24 eyes, can they see the trees? (June 11, 2011).
October 5, 2016
Hormone from bone boosts muscles
October 4, 2016
Exercise is good. Bone is good. Muscle is good. How are they all connected? A recent article uncovers one piece of the puzzle: a bone hormone, osteocalcin (Ocn), improves muscle performance.
The article is long and complex. One key part is to show that the decline of exercise performance in mice with age is due, in part, to lower levels of Ocn. Injection of Ocn into older mice restores their exercise performance to the level found with young mice.
For example...
|
The graph shows the exercise performance of old mice, which were shown to have low levels of Ocn. (The "old" mice are 15 months old.) In this exercise, the mice run on a treadmill at a fixed speed until they are exhausted.
Look at the left-hand graph. It shows the distance the mice traveled until they were exhausted.
There are three bars. The clear bar (at the left) is for control mice. The other two bars (both colored) are for mice injected with Ocn. (The two colored bars differ in a third variable which turned out not to matter much, so we'll ignore it.)
|
You can see that the osteocalcin injection approximately doubled the exercise performance of these old mice. In fact, it made their performance similar to that of young mice, who naturally have higher levels of Ocn.
The right-hand graph shows the results of the same experiment, but showing time rather than distance as a measure of the exercise performance. The results look similar.
This is Figure 6H from the article.
|
Osteocalcin is the first example of a hormone made in bone that affects muscle. However, we should note that hormone stories usually get more complex the more we learn, and this kind of interconnection should not be a surprise.
Much of the rest of the article elaborates on the mechanism. Briefly, exercise stimulates production of Ocn in bone. The Ocn then stimulates uptake of food molecules, such as glucose and fatty acids, by the muscle. There is also a positive feedback loop: osteocalcin, from bone, causes muscle to make the regulatory molecule IL-6, which then causes bone to make more Ocn.
At least part of the story is common to other vertebrates, including humans. Specifically, the authors show that osteocalcin levels decrease in humans with age. Whether Ocn is connected to muscle performance is not yet known.
The authors note that Ocn might be a useful drug in some cases. It is plausible that a hormone can be useful when there is indeed a deficiency. However, the complexity of hormone stories often means that individual hormones are not magic bullets of wide applicability. Importantly, remember that most of the work here is with mice, with only limited information on humans.
News story: Bone hormone boosts muscle performance during exercise but declines with age. (Science Daily, June 14, 2016.)
* News story accompanying the article: Exercise Has a Bone to Pick with Skeletal Muscle. (F W Booth et al, Cell Metabolism 23:961, June 14, 2016.)
* The article: Osteocalcin Signaling in Myofibers Is Necessary and Sufficient for Optimum Adaptation to Exercise. (P Mera et al, Cell Metabolism 23:1078, June 14, 2016.)
More about exercise:
* Would wild mice use an exercise wheel? (July 11, 2014).
* Why exercise is good for you, BAIBA (March 10, 2014).
Who is perturbing the orbit of Halley's comet?
October 3, 2016
Halley's comet is one of the most famous astronomical bodies. Interestingly, astronomers have not been able to predict its orbit exactly.
There are many reasons orbits may be difficult to predict. Of particular importance for Halley is that it travels through the entire Solar System; thus, it may interact with many bodies.
A new article looks at how individual Solar System planets may perturb the Halley orbit. Most of the article is computational modeling. The following figure gives the idea...
|
The graph shows the effect each of the eight planets may have on Halley. There are clearly three peaks. Something happens.
Both axes of the graph are complicated, so we'll simplify to make the main point.
There are eight curves, one for each planet. See the key at the top right.
The y-axis is a measure of the planet's effect.
The x-axis is actually not particularly important, at least for now. It is the angle between the comet and the particular planet at the start of the calculation. The point is that the scientists do the calculation of effect for all possible relative positions of the two bodies.
|
The main observation is that the family of curves shows three significant peaks. In order from left to right, they are due to Venus, Jupiter (the big peak) and Earth. (Again, where the peak is along the x-axis is not important for now.)
This is the bottom part of Figure 1 from the article.
|
That is, the graph identifies three planets with the potential to perturb the orbit of Halley's comet. What actually happens depends on their relative positions at any given time.
Not surprisingly, the maximum influence of any given body occurs when it is closest to the comet.
Further analysis shows that, given the current orbit alignments, Venus is actually the planet with the largest effect on Halley. Jupiter is larger, but Halley gets much closer to Venus. After about 3,000 years, the relative alignments of the orbits will shift enough that Jupiter will become the planet with the greatest influence on the comet. (Although Earth has the potential to influence Halley, it does not do so significantly over the next 10,000 years.)
The article cites Newton (1687) for showing that the effect would depend on both size and distance. Halley and Newton were contemporaries.
The work here will lay the groundwork for more precise predictions of Halley's comet on an ongoing basis.
News story: Chaotic orbit of Comet Halley explained. (Astronomy Now, July 1, 2016.)
The article: The origin of chaos in the orbit of comet 1P/Halley. (T C N Boekholt et al, Monthly Notices of the Royal Astronomical Society 461:3576, October 1, 2016.) It's a complex article, but quite interesting.
More about orbit complexities...
* A new trick for the Kepler planet-hunters (June 25, 2012).
* Cometnapping in the stellar nursery (August 4, 2010).
* Collision of Earth and Mars (July 8, 2009).
Posts about comets include:
* Twins? A ducky? Spacecraft may soon be able to tell (August 4, 2014). The most recent Musings post about the Rosetta mission, which ended last week.
* Were comets the source of Earth's water? (February 3, 2012).
More from Venus: The first known Vatira (August 3, 2020).
Also see: Is there enough water in the clouds of Venus to support life? How about Jupiter? (August 7, 2021).
Tri-parental embryos: the first human birth
October 1, 2016
About a week ago I posted about tri-parental embryos, where a third "parent" contributes the mitochondria [link at the end]. I did not know that the first human birth from such a procedure was about to be announced. The birth occurred last April, but was announced only a few days ago.
There is no scientific article here, just news stories -- and discussions of some interesting issues. The previous post outlined the procedure, and presented a recent article that showed a possible problem. It noted that the procedure is at the forefront of reproductive technology, with few governments even considering it yet, much less having rules. That is, there are legal and ethical questions, as well as scientific questions.
Maybe you should think about some of them.
Here is an example of what you might think about... The work on forming the tri-parental embryo was directed by a doctor whose home base is in the US. However, this work is illegal here. So, he did it in another country, one that (so far as I know) has no regulations on the matter. And he is quoted as saying "to save lives is the ethical thing to do." (That is from the news story listed below.)
Really? Did he save a life? Maybe he created a new one -- one whose chances of life were uncertain. Should we be taking such chances? Well, that's what regulatory agencies are for, to guide such work, to somehow work through the various facts and opinions. It's a slow and imperfect process. Is it ok for one scientist to simply avoid the process?
(Is it ok for a company to move their headquarters to another country, chosen because it has less regulation and lower taxes? Is that a similar question?)
My purpose above is to provoke some thought, not to take a position. The use of tri-parental embryos is new, and poorly understood. How do we proceed in such cases? It's a common question, worthy of serious thought.
News story: First MRT Baby Born. (B Grant, The Scientist, September 28, 2016.) MRT? That's mitochondrial replacement therapy. (Or maybe it's targeted mitochondrial replacement, according to the start of the article.) This is a very short item. It links to more, including stories in New Scientist (apparently the original story) and the New York Times. If you can access those sources, both are good stories.
Background post: Tri-parental embryos for preventing mitochondrial diseases (September 23, 2016). Connecting to the problem raised here... The boy just born has about 1% of the defective mitochondria. It remains to be seen whether that level will remain low enough to be without consequence.
Follow-up...
* Triparental embryos: the FDA and the regulatory dispute (September 12, 2017).
* The boy with three parents -- an article is now published (May 17, 2017).
My page for Biotechnology in the News (BITN) -- Other topics includes a section on Ethical and social issues; the nature of science. It includes a list of related Musings posts.
Coral bleaching: how some symbionts prevent it
September 30, 2016
Coral bleaching is a current issue of concern. What is it about? Corals are animals, but they commonly grow along with a photosynthetic symbiont, a dinoflagellate (sometimes loosely called an alga). Sometimes, corals expel their symbionts. That's called bleaching, to reflect the resulting white color of the coral. Importantly, bleached corals have lost their photosynthetic partner and source of food. High temperature is a trigger for bleaching. Thus coral bleaching is associated with global warming.
Interestingly, some coral-dinoflagellate associations don't bleach. It appears that it is the symbiont that is more stable to heat.
A recent article explores the nature of heat-resistant coral symbionts. It offers some clues about what is going on.
The general approach is to analyze the genes of two symbiont strains, one that is heat-sensitive and one that is heat-resistant. More specifically, the scientists look at the patterns of gene function, as judged by transcriptome analysis. That is, they look at which genes function under various conditions.
As often with genome work, there is massive data, which is hard to present. We'll content ourselves here with their summary: a model for how heat-resistance works. The following figure shows their model. Symbiodinium is the genus name for the dinoflagellate symbionts. (SM and MI are strain names.)
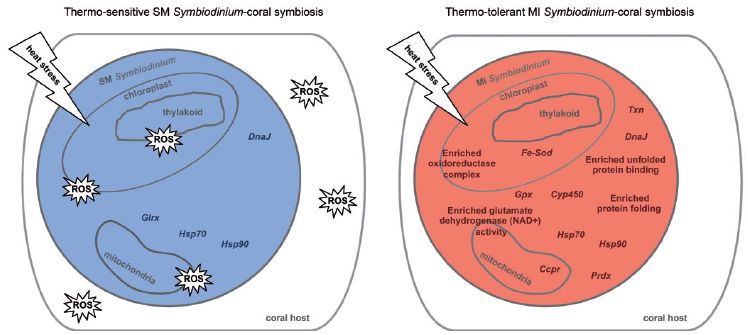
There are two major points.
* First, oxidative stress. Heat can cause oxidative stress, if some parts of the oxidative machinery don't function properly. You can see lots of "ROS" all around the heat-sensitive cell (blue; on the left). ROS means reactive oxygen species. There is ROS inside the cell and outside the cell. It is plausible that the coral host senses the ROS from the over-heated symbiont, takes that as a warning, and expels the "sick" symbionts.
In contrast, the heat-resistant cell (red; on the right) shows no ROS. Why? One specific reason is that it has a higher level of Fe-SOD; that is one form of the enzyme superoxide dismutase, a key enzyme in breaking down the type of ROS known as superoxide ion, O2-. (You can see the Fe-SOD in the chloroplast of the right-hand cell. It is very near where the top-most ROS is shown in the left-hand cell.)
* Second, protein unfolding. The heat-resistant cell has a variety of proteins that help keep proteins folded. Look to the right side of the two cells. There are a lot more things shown for the heat-resistant cell, and many are involved with keeping proteins folded. Some are even labeled that way.
This is Figure 5 from the article.
|
Where does this leave us? We know that some coral symbionts survive better than others at higher temperature (T). The current article offers some description of why. In brief, heat-sensitive symbionts undergo heat stress, including oxidative stress, at high T. The corals probably sense the stressed symbionts and expel them. The current work reveals specific genes that help a heat-resistant strain survive.
Is there anything we can do? That would be premature, but at least we might wonder about some approaches... Would inoculating waters where corals are being bleached with "better" symbionts be helpful? Would it be possible to take current heat-sensitive symbionts, develop heat-resistant mutants in the lab, and then return them to the wild? Would it be possible to do something to the symbionts or their coral hosts to improve their heat resistance physiologically? These are all questions that would require serious scientific work to address, and then it would be necessary to consider whether such a change in nature would be appropriate.
For now, we have a little better understanding of coral bleaching, and some ideas for future work.
News story: Researchers find genes in algae that could stop coral bleaching. (J Bowler, Science Alert, June 22, 2016.)
The article, which is freely available: Sex, Scavengers, and Chaperones: Transcriptome Secrets of Divergent Symbiodinium Thermal Tolerances. (R A Levin et al, Molecular Biology and Evolution 33:2201, September 2016.)
The issue of coral bleaching was briefly noted in the post COOL AS HELL! Sea slug that runs on solar power (Really) (November 30, 2008). (A caution... The work described in this post has become controversial. Be sure to read the follow-up posts if you are interested in the content.)
Other posts about corals include...
* Coral history: evidence from old maps (December 12, 2017).
* Poisonous snakes and their mimics (August 15, 2016).
* An example of coral growing well in a naturally acidified ocean environment (February 16, 2014).
* File dates and human settlement in Polynesia (November 16, 2012).
More dinoflagellates:
* Is the warnowiid ocelloid really an eye? (October 12, 2015).
* Quiz: What is it? (March 6, 2012). Mentions another case of a dinoflagellate serving as a photosynthetic symbiont.
Posts about ROS include: How oocytes limit oxygen-induced aging (August 20, 2022).
Also see: Improving photosynthesis by better adaptation to changing light levels (February 27, 2017).
September 28, 2016
The snakebite problem
September 27, 2016
The problem? Lots of people get bit by poisonous snakes. Many die, for lack of antivenom treatment. Why? There are various reasons, including the difficulty of getting antivenom to people in remote or under-developed areas.
The more interesting reason may be the source of the antivenom. There are many kinds of poisonous snakes, each requiring its own antivenom. It's an expensive undertaking to make antivenoms.
The economic problem was highlighted recently when a major pharmaceutical company announced that it would discontinue making a particular antivenom product. No alternative is yet apparent. People will, we presume, die because of their decision.
It's not clear where this story will go. A recent news feature from Nature presents the problem; it's worth a read.
News feature, freely available: Vipers, mambas and taipans: the escalating health crisis over snakebites -- Snakes kill tens of thousands of people each year. But experts can't agree on how best to overcome a desperate shortage of antivenom. (C Arnold, Nature News, August 30, 2016. In print journal: 537:26, September 1, 2016.)
Recent post on poisonous snakes: Poisonous snakes and their mimics (August 15, 2016).
More: Snake venom gland organoids (March 17, 2020).
An antibody to treat Alzheimer's disease: early clinical trial results
September 26, 2016
A new article reports an interesting development toward the treatment of the cognitive decline we call Alzheimer's disease (AD).
Here is a nice summary of the common model for how the small peptide Aβ-42 leads to AD...
The key player is called amyloid beta-42, or Aβ-42. It is a small peptide, cut out from a larger protein. (The 42 refers to the length of the peptide; the number is often omitted.)
The left side shows Aβ in three forms (all in blue): the original monomer, and two sizes of aggregates. The smaller aggregates, called oligomers, are soluble; the larger aggregates are insoluble and form the plaque that is typical of AD. The role of the various forms is still debated, but it is likely that both of the aggregated forms are important in the disease process.
The remaining steps, to the right, show one working model of how Aβ leads to AD. All we need for now is the key role of Aβ, in particular its two aggregated forms.
This is Figure 1 from the news story accompanying the article.
|
The important development is that we now have an antibody that acts against both of the aggregated forms of Aβ. That antibody, called aducanumab, is in clinical trial. The new article reports early results from that trial.
Here are some results for plaque...
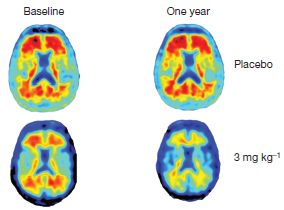
|
The figure shows PET scans of the brains of two people in the trial, at the start (baseline) and after a year. The PET scan is based on a stain specific for amyloid plaque. In brief, red is bad.
The placebo patient (top row) showed little change in plaque between the two measurements.
The treated patient (bottom) showed a major reduction in the amount of plaque after a year of treatment. This is for a patient who received a low dose of the drug.
This is part of Figure 1 from the article. The full figure includes results for two higher doses. They are as good as, or even a little better, than the result shown here for the low dose.
|
The figure above shows that the drug did what it was supposed to: reduce the amount of plaque. The figure shows the result for one patient; the full analysis agrees, for all doses.
Of course, AD is about mental function. Plaque may be reduced, but did the treatment affect mental function? Is it possible to slow the rate of cognitive decline?
It is important to emphasize that the trial is not intended to provide evidence on mental function. It is not large enough. Nevertheless, the authors do administer a couple of mental tests, and the results are interesting.
Here are the results for one test of mental function. The test is called the Mini Mental State Exam (MMSE).
|
The graph shows the test score (y-axis) vs the treatment dose, for two times: about a half year and a year after the start of the trial. Test scores are shown as changes from the initial score. Most score changes are negative, showing decline.
For example, you can see that the scores for the placebo group were about -1.5 at 24 weeks and about -3 at one year; that shows steady decline in the placebo group.
|
What about the treatment groups? Be careful! Most of the results for the treatment groups show smaller declines than for the placebo group. However, the results are oddly varying with dose. Further, the error bars are large. Most of the results are not statistically significant, and even those that are (marked with *) must be taken with some suspicion.
This is Figure 3b from the article.
|
Intriguing, isn't it? But remember, these are preliminary results, and they are complicated.
The results from this trial are encouraging. But it is important to remember that this is a small Phase I trial. Many drugs look good in Phase I, then fail with more extensive testing. Phase 3 trials are in progress; these will focus on measurement of cognitive function. We'll see what happens.
News stories:
* Trial drug shows 'impressive' Alzheimer's action: study. (Medical Xpress, August 31, 2016.)
* Paper Alert: Aducanumab Phase 1b Study Published. (AlzForum, September 2, 2016.) The Comments section of this page includes contributions from professionals in the field, and are worth reading.
* News story accompanying the article: Alzheimer's disease: Attack on amyloid-β protein. (E M Reiman, Nature 537:36, September 1, 2016.)
* The article: The antibody aducanumab reduces Aβ plaques in Alzheimer's disease. (J Sevigny et al, Nature 537:50, September 1, 2016.)
Recent post on AD: Transmissibility of Alzheimer's disease? (June 1, 2016). Overview.
Next: Do chimpanzees get Alzheimer's disease? (October 17, 2017).
My page for Biotechnology in the News (BITN) -- Other topics includes a section on Alzheimer's disease. It includes a list of related Musings posts.
A quick-response system for making new vaccines
September 24, 2016
Vaccine development can be slow, even when we know what antigen to use. The annual ritual of making new influenza vaccines is an example: the choice of strains must be made several months in advance, to allow time for vaccine production. Further, new disease outbreaks, such as Ebola or Zika, challenge us to make a rapid vaccine response.
A recent article offers a quick way to make a new vaccine. It's a modular vaccine system; all one needs to do is to "drop in" the instructions for the new antigen. A messenger RNA for the antigen of interest is synthesized, and incorporated into "standard" liposome-like nanoparticles, which serve as a universal platform for the vaccines. That is, making a new vaccine just requires making the new mRNA, and then assembling the new nanoparticles, using a standard recipe. The scientists estimate it takes a week to make a new vaccine.
Of course, there are details, at least some of which are developed in the article. The scientists work out a system for making the vaccine particles, and test it for three cases. One feature of interest is that the mRNA is included in the vaccine in a form that can replicate; this is done by making use of knowledge about RNA viruses. That increases the antigen delivery; in fact, they see a good robust immune response to a single vaccine dose. Yet the virus is transient; the viral replication system is not from a retrovirus, and the virus cannot integrate into the host genome.
Another interesting feature is the use of polyamines to encapsulate and protect the RNA. The positive charge of the amines promotes complex formation with the (negatively charged) RNA. However, once taken up into the neutral cytoplasm, the polyamine charge is lost, releasing the RNA.
Here are some results for one test...
|
For this test, two vaccine preparations were made, using the nanoparticle system. One included the mRNA for making the common hemagglutinin (HA) antigen of influenza virus. The other was a control, coding for a non-viral protein.
Mice were immunized using the two vaccines. 14 days later they were infected with the flu virus.
The graph shows the body weight of the mice following infection. The upper (red) curve is for the mice that received the new flu vaccine. They maintained their weight for the entire time shown. (In fact, they were all doing fine out to 21 days, when the experiment was terminated.) The lower (blue) curve is for the mice that received the control vaccine. Their body weight declined steadily, and all were dead in about a week.
This is Figure 3A from the article.
|
The new vaccine worked.
The article also includes results for a vaccine against Ebola, and for one against Toxoplasma. In the latter case, the vaccine was made with six antigens, that is, with mRNA coding for six antigens. Presumably, one could make a single vaccine prep with antigens for multiple strains of flu.
This is a potentially exciting development. It offers rapid vaccine production, and also a standard way to make vaccines. It may also be useful during vaccine development, to explore the use of various antigens. The article has no information on costs or on long term safety. It is, as so often, a good step. Let's see what happens.
News story: Engineers design programmable RNA vaccines: Tests in mice show they work against Ebola, influenza, and common parasite. (Phys.org, July 4, 2016.)
The article: Dendrimer-RNA nanoparticles generate protective immunity against lethal Ebola, H1N1 influenza, and Toxoplasma gondii challenges with a single dose. (J S Chahal et al, PNAS 113:E4133, July 5, 2016.) A very readable article.
Key authors have filed for a patent on this development, as noted in the conflict of interest statement in the article. The news story also notes that they plan to start a company to develop the product.
More about flu vaccines: Is it worthwhile to require flu vaccination for health care workers? (March 6, 2017).
Posts on flu and flu vaccines are listed on the page Musings: Influenza (Swine flu).
More on vaccines is on my page Biotechnology in the News (BITN) -- Other topics under Vaccines (general). It includes a list of related Musings posts.
Tri-parental embryos for preventing mitochondrial diseases
September 23, 2016
A recent post was about mitochondrial inheritance [link at the end]. In particular, it was about how the mitochondria from the father are eliminated after a sperm fertilizes an egg.
This post is about another aspect of the mitochondria problem -- an aspect that is at the leading edge of modern reproductive technology.
Consider the case... Mother has a mitochondrial disease. That is, it is known that she has defective mitochondria, which would be passed on to her children. Perhaps we could avoid the problem by providing her fertilized egg with new mitochondria. The result would be a tri-parental embryo: one parent provided the egg and one the sperm, and a third parent provided the mitochondria. Such a procedure has been worked out in lab animals, and is now under development in humans. It has been approved for human experimentation in some countries, but we still have little experience with it.
A recent article tests how the mitochondria behave in a model system related to what happens in making tri-parental embryos. The results are of some concern.
Here is the plan...
|
Start with the egg cells (oocytes, human) 1 and 2, at the left. The red and green colors denote that they are from different donors. They have different kinds of mitochondria.
Parts of cells 1 and 2 will be combined to form cell 3. Cell 1 donates a nucleus (or, equivalently, a spindle structure containing the chromosomes). Cell 2 is enucleated, so it does not contribute a nucleus. Cell 3, then, has the nucleus from cell 1 and the cytoplasm, including mitochondria, from cell 2.
That's the plan. But it's not exactly what happens. Note the red specks in cell 3. Those are mitochondria from the cell that was supposed to contribute only a nucleus. Does this happen? It usually does, at a low level. What are the consequences of the carryover of the wrong mitochondria? That's the purpose of the test here.
|
What next? If this were to be part of a real reproduction event, a sperm would enter the picture. But here that step is skipped. The hybrid egg cell is activated parthenogenically. That is, cell 3 is grown, as if it were to make an embryo -- but without a sperm contribution. Then, stem cells are isolated. The resulting stem cell lines are tested to see what kind of mitochondria they have.
The carryover of a few mitochondria has been known. What has not been clear are the consequences. It is often assumed that a small carryover would not be significant.
The figure is slightly edited from the Graphical Abstract with the article. I have removed some parts that I though unnecessary here, and I numbered three of the cells, for ease of reference.
|
Here are some results...
|
The graph shows the percentage of one mitochondrial type as the cell lines grow. The mitochondrial type that is followed here is the one from the nuclear donor; ideally, that cell should not have provided mitochondria.
The simple result is that the cell lines vary. Indeed, some of them are zero throughout, as desired. However, two of the call lines show a high frequency of the mitochondria that shouldn't be there.
This is Figure 1D from the article.
|
That's the point for now. The experiment shows that the mitochondria are not behaving entirely as "expected". The test here is a model system, not a true tri-parental mating; nevertheless, it seems relevant. The implications are not clear. The take home lesson is that we still need to learn more about how the mitochondria behave in such crosses. That means we need to proceed cautiously with making tri-parental embryos, whose purpose is to improve the mitochondrial health of the offspring.
This is a post that does not provide an answer. Rather, it alerts us to some issues. The "basic science" part of this is that we have only a superficial understanding of how mitochondria are integrated into cells. And there is a very practical implication, since we are now beginning to manipulate mitochondria as a medical treatment.
News stories:
* Stem cell study suggests mitochondrial donation might not be 100 percent effective. (R Morley, BioNews, May 23, 2016.) Links to more news stories, as usual for this site.
* Mitochondrial DNA therapy still imperfect. (Visible Embryo, May 27, 2016.)
* Three-person embryos may fail to vanquish mutant mitochondria. (E Callaway, Nature News, May 19, 2016.) A broader (but still short) overview of the field, including the current article.
The article: Genetic Drift Can Compromise Mitochondrial Replacement by Nuclear Transfer in Human Oocytes. (M Yamada et al, Cell Stem Cell 18:749, June 2, 2016.)
Background post on mitochondria: How are mitochondria from the father eliminated? (September 20, 2016).
An important follow-up: Tri-parental embryos: the first human birth (October 1, 2016).
And... The boy with three parents -- an article is now published (May 17, 2017).
More about mitochondria, with implications for a possible alternative... Transmission of mitochondria from the father -- in humans (March 26, 2019).
More about reproductive technologies... In vitro fertilization: Will it suffice to transfer only one embryo? (May 19, 2013)
Also see...
* Unusual twins: neither monozygotic nor dizygotic, but... (March 11, 2019).
* Why human egg cells become increasingly defective as the mother ages (June 21, 2016).
* Children with two fathers (January 3, 2011).
I have a Biotechnology in the News (BITN) page for Cloning and stem cells. It includes an extensive list of related Musings posts.
September 21, 2016
How horses learned to walk
September 21, 2016
England, about 875 AD (give or take a couple decades). A mutation called DMRT3_Ser301STOP. That means it is in the DMRT3 gene; codon number 310 was mutated from coding for serine to a stop codon.
What's this about? Well, it's not about walking per se, but about characteristic ways horses walk, called ambling or pacing These unusual walking modes are considered part of why riding horses is so popular. The mutation is in a gene involved in limb coordination. This mutation is widespread in modern horses around the world.
The year 875? How do we know that? That's the result in a brief recent article. The scientists examined the genomes of numerous horses from all around Europe over several millennia. The mutation was first seen in horses from medieval England, around 875 AD. It appeared later in Iceland, and later still in continental Europe.
The authors suggest that the Vikings took English horses with them to Iceland. They liked how the English horses rode on the rough Icelandic roads, so they selectively bred them. That's an example of how we infer history from genetic analysis.
There are limitations to the data set at this point, as the authors note. Nevertheless, it's a fun little article, providing some insight into the development of one trait of a domesticated animal.
News story: DNA shows that horse's 'funny walk originated in York'. (M McGrath, BBC, August 8, 2016.)
The article: The origin of ambling horses. (S Wutke et al, Current Biology 26:R689, August 8, 2016.)
More horse history...
* Briefly noted... How big were medieval war horses? (January 25, 2022).
* The oldest DNA: the genome sequence from a 700,000-year-old horse (August 4, 2013).
* Leopard horses (December 2, 2011).
More about walking...
* Wings for better walking (November 5, 2011).
* "Moonwalkers" -- flies that walk backwards (May 28, 2014). Links to more.
Another domestication story: The history of brewing yeasts (October 28, 2016).
More from Iceland: Aerosols and clouds and cooling? (August 27, 2017).
How are mitochondria from the father eliminated?
September 20, 2016
When a sperm fertilizes an egg, the two parental gametes make equal contributions of nuclear genetic information -- the regular chromosomes. However, the mitochondria from the father are lost. That is, mitochondria are inherited only through the mother. How paternal mitochondria are lost -- or why -- is poorly understood.
A recent article explores the issue of paternal mitochondrial elimination (PME), as the authors call it.
Let's jump in and look at one experiment from the article. We can then try to put it in context.
|
The graph shows the number of paternal mitochondrial clusters seen in zygotes, after various crosses. (How can we tell which mitochondria are paternal? The males were stained before mating.)
It is clear that two of the bars are high and two are low. That is, the paternal mitochondria were lost in the two crosses shown to the left (that's normal), but not lost in the two crosses to the right.
What's the difference? The key information about the crosses is given at the bottom. Strain N2 is the wild type; strain cps-6 carries a mutation (which we will describe below).
You can see that the crosses with reduced loss of paternal mitochondria (the high bars) are those where the male carried the cps-6 mutation.
In particular, compare the middle two bars. Those two crosses involve the same two strains. The difference is which strain carries the mutation. If the male carries it (cross 3), mitochondrial loss is reduced (high bar).
This is Figure 2D from the article.
|
The main conclusion is that a particular mutation, if present in the male, reduces loss of paternal mitochondria.
What is this cps-6 mutation? The CPS-6 gene codes for a nuclease, called endonuclease G (or endo G); it is the enzyme that destroys the DNA of the paternal mitochondria. Loss of the endo G nuclease, in the (lower case) cps-6 mutant strain, prevents loss of the paternal mitochondrial DNA. This is one key step in the process of loss of paternal mitochondria. The graph above shows that loss of this enzyme reduces loss of the mitochondria themselves.
It also seems clear that each mitochondrion is destroyed by its own endo G. Observation shows that the endo G is originally in the space between the two mitochondrial membranes. Upon fertilization, the inner membrane is lost, thus releasing the endo G into the innards of the mitochondrion where it can destroy the DNA. This scenario also explains why the mutation must be in the male in order to have an effect.
The discussion above shows part of the process of how paternal mitochondria are lost. It's long been known that the egg has a process for eliminating paternal mitochondria. We now see that, in some sense, the paternal mitochondria destroy themselves. The full story isn't yet clear. What gets this process started? Fertilization may be the trigger, but it seems that paternal mitochondria are prepared to self-destruct. Or maybe they even start to self-destruct before fertilization.
The work here is with the worm Caenorhabditis elegans. Is it relevant to humans? Who knows. The basic phenomenon of elimination of paternal mitochondria is universal (or nearly so), but it is possible that the mechanism may vary. (Humans do have an endo G nuclease in their mitochondria.) The current work is a step towards understanding the phenomenon in one case.
News stories:
* Solving a mitochondrial mystery. (Medical Xpress, June 24, 2016.)
* Sperm self-destruction may lie behind maternal mitochondrial inheritance. (K Howe, BioNews, July 4, 2016.) Links to more news stories.
* News story accompanying the article: Genetics: Demystifying the demise of paternal mitochondrial DNA. (A M van der Bliek, Science 353:351, July 22, 2016.)
* The article: Mitochondrial endonuclease G mediates breakdown of paternal mitochondria upon fertilization. (Q Zhou et al, Science 353:394, July 22, 2016.)
Posts about mitochondria include...
* Transmission of mitochondria from the father -- in humans (March 26, 2019).
* Nuclear-mitochondrial interactions -- and the definition of a biological species (June 18, 2017).
* Tri-parental embryos for preventing mitochondrial diseases (September 23, 2016).
* What can the mites on your face tell us about your ancestry? (May 31, 2016).
* Is the warnowiid ocelloid really an eye? (October 12, 2015).
More about the egg-sperm interaction... In the beginning... It's Izumo1 + Juno (May 23, 2014).
Recent post involving the use of C elegans as a model organism: Extending lifespan by dietary restriction: can we fake it? (August 10, 2016). (The same N2 strain is the control in that work, too.)
Doing X-ray "crystallography" without crystals
September 18, 2016
X-ray crystallography is a major tool for determining molecular structures. It starts with a crystal; then one shines X-rays through the crystal, and looks at how the X-ray beam is distorted by the molecule. That distortion is due to the structure of the molecules. One can work backwards from the pattern of X-rays that emerges after passing through the crystals, and calculate the structure.
But there is a catch. You need to make crystals -- and some molecules are hard to crystallize.
Could we use X-rays to determine structure without crystals? A new article shows how. The point is that it isn't the crystal that matters; it is the regular pattern. A crystal is just a way to provide an array of molecules in a regular pattern. If you could arrange for a group of people to each hold up one molecule, so that, overall, the molecules were in a regular pattern, you could use X-rays and determine the structure of the molecules (in principle, ignoring issues of scale).
What the scientists have done is to develop a practical way to provide a regular pattern of molecules. They "hang" the molecules onto a large molecule with a regular structure -- a large molecule that we have noted before, a metal-organic framework, or MOF.
The following figure shows an example of how a small molecule can be "hung" on a MOF. Caution... It's hard to see all the detail.

|
At the right is the basic unit of the MOF, labeled Δ-MOF-520.
Just to the upper left is a set of arrows, with compound 1 shown above them. That compound is benzoic acid.
The big structure at the left consists of the adduct of the MOF with four molecules of benzoic acid. You can find them easily because of the rings. (They are of different darknesses, because they have different orientations.) The adduct is labeled Δ-MOF-520-1.
|
A little more detail...
Just below the arrows is another small molecule, in yellow. That is formic acid. If you look more closely at the original MOF, it includes four of these. In fact, what happens is that the benzoic acid molecules (compound 1) replace the formic acid molecules. This illustrates the design of the MOF. It has these binding sites for an acid. It is made with formic acid, but that acid can be replaced with the acid of interest (in this case, benzoic acid).
The MOF itself is chiral. The Δ in the name specifies the stereoisomer. It's not an issue in this example, because benzoic acid is not chiral. However, the known chirality of the MOF is very helpful when studying small molecules that are chiral.
This is part of Figure 2B from the article. The full figure shows all the small molecules tested (in part A) and other examples of the adduct (B).
|
What happens next? They determine the X-ray structure of the adduct. It includes the structures of both parts: the MOF and the small molecule being studied. The former is already known; they subtract it out. That leaves the structure of the small molecule; that's the goal.
In the article, the scientists test several molecules. Some are small molecules with well established structures, such as the benzoic acid shown above. Testing these serves to validate the method. They also test a few more complex biological molecules, and again show that the method works.
In one case, the scientists studied two very similar hormones. The only difference was a C-C single bond in one versus a C=C double bond in the other. Both the bond lengths and the bond angles were clear enough in the structures to distinguish the single and double bonds. This attests to the structure of the chemicals attached to the MOF being very regular.
For another hormone, they were able to determine the stereochemistry directly -- something that had not been done before.
The limitations of the method are not clear; for now, the point is that if one has trouble crystallizing a molecule, attaching it to a support structure such as a MOF may be an alternative approach.
It is quite clever.
News stories:
* Put Molecules on the Rack to Extract Structural Secrets. (GEN, August 24, 2016.)
* A New Way to Display the 3-D Structure of Molecules. (G Roberts Jr., Lawrence Berkeley National Laboratory, August 18, 2016.) From the institution.
* News story accompanying the article: Crystallography: Now you see me too -- Attaching chiral molecules to a chiral framework allows their molecular structures to be determined. (L Öhrström, Science 353:754, August 19, 2016.)
* The article: Coordinative alignment of molecules in chiral metal-organic frameworks. (S Lee et al, Science 353:808, August 19, 2016.) Check Google Scholar for a copy from the authors.
Posts on MOFs...
* Zhemchuzhnikovite: a natural MOF (August 19, 2016).
* Cooperation: a key to separating gases? (March 28, 2014).
More about bond lengths: The longest C-C bond (April 17, 2018).
Among posts using X-ray crystallography...
* Cockroach milk (August 21, 2016).
* How flippase works (September 25, 2015).
Also see: CISS: separating mirror-image molecules using a magnetic field? (August 7, 2018).
New evidence on the human colonization of Madagascar
September 16, 2016
The African island nation of Madagascar is a few hundred miles off the coast of Africa, but many aspects of its culture suggest that its history is not primarily African. For example, both linguistic and genetic information suggest that the Madagascar culture originated from southeast Asia -- ten times further away.
Interestingly, however, there has been nothing in the archeological record to support the Asian contribution to Madagascar culture.
A recent article fills that gap. The approach is to collect ancient plant seeds, date them, and determine their origin. That last step is done by having expert botanists identify them; nothing high tech here.
The following figure summarizes the findings...
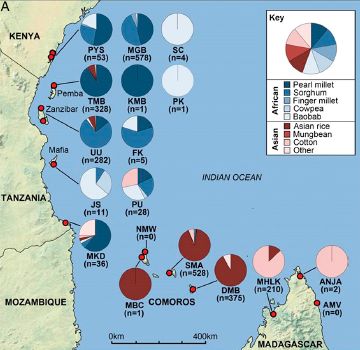
|
Each small red dot is a sampling site. Accompanying each red dot is a pie chart, showing what ancient plants were found. The samples of interest here are about a thousand years old.
The plants are listed at the upper right. But all we need here is one general pattern. The plants were classified as African or Asian. The former are coded in blues, the latter in reds.
The lower row of pie charts is largely red, whereas most above that are largely blue. The blue pie charts are for sites on or very near the east African coast. The red pie charts are for islands further to the east. These include Madagascar and also the Comoros Islands, between Madagascar and the African coast.
This is Figure 1A from the article.
|
That is, analysis of plant remains from a thousand years ago suggests a major contribution of Asian plants to Madagascar (and to the Comoros), but not to the African mainland. Thus, the work here provides physical evidence pointing to an Asian origin for some aspects of the culture of Madagascar. This supports the anthropological evidence that had already been available.
The botanical evidence for the Comoros Islands was more of a surprise. In contrast to Madagascar, the culture there is largely African, yet the new evidence supports a role for an early Asian contribution.
The article shows how identification of ancient plant remains can help us understand the origins of human culture. The botanical evidence must be taken along with other evidence. The situations in Madagascar and the Comoros are different, but both show evidence for an Asian contribution a millennium ago.
News stories:
* Ancient crops provide a window into Madagascar's settlement by Southeast Asians. (Popular Archaeology, May 30, 2016.)
* Ancient Crops Help Solve Puzzle of Madagascar's Southeast Asian Settlement. (E de Lazaro, Sci.News, June 1, 2016.)
The article, which is freely available: Ancient crops provide first archaeological signature of the westward Austronesian expansion. (A Crowther et al, PNAS 113:6635, June 14, 2016.) A very readable article. It includes extensive discussion of how to mesh the various lines of evidence.
More from Madagascar:
* A tiny titan (May 9, 2016).
* Underground hibernation in primates? (October 6, 2013).
September 14, 2016
Death by bagpipe
September 13, 2016
Briefly noted...
On October 10, 2014, a musician being treated in a UK hospital died, apparently having been killed by his instrument -- or, rather, by the fungi growing in it.

|
The instrument, disassembled, and a culture plate from it.
This is part of Figure 1 from the article.
|
It's hard to be sure, but the cause-effect connection seems likely. What happened, apparently, is that the continued exposure to strong antigens -- from the fungi in the instrument -- caused a condition known as hypersensitivity pneumonitis. The excessive immune response, over years, caused the damage.
One clue to the connection was that the person's symptoms had improved when he went on an extended vacation -- without his bagpipes.
There have been occasional reports of infections likely due to fungi in wind instruments, including saxophone and trombone. In all seriousness, some care of the instrument would be a good idea.
News story: Wind musicians warned over hygiene as fatal case of 'bagpipe lung' reported. (N Davis, Guardain, August 22, 2016.)
The article: Bagpipe lung; a new type of interstitial lung disease? (J King et al, Thorax 72:380, April 2017.)
Also see:
* Can you get sick from the street cleaning truck? (December 10, 2017).
* Playing music can make you sick (July 31, 2010).
Next music post: Musical dissonance: is it innate? (October 31, 2016).
There is more about music on my page Internet resources: Miscellaneous in the section Art & Music. It includes a list of related Musings posts.
Are yeasts important partners in lichens?
September 12, 2016
A lichen is a composite organism: a photosynthetic microbe plus a fungus, growing together as if it were a single organism. Lichens are perhaps the first example of symbiosis that many of us encounter.
Is it possible that our familiar description of lichens is inadequate? A recent article raises the possibility.
The claim is that many lichens also contain a yeast, and that it is an integral part of the symbiotic relationship.
The article shows less than that. It provides good evidence that many lichens contain a yeast. There is little evidence on its role, but its fairly well defined location might suggest it has a role.
Some terminology... Two major types of fungi are the ascomycetes and basidiomycetes, based on their style of reproduction. Common molds are ascomycetes; common mushrooms are basidiomycetes.
A "yeast" is a fungus growing as single cells, rather than the more usual filaments. That is, "yeast" is a general term, referring to the growth form. The word is also used to refer to a specific common yeast, Saccharomyces, which is an ascomycete. In fact, most common yeasts are ascomycetes.
The point? A distinctive feature of the yeasts associated with the lichens is that they are basidiomycetes.
Here is one interesting figure from the article...
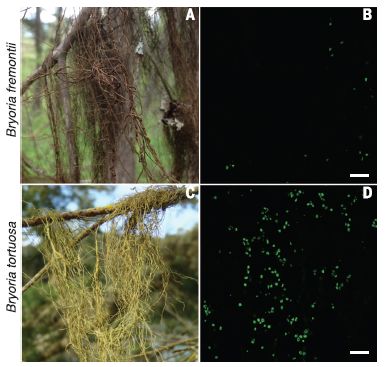
|
The figure shows two lichens, which are named at the left. Note that a lichen is named as if it were a single organism. (Presumably that was done before its composite nature was recognized.)
The left-hand frames (A and C) give the macroscopic view; this is what we see.
The right-hand frames (B and D) show a test for a particular yeast. The idea is that a "gene probe" is used for that yeast; if the probe attaches to the lichen -- in this case, to the yeast in the lichen -- it "lights up". You can see that it lights up many sites in the lower lichen, but very few in the upper one.
|
As a little background for doing this experiment... The two lichens here seemed to contain the same components, but had different characteristics. (You can see that they are different colors, as a simple example.) Further analysis showed that some of the messenger RNA molecules (gene transcripts) found in one species appeared to be from a yeast. The experiment here is one type of follow-up to examine that yeast. Discovery of the yeast component of one offers a clue why the composite lichens have different characteristics.
The gene probe technique used here is called fluorescence in situ hybridization (FISH). "In situ" refers to the probing being done within the organism.
The scale bars in the gene probe frames are 20 micrometers.
This is Figure 3 from the article.
|
Thus the figure provides evidence for a particular yeast, a basidiomycete, in a particular lichen. The presence of the yeast correlates with some different characteristics, but the nature of the connection is not known.
Further work showed that similar yeasts were present in many lichens, from around the world.
It's an intriguing article. It challenges our familiar understanding of lichens, but it's not clear what the new view is. That's fine. Maybe the point for now is to simply open up the field for new studies. Maybe lichens, at least some lichens, are more complex than we thought.
News story: Yeast emerges as hidden third partner in lichen symbiosis. (Science Daily, July 21, 2016.)
* News story previewing the article, in prior issue of the journal: Symbiosis: A lichen ménage à trois. (E Pennisi, Science 353:337, July 22, 2016.)
* The article: Basidiomycete yeasts in the cortex of ascomycete macrolichens. (T Spribille et al, Science 353:488, July 29, 2016.)
Previous mention of lichens in Musings: none.
More on basidiomycetes:
* An antidote to the mushroom toxin α-amanitin (June 12, 2023).
* Lux aeterna: Mushrooms; Mozart (December 7, 2009)
Among many posts on symbioses, often noting that they are only partially understood...
* Can Wolbachia reduce transmission of mosquito-borne diseases? 1. Introduction and Zika virus (June 14, 2016).
* Origin of eukaryotic cells: a new hypothesis (February 24, 2015).
* More on photosynthetic sea slugs (February 20, 2015). This post includes a FISH experiment.
Using CRISPR to change cell fate
September 10, 2016
A new article connects two major stories of recent years: stem cells and gene editing.
Much recent stem cell work has been dominated by induced pluripotent stem cells (iPSC) and its variations. The heart of this work is reprogramming cell fate: changing which set of genes a cell expresses. In the original work of Yamanaka on iPSC, treatment with a set of four genes led to differentiated body cells (e.g., skin cells) being converted to something similar to embryonic stem cells -- the iPSC. In other cases, using a similar approach but different genes, scientists have been able to convert one type of differentiated cell to another type of differentiated cell. That latter process is sometimes called trans-differentiation.
Recent work on gene editing has been dominated by CRISPR. Its ease of use makes it far more convenient than earlier methods. The ease of use comes from the fact that specificity -- recognition of DNA sequence -- is provided by RNA, whereas earlier methods used protein.
You've probably already guessed... The new article uses CRISPR-based gene editing to reprogram cell fate. Specifically, the scientists started with skin cells and reprogrammed them to become neurons.
The new work is simple in some ways, but also raises new questions.
The simple part of the story is that the authors used the CRISPR system to activate a set of genes known to be needed for inducing the development of neurons. In earlier work, scientists had added extra copies of those key genes, in order to change the cells to neurons. In the new work, CRISPR was introduced to activate the endogenous copies. It worked -- better than the earlier work.
As they explored the system, and tried to analyze why it worked, they found that modifications of histone proteins -- sometimes called epigenetic marks -- were playing a key role. This is both intriguing and confusing. The bulk of the article is on analyzing what is happening, and it is not very clear.
We take this work as an interesting but preliminary new finding. It opens up the possibility of making it easier to study cell differentiation.
News story: Directly Reprogramming a Cell's Identity With Gene Editing. (Neuroscience News, August 11, 2016.)
* News story accompanying the article: Advanced Technologies Lead iNto New Reprogramming Routes. (Y Zhou & L Qian, Cell Stem Cell 19:286, September 1, 2016.) This news story is on two articles, the second of which is the current article. (The other is about the requirements for making neurons.) The odd capitalization in the title? iN stands for induced neurons.
* The article: Targeted Epigenetic Remodeling of Endogenous Loci by CRISPR/Cas9-Based Transcriptional Activators Directly Converts Fibroblasts to Neuronal Cells. (J B Black et al, Cell Stem Cell 19:406, September 1, 2016.)
A recent post recalling the discovery of iPSC: Ten years of iPSC (August 24, 2016).
I have a Biotechnology in the News (BITN) page for Cloning and stem cells. It includes an extensive list of related Musings posts. It also includes sections on iPSC, which notes some of the early work, and on trans-differentiation.
Next CRISPR post: CRISPR notes (October 11, 2016).
A post about CRISPR, with a complete list of related posts: CRISPR: an overview (February 15, 2015).
More histones: What's the connection: histones and copper ions? (August 15, 2020).
How a spider can help you do better microscopy
September 9, 2016
Let's jump in and look at a result...
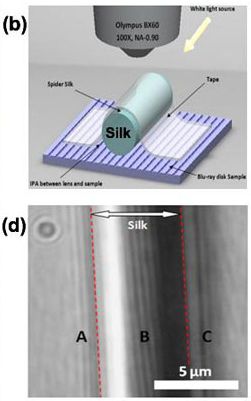
|
The top frame (part b) shows an experimental set-up; the bottom frame (d) shows the result.
(b) shows a striped object, which is a Blu-Ray disk. The disk has lines 100 nanometers wide; they are 200 nm apart. There is a cylinder of silk taped onto the disk. The disk+silk is observed with a microscope -- an ordinary light microscope.
(d) shows the microscope image. Region B, between the red dashed lines, is where the silk cylinder is. The lines on the disk are clear. To the sides, where the silk is absent, the lines are not visible. (Things are more complicated. There are some lines outside region b, but they can be shown to be artifacts. This issue is discussed, but not fully demonstrated, in the article.)
This figure is from the news story listed below. It probably corresponds to Figures 1b and 2d from the article. The labeling is hard to read in the originals. I think I have described the key things above.
|
What's this all about? It is about the limits of microscopy -- and how to do better.
It's long been known that the resolution of an ordinary microscope is limited to (approximately) half a wavelength. The limitation, often called the Abbe limit or the diffraction limit, comes from the way light waves form images. For the current work, that limit is about 300 nm.
We would love to do better. Electron microscopy is one way, by using a shorter wavelength, but that comes with its own problems. Can we do better using ordinary light? In fact, various technical developments do allow one to do better. A recent Nobel Prize was for super-resolution microscopy, which bypasses ordinary image formation and does much better, but with its own costs.
The current article shows a way to beat the diffraction limit by a factor of about 3 -- and it is simple. Previous work from this lab had established the usefulness of having an additional lens in the system; they call it a superlens. What's new here is how simple this superlens might be -- in this case, a little roll of silk collected from a spider. The figure above shows the result.
This is at least a fun story. Is it useful? We'll see. The idea of a superlens seems well validated. The original superlenses were difficult to make. Spider silk may offer a simple (and natural) alternative.
News story: Using spider-silk as a superlens to increase a microscope's potential. (Nanowerk, August 19, 2016.)
The article: Spider Silk: Mother Nature's Bio-Superlens. (J N Monks, Nano Letters 16:5842, September 14, 2016.)
An example of making a small improvement in the resolution of light microscopy... Expansion microscopy: making an object bigger can make it easier to see (February 23, 2015). Includes a link to the recent Nobel Prize for super-res microscopy.
Posts about spider silk include... Spiders and violins (May 4, 2012).
More about lenses.. Chromatic aberration: is it how cephalopods see color with only one kind of photoreceptor? (October 14, 2016).
There is a section of my page Internet resources: Biology - Miscellaneous on Microscopy. It includes a list of related Musings posts.
Next spider post: The spider with the mostest ... (and such) (January 2, 2018).
September 7, 2016
Which is older, the center of the Earth or the surface?
September 7, 2016
For simplicity, assume that they formed at the same time. And assume that nothing has changed... no erosion or accumulation, or such. It's not a geology question. It is just about the passage of time. Does time pass faster or slower at the center of the Earth, compared to the surface?
If you're scratching your head... Think about how Albert Einstein would have approached the question.
It's all about gravity, which distorts space-time -- and slows down clocks.
A new article explains that the center of the Earth is younger; after all, there is more mass down there. The authors estimate that the center is younger by about 2.5 years. That is, in the 4.5 billion years since the Earth was formed, 2.5 years less time has passed at the center.
The calculation is interesting. One point of the article is to correct an apparent miscalculation by the famous physicist Richard Feynman. Feynman noted the effect many years ago, and estimated that the difference was about 2 days. That estimate has been oft-quoted, including by the lead author of the current article -- who finally decided to check the calculation. He gets a different result. The author discusses the discrepancy, as an example of an error that gets propagated by casual re-telling -- without checking.
It's an article worth browsing for fun.
A little more...
* A similar calculation for the Sun gives a difference of about 40,000 years.
* Calculations are done both assuming a homogeneous body and with a simple but realistic model of density vs depth. For both Earth and Sun, the latter calculation gives a greater age difference, because the mass is more concentrated near the center. The age differences given above are for that case.
* Radioactive decay obeys the true Einsteinian clock. Radioactive elements decay more slowly at the center of the Earth than on the surface.
News story: New calculations show Earth's core is much younger than thought. (B Yirka, Phys.org, May 26, 2016.)
The article: The young centre of the Earth. (U I Uggerhøj et al, European Journal of Physics 37:035602, May 2016.) Check Google Scholar for a preprint at ArXiv.
More about Einstein's space-time and gravity...
* Atomic clock measurements of the difference in gravity over one millimeter (May 4, 2022).
* Gravitational waves (February 16, 2016).
* A galaxy far, far away: the story of MACS 1149-JD (October 12, 2012).
More about our "ordinary" view of gravity...
* Regional changes in sea level: evidence from gravity measurements (February 26, 2016).
* Does anyone know how strong gravity is? (September 16, 2014).
More about the Earth core: How much hydrogen is in the Earth's core? (May 22, 2021).
Tasmanian devils: Are they developing resistance to the contagious cancer?
September 6, 2016
Briefly noted...
Tasmanian devils have been devastated by a transmissible cancer, known as devil facial tumor disease (DFTD). The overall population decline is about 80% in recent years, with some populations faring much worse.
However, the decline has perhaps not been as much as predicted -- and that may be interesting. Is it possible that, under the strong selection pressure of a rampant fatal disease, resistance in developing?
A new article suggests just that. The evidence is preliminary, but it is a start.
What is the evidence? The authors did genome analysis of survivors in three populations of Tasmanian devils, all of which have suffered major declines. They found certain genetic variations that were more frequent in all three groups of survivors (than in the original populations). Most of these variations involved genes related to immune system function or to cancer.
There is no direct evidence that the variations are responsible for resistance, and it is not clear what they are doing. For now, it's just a clue... There are more survivors than we expected, and here are some of their features. Maybe some of these are actually responsible for the survival, and are being selected for.
If the observed variations are indeed leading to tumor resistance, it suggests that Nature is dealing with the devil tumor. Beyond that... Can we learn how the resistance works? Can we make use of that knowledge?
News story: Tasmanian devils evolve to resist deadly cancer. (Phys.org, August 30, 2016.)
The article, which is freely available: Rapid evolutionary response to a transmissible cancer in Tasmanian devils. (B Epstein et al, Nature Communications 7:12684, August 30, 2016.)
First Musings post about the transmissible tumor of the Tasmanian devil: The devil has cancer -- and it is contagious (June 6, 2011). Includes pictures.
More... Immunization of devils: a treatment for a transmissible cancer? (April 24, 2017).
Most recent post on transmissible cancer: Is clam cancer contagious? Follow-up (July 2, 2016).
My page for Biotechnology in the News (BITN) -- Other topics includes a section on Cancer. It includes a list of related posts.
Sharing resources: How to get a bird to help you find honey
September 4, 2016
Here's how: Audio S1 (20 seconds). From the Supplementary materials posted with the article.
Here's the plan... Man (a honey hunter) calls bird (a honey guide, Indicator indicator). Bird flies to bee nest. Man harvests the honey, which the bird helped him find. Bird feasts on the wax honeycomb, now free of bees thanks to the man cleaning it out. You can see that both partners benefit.
The audio above includes both the call of the hunter to the birds and the chatter of the birds, which seems to reflect their interest. Both sounds continue during the quest.
How active is the bird's role in this interaction?
Here are the results from one experiment to see how man and bird interact...
|
The y-axis shows the percentage of tests that yielded honey. (It's actually more complicated than that, but that simple version will suffice.)
Three conditions are tested, using recorded sounds. One is with the sound given above -- the honey-hunting sound. The other two are different: one is another vocalization by the hunter, and one in a sound from another bird.
You can see that the success rate is much higher -- about three times higher -- with the honey-hunting sound than with the control sounds.
This is Figure 2B from the article.
|
The results suggest that the bird is responding to a specific human signal. Note that one of the control sounds is another sound from the humans. The difference shows that the bird is not just responding in some general way to the presence of humans, or even to them vocalizing. In some sense, man and bird are deliberately cooperating.
How do the birds learn the signal? The scientists don't know. The birds don't learn from their parents; as with cuckoos, these birds are not raised by their parents. The response to a specific sound can't be innate, since it is different in different regions. The authors are left suggesting that the birds learn what the signal is by watching other honeyguides. Perhaps that is a testable hypothesis, and can be the subject of further work.
The general nature of the man-bird interaction has long been known. In fact, a missionary in Mozambique, perhaps not far from where the current work was done, reported on a related unusual behavior of the birds back in the 16th century. Think about it... What do you think a missionary might have noticed? An answer is at the end of this post. (Did I mention that the finding came from a missionary?)
As noted, the y-axis scale above is not the raw results for success. It is based on a more complex analysis that predicts the success based on variables including time of day. Qualitatively, the y-axis above reflects the main observation.
It's an interesting bit of Nature, what seems to be a true cooperation between man and wild bird. And we only partially understand it.
News stories:
* Come here, honey! -- Wild birds learn to recognize when humans ask for help finding honey -- A strange cooperation between humans and a wild bird. (J Timmer, Ars Technica, July 22, 2016.)
* Wild birds 'come when called' to help hunt honey. (J Webb, BBC, July 21, 2016.)
* News story accompanying the article: Animal behavior: Wild bird comes when honey hunters call for help -- Honeyguides understand specific human signal. (E Pennisi et al, Science 353:335, July 22, 2016.)
* The article: Reciprocal signaling in honeyguide-human mutualism. (C N Spottiswoode et al, Science 353:387, July 22, 2016.)
More about honey... Should bees eat honey? (July 12, 2013).
More about beeswax... Bee history (February 13, 2016).
A recent post on birds... Bird brains -- better than mammalian brains? (June 24, 2016).
Another example of cooperation between two animal species: If a fish doesn't cooperate, is it ok to hit it? (November 20, 2024).
Answer to question posed above... The birds came into church, and ate the candles. The missionary also noted that the birds guided men to bee nests, and then ate the honeycomb. That 16th century description was quite good.
Eye analysis: a 400-year-old shark
September 3, 2016
The Greenland shark, Somniosus microcephalus, is an enigmatic creature of the arctic seas. Adults may be huge, as long as 5 meters (16 feet). However, they grow very slowly, probably less than a centimeter per year. That would imply that the animals grow very old -- far older than common for vertebrates.
A new article brings an interesting line of evidence to bear on the question.
It ends up as a complex story, so let's start with "the bottom line" from the article...
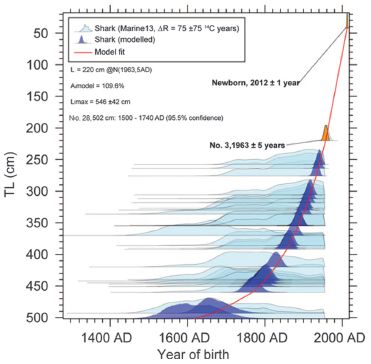
|
The graph shows the total length (TL; y-axis) of a shark vs year of its birth (x-axis). Length is measured -- for 28 females. Birth year is estimated; that's the purpose here.
Look at the red line. It is for the model the scientists developed, to let them estimate the year of birth from the measured length.
At the upper right... The smallest shark, about 50 cm, is estimated to be born in 2012.
At the bottom... The largest shark they measured is about 500 cm. The red line suggests it was born shortly after 1600. Their actual calculation is that this shark, 502 cm long, is 392 +/- 120 years old. That's for their reference year of 2012, thus making the estimated birth year 1620.
This is Figure 3 from the article.
|
One contribution to the scientists' model is particularly interesting: they estimated the age of the eye lens by C-14 dating. In vertebrates, the crystalline eye lens is laid down during early development, and does not renew. Thus, the C-14 content now found in the eye lens protein reflects the original C-14 level from the time of birth, followed by the predictable decay since then. There are many technical issues that make C-14 dating difficult in practice, and it isn't really too sensitive over the time period here. But it was a novel and useful contribution to the model.
In addition to the red line, the graph shows various broad regions, with various shades of blue, for each shark. These are something like error bars, showing a distribution for an age estimate, using one or another approach. Note that the specific value for an age quoted above was given with a large uncertainty (392 +/- 120). The red line gives a simplified view.
With their model, the scientists estimate something else that has been unknown about these sharks: how long does it take to develop to sexual maturity? There have been estimates that females are mature only after reaching about 400 cm length. From the model, the scientists estimate that this corresponds to a minimum age of about 156 years. That is, no female of this species born in the 20th century is old enough to reproduce. That result has an important implication: these animals are not quickly evolving. They are not likely to adapt well to changing conditions.
This is a complex article, with large uncertainties. Nevertheless, it offers some interesting ideas, both of methodology and of biology. Greenland sharks are slow giants. You can tell from their eyes.
News stories:
* The eyes have it -- Radiocarbon dating finds a Greenland shark that could be 400 years old. (S Saxena, Ars Technica, August 12, 2016.)
* Greenland shark is longest lived vertebrate in the world. (J Urquhart, Chemistry World, August 16, 2016.)
The article: Eye lens radiocarbon reveals centuries of longevity in the Greenland shark (Somniosus microcephalus). (J Nielsen et al, Science 353:702, August 12, 2016.) Check Google Scholar for a copy from the authors.
Previous post about sharks... Cuttlefish vs shark: the role of bioelectric crypsis (May 10, 2016).
More...
* Added November 12, 2025.
Great white sharks: a genetic mystery (November 12, 2025).
* Anne's journey across the Pacific (July 6, 2018).
Another post on C-14 dating... Atomic bombs and elephant poaching (October 25, 2013). The effect of bomb testing on C-14 levels is also an issue in the current post. The bomb-spike is quite clear in the records of the sharks, and helps to anchor the calibration.
More from the Arctic: Methane hydrate: a model for pingo eruption (August 4, 2017).
My page of Introductory Chemistry Internet resources includes a section on Nucleosynthesis; astrochemistry; nuclear energy; radioactivity. It includes a list of related Musings posts, including posts on dating.
Top of page
The main page for current items is Musings.
The first archive page is Musings Archive.
E-mail announcements -- information and sign-up: e-mail announcements. The list is being used only occasionally.
Contact information
Site home page
Last update: July 14, 2026