Home
> Musings: Main
> Archive
> Archive for January-April 2015 (this page)
| Introduction
| e-mail announcements
| Contact
Musings: January-April 2015 (archive)
Musings is an informal newsletter mainly highlighting recent science. It is intended as both fun and instructive. Items are posted a few times each week. See the Introduction, listed below, for more information.
If you got here from a search engine... Do a simple text search of this page to find your topic. Searches for a single word (or root) are most likely to work.
Introduction (separate page).
This page:
2015 (January-April)
April 29
April 22
April 15
April 8
April 1
March 25
March 18
March 11
March 4
February 25
February 18
February 11
February 4
January 28
January 21
January 14
January 7
Also see the complete listing of Musings pages, immediately below.
All pages:
Most recent posts
2026
2025
2024
2023:
January-April
May-December
2022:
January-April
May-August
September-December
2021:
January-April
May-August
September-December
2020:
January-April
May-August
September-December
2019:
January-April
May-August
September-December
2018:
January-April
May-August
September-December
2017:
January-April
May-August
September-December
2016:
January-April
May-August
September-December
2015:
January-April: this page, see detail above
May-August
September-December
2014:
January-April
May-August
September-December
2013:
January-April
May-August
September-December
2012:
January-April
May-August
September-December
2011:
January-April
May-August
September-December
2010:
January-June
July-December
2009
2008
Links to external sites will open in a new window.
Archive items may be edited, to condense them a bit or to update links. Some links may require a subscription for full access, but I try to provide at least one useful open source for most items.
Please let me know of any broken links you find -- on my Musings pages or any of my regular web pages. Personal reports are often the first way I find out about such a problem.
April 29, 2015
Fallout from the Ebola outbreak: more measles?
April 28, 2015
Briefly noted...
A new article puts some numbers on a point that many have thought about... The Ebola outbreak in West Africa will have consequences well beyond the immediate toll. The Ebola outbreak has devastated the economies of the affected countries; more specifically, it has devastated the health care systems.
The specific issue that the article addresses... Because of the Ebola outbreak, people are not getting their measles vaccinations. Measles is active in the region, and is highly infectious. The fatality rate is low in the developed world, but it is much higher among the malnourished. Modeling suggests that the increase in the number of measles deaths in the next two years could be as high as the number of Ebola deaths in the outbreak.
There is a point beyond the predictions... The authors suggest that a rapid major response be instituted as soon as possible. This would include a major campaign to get people caught up on their measles vaccinations. Of course, that should be part of a larger program to rebuild the affected countries, including their health care systems.
Articles about modeling of infectious diseases are probably not easy reading. In fact, the article has many assumptions, leading to considerable uncertainty in the predicted numbers. Nevertheless, the point comes across powerfully: the toll of the Ebola outbreak will continue well past the last Ebola case.
I encourage you to look over the news story listed below.
News story: Ebola now, measles next? (Center for Infectious Disease Dynamics, The Pennsylvania State University, undated.)
The item was originally undated. It now bears a posting date, in 2018. That makes no sense, since it explicitly refers to the 2015 article discussed here. The date shown is probably some kind of re-posting date.
From one of the institutions involved in the work. A useful short overview.
* News story accompanying the article: Infectious diseases: As Ebola fades, a new threat -- With health services devastated in the wake of Ebola, experts are bracing for a deadly measles outbreak in West Africa. (L Roberts, Science 347:1189, March 13, 2015.)
* The article: Reduced vaccination and the risk of measles and other childhood infections post-Ebola. (S Takahashi et al, Science 347:1240, March 13, 2015.)
* Recent post on Ebola: The tree where the West Africa Ebola outbreak began? (January 12, 2015).
* Next: An Ebola vaccine: 100% effective? (August 7, 2015).
More on measles:
* The measles vaccine: What does it protect against? (June 6, 2015).
* What if Mickey Mouse got measles? (January 27, 2015).
There are sections of my page Biotechnology in the News (BITN) -- Other topics on Ebola and Marburg and on Measles. They list related posts.
How to fly a beetle
April 27, 2015
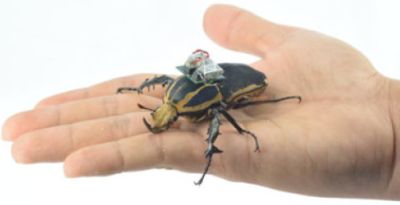
If you're going to fly a beetle, one thing you need to learn is how to steer it.
There is a particular muscle that was thought to be involved in folding of the wings. Its role in steering during flight was uncertain. To test that, the scientists took control of that muscle, with artificial stimulation.
The figure shows a beetle -- and gives you an idea of the size. It has a control box on its back. The scientists send signals to the control box by wireless; the control box connects to individual muscles.
The animal is a giant flower beetle, Mecynorrhina torquata.
The "backpack" is about 15% of the weight of the animal. (That would be like a 150 pound person carrying a 25 pound pack.)
This figure is from the Science Daily news story.
|
|
Now, watch... Movie S1. (40 seconds. Sound -- but no narration.) You can play through it once, but to understand it you will need to stop it and read the explanatory panels. (This is one of three movies accompanying the article. This one is at YouTube.)
It is important to understand that these are live beetles flying under their own power. They are being sent signals about how to fly. In this case, a tone leads to a signal to the wing muscle, and that causes the beetle to turn in flight. Two tones are used, one for each side of the animal, leading to right and left turns.
Further, since the signals are sent over the air, the beetles can fly untethered; this contrasts with much previous work, which required a direct connection.
The result here shows that stimulation of a particular muscle leads to turning. This shows the role of that muscle in steering; it is also useful.
This is part of a project that has been ongoing for several years in learning how to control beetle flight. One might think of this as some basic biology; the article contains several types of experiments on the role of this muscle in flight, and discusses how beetle flight compares with that of other insects. Beyond that basic biology, the scientists also note that human-controlled beetles could be useful devices for exploring difficult areas. Why fly a beetle instead of a drone? The beetle knows how to fly; one sends signals only when needed for "special events", such as turns desired by the human "pilot".
News stories:
* Fancy A Remote Controlled Beetle To Do Your Bidding? (Asian Scientist, March 25, 2015.)
* Cyborg beetle research allows free-flight study of insects. (Science Daily, March 16, 2015.)
The article: Deciphering the Role of a Coleopteran Steering Muscle via Free Flight Stimulation. (H Sato et al, Current Biology 25:798, March 16, 2015.)
The work is a collaboration between Nanyang Technological University in Singapore and University of California Berkeley -- and more. The lead person from UCB is Michel Maharbiz, of the Department of Electrical Engineering and Computer Science.
In seminars, Maharbiz passes around a variety of beetle specimens. But he does not do flight testing in the seminar.
Previous post about beetles: Dung beetles follow the Milky Way (February 24, 2013).
More...
* How to preserve dead mice so they stay fresh and edible (January 18, 2019).
* Polystyrene foam for dinner? (October 19, 2015).
More about flying...
* An ion-drive engine for an airplane? (February 15, 2019).
* What is the proper shape for an egg? (September 18, 2017).
* Progress toward an artificial fly (December 6, 2013).
Also see... Bomb-sniffing grasshoppers? (November 8, 2020).
A book about flying is listed on my page Books: Suggestions for general science reading. Alexander, On the Wing -- Insects, pterosaurs, birds, bats and the evolution of animal flight (2015).
The authors acknowledge the help of the Berkeley Sensor and Actuator Center, a center that has been noted in Musings before, such as... A box that will fold up upon command -- heat- or light-actuated switches (September 3, 2011).
There is Mozart in the air -- encoded in orbital angular momentum
April 25, 2015
The following figure shows what happened in a recent experiment in data transmission.

|
The image on the left ("original") was sent; the image on the right ("received") was recorded by an observer, three kilometers away.
This is part of Figure 3B from the article. Check the article, and you will also see Ludwig Boltzmann there.
|
What's the deal? The image was sent out encoded in a laser beam. More specifically, it was encoded in the angular momentum of the photons in the laser beam, loosely, how the light beam is twisted. The signal was sent through open air -- turbulent air -- but in good enough form that the receiver could decode it and reasonably reconstruct the original image. (Hm... Does it seem that he looks happier in the "received" image?)
Encoding information in light is not new. Encoding information in the angular momentum of the light is not new. What's new here is sending the encoded light through the open air, even turbulent air, rather than through an optical fiber. Development of software to analyze the degraded signal that was received was a key part of the work. The method has the potential to allow high speed and secure data transmission without a physical connection. The current work is a first step.
News story: Twisted light waves sent across Vienna. (Science Daily, November 11, 2014.) The photo at the top of this news story shows a laser beam "across the rooftops of Vienna". This is probably related to the top part of Figure 1 from the article; some version is in most news stories about this work. An enlarged version is available here. Unfortunately, the figure is not labeled. Note that the laser beam is essentially horizontal, across the rooftops, not aimed up into the air.
Video. It's labeled as a video abstract. (YouTube, 3 minutes.) Nice overview of the work, with examples of how the data is sent, received, and analyzed.
The article, which is freely available: Communication with spatially modulated light through turbulent air across Vienna. (M Krenn et al, New Journal of Physics 16:113028, November 11, 2014.)
More Mozart:
* Treating epilepsy with Mozart (December 4, 2021).
* Lux aeterna: Mushrooms; Mozart (December 7, 2009)
More about data transmission... Impact of watching movies on global warming (September 30, 2014).
More about analyzing angular momentum... Chile earthquake caused the day to become shorter (March 8, 2010).
Astronomers identify source of peryton signals received by radio telescopes: it is the microwave oven in the observatory kitchen
April 24, 2015
Astronomers observe the sky with a wide range of instruments. not just the familiar optical telescopes. The first clue of a discovery is typically seeing a signal; the job is then to figure out what the signal means.
Two types of novel signals seen with radio telescopes in recent years are perytons and fast radio bursts (FRB). Both of these involve short bursts of microwave radiation.
The following graph offers a clue about the source of the peryton signals.
|
The graph shows the number of signals received vs time of day, for the two types of signal. The pink bars are for peryton signals. The blue bars are for FRB signals.
The key observation is that the peryton signal occurs mainly at lunch time.
This is from the Astrobites news story. I have added the labels on the graph identifying the bars. Figure 4 in the article presents a similar set of peryton data.
|
You can guess where this is going. The story is well told by both of the news stories listed below. They are both fun. Fun, but still some good science. Tracking down the source of a strange signal is part of science; the new work even includes some good experiments.
What about the FRB -- the other signal shown above? Astronomers still have no idea what these are. The FRB do seem to be coming from outer space, and they aren't clustered at lunch time. Beyond that, we'll just have to wait and see.
News stories:
* The Cosmic Microwave Oven Background. (D Wilson, Astrobites, April 14, 2015.)
* Rogue Microwave Ovens Are the Culprits Behind Mysterious Radio Signals. (N Drake, No Place Like Home, National Geographic, April 10, 2015.) Now archived.
The article: Identifying the source of perytons at the Parkes radio telescope. (E Petroff et al, Monthly Notices of the Royal Astronomical Society 451:3933, August 21, 2015.) A preprint is freely available at ArXiv.
Previous post about lunch: Farming by amoebae (February 15, 2011).
Also see...
* 3D printing: Make yourself a model of the universe (December 19, 2016).
* Measuring the level of a non-existent hormone (April 10, 2015).
April 22, 2015
Is clam cancer contagious?
April 21, 2015
Clams at various sites along the Atlantic coast of North America have leukemia -- the same leukemia. So reports a new article.
The basic evidence is straightforward: genetic analysis of cancer cells from clams at the various sites shows that all the cancer cells are very similar -- and they do not match the cells of the host. This would seem to imply that cancer cells are being transferred from one clam to another.
Few examples of direct transmission of cancer from one animal to another are known. Musings has noted the transmissible facial tumor of Tasmanian devils, which is probably transmitted by the biting that is common in those animals [links at the end]. A transmissible cancer of dogs is thought to be transmitted by sexual contact. But how do clams, which are attached to their home site, transmit cells from one to another? That is not known. In fact, direct transmission has not been shown in the wild, only inferred from the genetic analysis reported in the new work.
It's an interesting story -- and clearly incomplete. The article is primarily about the genetic analysis, but it is most interesting for the questions it raises about the transmission of the cancer. We'll skip the details of the data here.
News stories:
* Clam Cancer Rips Along Atlantic Coast -- A leukemia that's killing far-flung populations of softshell clams may be contagious. (J Madhusoodanan, The Scientist, April 9, 2015.) Now archived.
* In the sea, a deadly form of leukemia is catching. (Phys.org, April 9, 2015.)
The article: Horizontal Transmission of Clonal Cancer Cells Causes Leukemia in Soft-Shell Clams. (M J Metzger et al, Cell 161:255, April 9, 2015.)
Contagious -- virus vs cell? There is some potential confusion here. The materials for this post raise the question of whether a virus might be involved in this cancer. If so, would that negate the story that the cancer is directly contagious? Probably not. Those are distinct issues. If there is an infectious virus behind this cancer, then, yes, that could be a reason for the cancer being contagious. But the key evidence in the new article is that the cancers in different animals, even at different geographical locations, are genetically similar. That suggests that the cancer cells themselves are being transferred; a simple virus story would not account for the new genetic results.
Follow-up: Is clam cancer contagious? Follow-up (July 2, 2016).
Background posts about the transmissible tumor of the Tasmanian devil:
* The devil has cancer -- and it is contagious (June 6, 2011). Includes pictures.
* Why the facial tumor of the Tasmanian devil is transmissible: a new clue (April 5, 2013).
More... Immunization of devils: a treatment for a transmissible cancer? (April 24, 2017).
Also see: Could a tapeworm with cancer transmit the cancer to its human host? (November 16, 2015).
More leukemia... Why some viruses may be less virulent in women (March 1, 2017).
My page for Biotechnology in the News (BITN) -- Other topics includes a section on Cancer.
Other posts about mollusks include:
* Why don't your arms get entangled or stuck together? (June 10, 2014).
* Deceiving a rival male (August 28, 2012).
* The hydrogen economy -- in the mid-Atlantic (August 30, 2011). Bivalves.
The explosive reaction of sodium metal with water
April 20, 2015
Many have seen this reaction; it's fun, even spectacular...
Na (s) + H2O (l) --> H2 (g) + NaOH (aq).
The reaction is fast -- often explosively fast. There may be a little fire. (We're talking lab scale here... a pea-size piece of sodium and a small beaker of water.) That's the H2 burning -- ignited by the heat produced from the reaction.
Why is the reaction so fast? That hasn't been clear. One might even expect that the gas production would slow the reaction, by forming a protective layer on the metal surface.
In a new article, a team of scientists reports taking high speed video of the reaction. They discover new details about what happens.
Here are some images from the videos...
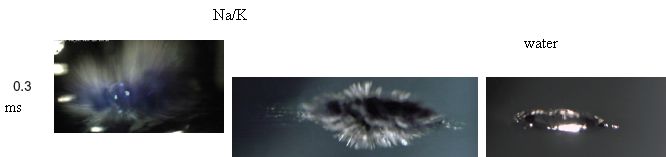
The first two columns show frames from videos made after dropping a small piece of metal containing both sodium and potassium (Na/K) into water. (The reactions of the two metals are similar. They use the mixture here because it is a liquid alloy, which can be delivered as a liquid droplet. This is part of how they developed a reproducible system for running the reaction.) The two Na/K columns show pictures taken from different angles.
The third (right-hand) column is a "control"; a drop of water was dropped into the water.
The left-hand frame was taken 0.3 milliseconds after the start; the others at about 0.35 ms.
First compare the water control with what happened when the reactive metals were dropped. You can see that a lot is happening with the Na/K.
Two features are of special note for the reaction. One is the blue color in the left frame. This is thought to be due to electrons being released into the water from the metals. The blue color is characteristic of "solvated electrons" -- electrons in water. The other is the surface structure seen in the middle frame, in particular the presence of the spikes on the metal surface.
This is part of Figure 1 from the article. I have trimmed the figure to show only one frame from each column, and I have added the labels. I have not made any changes to the pictures themselves.
|
The video... Supplementary video S1. (1 minute; no sound, but reasonably well labeled.) This movie file shows various sequences from the reactions that were sampled in the figure above. It should be freely available regardless of your access to the article itself. (You may note that this is movie S1, but the file name includes s2; this is a special feature of how Nature does things.)
A caution about understanding what they did... The key technical advance was that they made the high speed video, thus allowing them to see the reaction in unprecedented detail. Of course, we can't see things that fast -- live or video. So the video is slowed down for your viewing convenience. You're seeing the detail, but you're not seeing the speed.
Upon seeing the detail in the high-speed video, the scientists offered the following interpretation of what happens... The metal expels electrons into the water on the millisecond time scale. This leaves a dense array of positive charges on the metal surface, leading to the spiked surface -- by repulsion of the charges. They call this a coulomb explosion, since it is due to charge repulsion as characterized by Coulomb's law. The spiking leads to a huge increase in the surface area of the metal. The increased surface area enhances the reaction. That is, it is the spiking of the positively charged surface that effectively leads to the explosive speed of the reaction. The key first event is expulsion of the electrons; this happens within a millisecond.
News story: Chemists use high speed camera to fully explain high school explosion demonstration. (B Yirka, Phys.org, January 27, 2015.) Includes the video.
The article: Coulomb explosion during the early stages of the reaction of alkali metals with water. (P E Mason et al, Nature Chemistry 7:250, March 2015.) Check Google Scholar for a copy. There are three movie files linked at the journal web site as supplementary materials. As noted, they should be freely available regardless of your access to the article. The first is the one noted above, with video footage of the reaction. The others show computer simulations of the reaction.
More about this reaction: Metallic water (August 17, 2021). From the same team of scientists (in part).
More sodium chemistry: Novel forms of sodium chloride, such as NaCl3 (January 17, 2014).
More things blue: Big blue sticks (July 19, 2019).
Designing a less toxic form of an antibiotic
April 19, 2015
A drug may have more than one effect. Sometimes, it has one effect that is good, but another that is bad. An example is the class of antibiotics known as aminoglycosides. This includes streptomycin, one of the first antibiotics to be developed. It also includes gentamicin and its close relative sisomicin. These are very useful antibiotics, but they also tend to lead to hearing loss and kidney damage.
When a drug has multiple effects, we might ask if the effects can be separated. That is, is it possible to develop a modified drug that retains the beneficial effect without the side effect or toxicity? Sometimes this is done by more or less random exploration, but sometimes it is done with some knowledge of how the drug works. Of course, it may be that it is not possible.
A new article reports development of modified forms of sisomicin that cause less hearing damage. In doing this development work, the scientists made use of what they knew about how sisomicin works, both good and bad.
Here is part of the story...
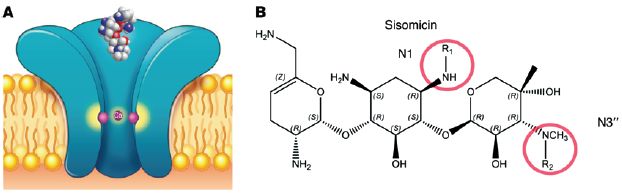
Part A (left) is a cartoon of part of a sensory hair cell of the mammalian ear; these are the cells that "hear" -- that receive sound. The big horizontal structure (orange?) is the cell membrane, with a lipid bilayer. There is a protein in the cell membrane -- the big blue thing in the middle. It has a pore (or channel) in it. (The cartoon is a cutaway; you are seeing half of the pore.)
Part B (right) shows the structure of sisomicin.
The connection?
* Sisomicin can go through that channel; that is how it enters the hair cells. It does its damage once inside the cell. In this case, sisomicin kills the hair cells, leading to hearing loss.
* The channel preferentially allows cations (chemical species with positive charge) to flow through.
* Sisomicin contains several amino groups. They are shown in the structure above as -NH2 or similar; they are the "amino" of aminoglycoside. ("Glycoside" refers to the fact that the rings are sugar-like structures.) They are shown here in their neutral form, but these amino groups are likely to carry a positive charge. Some of these amino groups are needed for sisomicin to be a useful antibiotic. However, two of them are not; they are circled.
What the scientists did was to modify those two circled amino groups so that they were less likely to become positively charged. (They were modified to be less basic: less likely to pick up a H+ ion, which is what leads to the positive charge.) The prediction is that such modified drugs might still work as antibiotics, but might kill the hair cells less because they have less positive charge and don't enter the cells as well.
In sisomicin, both R1 and R2 are H. The modified drugs have various groups at one or both of those positions.
This is Figure 1 parts A and B from the article.
|
Some results? The following figure shows how sisomicin and nine of the derivatives they made affected hair cells.
|
The y-axis shows the survival of the outer hair cells (OHC) in lab tests with various drugs. The x-axis shows positions in the cochlear structure, from bottom (base) to top (apex).
There is a lot of information here, but we can simplify it. One curve is for the control, with no drug. This gave the curve across the top (blue circles); it is 100% by definition, since the results are all given as percentages relative to the control.
|
One curve (orange circles) is for sisomicin. This is the lowest curve, with survival about 0-30%.
All the other curves are for various derivatives of sisomicin that the scientists made. All show better results than did the sisomicin itself. One is so high that its curve is superimposed on the control curve.
This is Figure 1 part G from the article.
|
The scientists also found that some of the nine were about as good as an antibiotic as the parent compound sisomicin. They chose the best candidate from the lab work for further study. They then studied it in animal tests of bacterial infection, and showed that it is an effective antibiotic, with reduced side effects. They think the new drug should be advanced to testing in humans.
Bottom line... Using their understanding of how an antibiotic works, for good and bad, scientists have modified an antibiotic to make it less toxic. It's a nice story. Is it that simple? Not really. For example, although the modified antibiotic is about as good as the parent compound, there are differences. Further work will explore the significance -- and teach us even more about how the drug works.
News stories:
* New version of common antibiotic could eliminate risk of hearing loss. (Science Daily, January 2, 2015.)
* Redesigned aminoglycoside may eliminate risk of hearing loss. (C Carr, Pharmaceutical Journal, January 5, 2015.)
The article, which may be freely available: Designer aminoglycosides prevent cochlear hair cell loss and hearing loss. (M E Huth et al, Journal of Clinical Investigation 125:583, February 2015.) Check Google Scholar for a freely available copy of a preprint from the authors.
Posts about aminoglycoside antibiotics:
* Antibiotic action: effect of hydrogen sulfide (July 9, 2021).
* Antibiotics and viruses: An example of effectiveness (May 5, 2018).
* Using viruses to make a better disinfectant (April 22, 2012)
A recent post on the development of a new antibiotic: A new antibiotic: an interesting story about the discovery and action of teixobactin (March 7, 2015).
More about membranes: How flippase works (September 25, 2015).
More about hair cells: Restoring lost hearing: lessons from the sea anemone (November 15, 2016).
More on antibiotics is on my page Biotechnology in the News (BITN) -- Other topics under Antibiotics. It includes a list of related Musings posts.
More about toxicity: Predicting the toxicity of chemicals (September 11, 2018).
The comb jelly nervous system -- more
April 17, 2015
Last summer, we noted some recent work suggesting that the nervous system of the comb jelly was rather novel [link at the end]. So novel that some investigators even suggest that it arose independently. That is, they propose that nervous systems arose twice in the animal kingdom: once leading to the comb jellies, and once leading to all other animals.
Quanta magazine has just run a nice feature story on the comb jelly nervous system and its implications. I think many would enjoy reading it as a follow-up to that earlier Musings post. And it has another beautiful picture of these unusual animals.
It's important to remember that the bottom line is, for now... we don't know. The scientists have made some bold proposals. These will help guide further work. Reading about alternative models, and about how we might distinguish them, is good. Don't confuse bold proposals with facts -- even when their proponents get excited about them.
News story, which is freely available: Did Neurons Evolve Twice? -- The comb jelly, a primitive marine creature, is forcing scientists to rethink how animals got their start. (E Singer, Quanta, March 25, 2015.)
Background post on the comb jelly nervous system: A novel nervous system? (July 20, 2014).
Previous post about an article from Quanta: CRISPR: an overview (February 15, 2015). You can sign up for e-mail announcements of new Quanta articles.
April 15, 2015
A DNA sequencing machine you can carry with you
April 14, 2015
Would you like to carry a DNA sequencing machine in your pocket -- or in your backpack along with your notebook computer?
Such a machine is under development. Here is what it looks like...

|
The figure shows two of the DNA sequencing machines, each connected to a computer. The USB cable provides power for the sequencing machine, as well as a data connection.
This is trimmed from a figure in the news story.
|
It's an interesting development, but let's be clear... it's not on the market. In fact, it doesn't work very well. That's the message from a new article testing the machine, called MinION, from Oxford Nanopore.
We have noted Oxford Nanopore before [link at the end]. Nanopore sequencing involves threading a single molecule of DNA through a tiny pore (a nanopore), and measuring the change in electrical conductivity. The four DNA bases change the conductivity differently. From the conductivity measurements, one reads off the DNA sequence.
At least, that's the idea. The problem is that the error rate is high -- about 30%. Even that is not necessarily a fatal flaw. So long as the errors are random, one can compensate for the high error rate by making many many many replicate measurements. The measurement is so easy to do that one could measure the sequence hundreds of times. The errors average out, and the sequence emerges.
In the new article, the scientists test the device with some simple examples of environmental samples, where the goal is to test for a pathogen. They show that they can find what they set out to find. However, because of the high error rate, they need to amplify the DNA before doing the sequencing. That sort of negates the simplicity and miniaturization. Nevertheless, it shows that the method works, even in its current state of development.
The company has not yet produced a commercial product. They have not met their own announced target dates. Yet the method has such great potential that there must be some optimism that they can improve the device to the point it becomes practical. Perhaps the real question is how long investors will continue to pump money into the company, based on its promise.
News story: Mobile DNA sequencer shows potential for disease surveillance. (Phys.org, March 26, 2015.)
The article, which is freely available: Bacterial and viral identification and differentiation by amplicon sequencing on the MinION nanopore sequencer. (A Kilianski et al, GigaScience 4:12, March 26, 2015.)
Excerpts from the final paragraph of the Discussion section of the article...
"To date, the MinION™ work being reported has demonstrated the enormous potential of nanopore sequencing, while also highlighting that for whole genome sequencing approaches improvements will need to be made as the technology matures. ... The methods and results presented here ... will help inform and guide the community as applications are sought for the current generation as well as for future iterations of nanopore sequencing technology."
Background post about nanopore sequencing: Nanopores -- another revolution in DNA sequencing? (June 22, 2012). Describes how the method works.
More...
* Nanopore sequencing of DNA using synthetic membranes (May 15, 2021).
* Nanopore sequencing of DNA: How is it doing? (November 13, 2017).
There is more about genomes and sequencing on my page Biotechnology in the News (BITN) - DNA and the genome. It includes an extensive list of Musings posts on the topics.
What caused the dinosaur extinction? Did volcanoes in India play a role?
April 13, 2015
A new twist in an old story. Part of the story is well known, some of it perhaps less so. The science is very technical, so I'll just try to highlight the main ideas.
Dinosaurs became extinct about 65 million years. It was rather sudden, on the geological time scale, and was part of a mass extinction. (Birds are the one part of the dinosaur lineage that survived. That's a side point here.)
What caused the extinction? Some years ago, a team of scientists discovered an unusually high amount of the element iridium at a certain geological age -- an age that closely corresponded to that of the dinosaur extinction. They proposed that the iridium was due to the impact of a huge meteorite -- an impact that produced a global catastrophe and a mass extinction. The crater that corresponds to the proposed impact was later found, near the Yucatan peninsula of Mexico.
Thus we have some rather good facts... It seems quite certain that a catastrophic impact occurred at about the time of the dinosaur extinction. But it is hard to prove how catastrophic it was or to connect it directly to the dinosaurs.
Is there some doubt? Well, yes. It turns out that there was another major natural disaster at about the same time: a massive series of volcanic eruptions in India. These eruptions left their mark in a geological system there called the Deccan Traps. When did this happen? At about the same time. How big were these eruptions? Huge -- beyond anything we know from human history. Huge enough to cause catastrophic damage around the world. But it is hard to prove how catastrophic it was or to connect it directly to the dinosaurs.
Traps? That's a geological term for a type of volcanic formation. The original literal meaning is stairs.
Volcanoes in India? It is likely that the eruptions occurred when India was over a volcanic hotspot now associated with Réunion Island.
So who did it? The meteorite or the volcanoes? How could we tell? It's really hard to know for sure how destructive either event was. One critical issue is dating the events: the extinction, the impact, and the eruptions. And therein lies a big problem. Although we all probably have some general notion of how such geological dating is done, it is actually very difficult to do. And it turns out that the dates are so close that we really need to get the dates right to know.
For some time, it has perhaps been the "conventional wisdom" that the dates of the Deccan Traps do not match the dinosaur extinction; the eruptions were too early to have caused the extinction. Further, it seemed likely to many that the eruptions were spread out over a long enough time period that the overall effect would not have been so catastrophic. (Volcanic effects involve gases, which dissipate. The effect of multiple eruptions is greater if they are closely spaced.)
A recent article reports the best dating yet of the Deccan Traps -- and says it is right on: the dates of the eruptions match the dates of the extinction. Further, the main series of eruptions were much more closely spaced than previously thought. That makes it more plausible that the effect of a series of eruptions could add up to the major catastrophe needed to cause a mass extinction.
What now? It's hard to know. As noted, this is difficult work. It's hard to say that something is the last word. Nevertheless, I sense that geologists are leaning towards calling this a draw. Two major disasters occurred, both at about the time of the extinction. The best dating we have does not establish that one or the other was more important. Perhaps they acted together, both contributing to the devastation.
Scientists will continue to study this. They will date and re-date. They will try to project what each event might have done. But perhaps the best approach for most of us, for now, is to recognize these two events as major parts of our geological history, and to accept that we do not know for sure -- and perhaps may never know -- exactly their connection to the mass extinction that took the dinosaurs 65 million years ago.
News story: New, tighter timeline confirms ancient volcanism aligned with dinosaurs' extinction. (Phys.org, December 18, 2014.) This story includes a map showing where the Deccan Traps are, and a photograph of part of the area.
* News story preceding the article: Back from the dead -- The once-moribund idea that volcanism helped kill off the dinosaurs gains new credibility. (R Stone, Science 346:1281, December 12, 2014.) Check Google Scholar for a copy. This news story highlights the role of one particular scientist, Dr Gerta Keller of Princeton. She has studied the Deccan Traps for many years, and has been the key advocate for their role in the extinction. It's a complex story of the role of an individual scientist. Perhaps it is a tale of the value of persistence. But be careful. In the long run, it is the data that win. If Gerta Keller gets a victory here, it is because she was, finally, able to provide the data to support her claim. And we do not know if this is the last word.
* The article: U-Pb geochronology of the Deccan Traps and relation to the end-Cretaceous mass extinction. (B Schoene et al, Science 347:182, January 9, 2015.)
More... What caused the extinction of the dinosaurs: Another new twist? (January 26, 2016).
Other posts about mass extinctions include:
* What caused the mass extinction 252 million years ago? Methane-producing microbes? (October 12, 2014). A volcano connection, too.
* The 6th mass extinction? (April 4, 2011).
There have been suggestions that volcanoes played a role in the demise of the Neandertals. What happened to the Neandertals? (October 8, 2010).
A post that, among other things, notes how volcanic activity can cause climate change: Why isn't the temperature rising? (September 12, 2011).
Another volcanic hotspot: Hawaii's hot spot(s) (October 9, 2011).
More about volcanoes: How frequent are volcanic eruptions that are truly catastrophic? (April 10, 2018).
Also see:
* The mystery of the first dinosaur found in the state of Washington (June 12, 2015).
* How the birds survived the extinction of the dinosaurs (June 6, 2014).
Turning lignin into a useful product
April 11, 2015
Processing natural cellulosic materials as a source of renewable energy is still a problem. Making ethanol (or some other biofuel) is the common goal, but the economics are questionable. Part of the problem is the lignin that inevitably accompanies cellulose in natural plant materials; that natural combination is called lignocellulose. The lignin makes the cellulose inaccessible and itself is of little value.
A recent article offers a new approach. The scientists demonstrate a new process for removing the lignin. A key point is that the lignin is removed in a form that may well be of commercial value.
The following figure serves as a partial flowchart, with some sample results...
At the left is a sample of biomass (from a poplar tree, in this case).
The biomass is treated with hydrogen gas (H2), with a novel metal catalyst that the authors had recently developed. The catalyst contains zinc ions and metallic palladium. (C? That is the carbon support material for the catalyst.)
That treatment leads to two phases. The liquid phase contains most of the broken down lignin, as "phenolics" soluble in methanol (the process solvent). The solid phase contains most of the cellulose, which is further broken down to sugars by standard treatment. (If you look at the labels, you'll see it is a little more complicated than that, but it doesn't matter much for now.)
This is part of Figure 3 from the article.
|
What is important is that most of the lignin material is recovered as a small number of specific compounds that should have commercial value. Commonly, breaking down lignin leads to a zoo of products, making it of little value; in fact, it is common that the lignin is just burned, a low-value use. The catalyst developed here breaks a specific bond in the complex lignin structure, so that most of the lignin is recovered in a predictable form.
Vanillin is a familiar example of the type of phenolic compound made from the lignin. The process here does not make vanillin, but it makes similar compounds of value. (Vanillin is in fact made from lignin in some processes.)
There is little in the article about economics, other than the discussion of the value of the lignin products. It is the economics that determines whether such proposals ultimately succeed or fail. This is early work at the research lab level; the sample used above is about one gram. Scientists need to follow up, see how this works at a larger scale, and then begin to evaluate the economics. One issue of obvious concern is that the process as presented here uses an expensive metal (Pd) as one of the catalysts. In general, that is not good. However, the real cost of a catalyst depends on how efficiently it is used, and we don't know that yet. Further, once a process has been discovered, it is sometimes possible to find a replacement catalyst. The comment here is an example of the hurdles that must be faced, not a prediction of failure.
Many processes have been proposed for using lignocellulose. So far, none has been turned into a practical large scale economical process. It is probably the fate of most lab scale developments to ultimately fail. We don't know how this one will turn out, but it seems worth noting.
News story: Purdue process converts lignin in intact biomass to hydrocarbons for chemicals and fuels. (Green Car Congress, December 18, 2014.) Good overview.
The article: A synergistic biorefinery based on catalytic conversion of lignin prior to cellulose starting from lignocellulosic biomass. (T Parsell et al, Green Chem 17:1492, March 2015.)
The conflict of interest statement in the article (p 1498) notes that some of the authors are involved with "a start up company focused on making specialty chemicals from renewable sources."
Other examples of catalyst development...
* Upgrading ethanol? (April 11, 2016).
* A simpler way to make styrene (July 10, 2015).
More about using lignin: Progress toward making a homogeneous product from diverse lignins (May 17, 2019).
More about using biomass: Flash photo-pyrolysis: converting banana peels to useful chemicals (March 5, 2022).
There is more about energy issues on my page Internet Resources for Organic and Biochemistry under Energy resources. It includes a list of some related Musings posts; some are on use of cellulosic biomass.
Measuring the level of a non-existent hormone
April 10, 2015
Update, August 25, 2015
One theme in Musings is presenting some interesting new advances in science. Another is to discuss how science is done, typically one small step at a time.
Why that preamble? This post is about some bad news. The "advance" here is to recognize that we have made a mistake. Indeed, recognizing a mistake is an advance; it is part of science, even if, on the surface, an unpleasant one.
Exercise promotes weight loss; you know that. In recent years we have "learned" that this effect is mediated by a hormone called irisin. How does irisin work? It doesn't matter. Anymore. There is no irisin, according to a new article. (More precisely, there is no irisin with the claimed properties.)
We'll skip data and detail here, and emphasize the idea.
The key to measuring irisin is the use of antibodies. Irisin-specific antibodies, which are commercially available, can be used in a general -- and widely used -- type of test called an ELISA. It turns out that the common "irisin-specific antibodies" are not specific for irisin; they bind to "miscellaneous" proteins. Measurements purported to be of irisin are not measuring irisin. At this point, all work that has been reported on irisin is suspect. (It is possible that some of it is ok, but nothing that has been published will be accepted for now, until it is shown with proper procedures.)
How can this happen? It's actually not easy to fully characterize an antibody. It looks like scientists got sloppy here, taking shortcuts in characterizing the materials. But then people noticed, because of inconsistent results. A group of scientists, from various institutions, got together and did some definitive testing of the irisin antibodies -- and found that they did not do what was claimed. It is likely that this irisin work will lead to more careful testing of other lab materials -- and that is good.
A story such as this also reminds us that our knowledge is tentative. Over time, we find out how well an initial claim holds up.
News story: 'Exercise Hormone' Irisin Is More Myth Than Reality. (M V Broadfoot, Duke University, March 9, 2015.) News release from one of the participating institutions. It's a nice overview of the background and the current work.
The article, which is freely available: Irisin -- a myth rather than an exercise-inducible myokine. (E Albrecht et al, Scientific Reports 5:8889, March 9, 2015.)
Related... The following "Comment" article may be freely available: Standardize antibodies used in research. (A Bradbury, A Plückthun and 110 co-signatories, Nature 518:27, February 5, 2015.) A recent general discussion of the problem of characterizing antibodies.
There have been no Musings posts on irisin. (A text search of all my Musings files shows no instances of the word, except for this post.) That I have not posted on irisin is more a matter of good luck than good judgment. The developing irisin story was interesting, but also confusing. I have been aware of some controversy about the work, and I sometimes like to post about disagreements; that, too, is part of science.
The hormone irisin was said to work by affecting the use of brown fat. There are Musings posts on brown fat; I don't think that the main messages in those posts are affected by the new work (but I am not sure). One related brown fat post is noted below.
Here is a previous post on how exercise may promote brown fat. The article acknowledges the finding of irisin, and suggests that they have an alternative pathway. It will be interesting to see how this work is regarded in the light of the downfall of irisin. Why exercise is good for you, BAIBA (March 10, 2014).
More about exercise: Sparing glucose for athletic endurance (August 21, 2017).
A previous example of a claim being refuted by further work... A virus that is or is not associated with chronic fatigue syndrome (February 12, 2010). That post also links to follow-up posts on further developments. A similarity between that and the current irisin story is that scientists got together and did key testing together to resolve an issue that had come up.
For more about lipids, see the section of my page Organic/Biochemistry Internet resources on Lipids. It includes a list of related Musings posts, including about fat metabolism.
Also see: Astronomers identify source of peryton signals received by radio telescopes: it is the microwave oven in the observatory kitchen (April 24, 2015).
August 25, 2015. An important update...
A new article provides a rebuttal to the challenge against irisin. For a news story, the article, and some discussion, see the post: The denial of irisin: a rebuttal (August 25, 2015).
April 8, 2015
Using your smartphone to detect cosmic rays
April 7, 2015
It's not hard. In fact, the materials used in the camera naturally respond to cosmic rays, just as they do to light.
Look...
|
The image recorded by a smartphone camera after being struck by a muon.
The muon is not the primary cosmic ray. What happens is that the cosmic ray interacts with molecules in the air, releasing a spray of secondary particles, such as muons. The phone camera detects a particle of this secondary spray.
The numbers on the axes indicate position in the image: pixel numbers.
This is one of the examples at the DECO site listed below.
|
It's just a matter of developing some software to keep track, and then reporting what you find to interested scientists. The smartphone cosmic ray detector isn't particularly sensitive, but there are a lot of devices out there. Some scientists think that the world's smartphones, taken together, could be the best cosmic ray detector we have.
There are two labs working on this: University of Wisconsin, Madison (UWM) and University of California, Irvine (UCI -- in collaboration with UC Davis). The former is oriented to educational use (a teaching tool), while the latter is oriented to scientific application (data collection). Consistent with that, the web site for the former is perhaps more helpful to the beginner, but there is more technical detail for the latter.
The purpose of this post is to introduce the topic, and offer some web sites that have more information -- and the software that will allow you to record your cosmic ray encounters. Information about both projects is included here. You can use the comments above as a guide, but I encourage you to explore both and see what you find interesting or useful.
News story about the UCI work: Seeking the Source of Cosmic Rays. (M Lemonick, New Yorker, October 28, 2014.) Also notes the UWM project.
News story about the UWM work:
* How to turn your Android phone into a cosmic ray detector. (Kurzweil, October 7, 2014.) Includes some brief instructions.
Lab web sites, for general information, software and instructions:
* CRAYFIS. That's Cosmic Rays Found in Smartphones, from UCI. Android and iOS. Now archived.
* DECO. That's the Distributed Electronic Cosmic-ray Observatory, from the Wisconsin IceCube Particle Astrophysics Center at UWM. Android only for now; iOS planned (2015, it says).
There are two articles posted at ArXiv (where everything is freely available). Neither is well identified. I can't tell whether or not these are articles intended for publication, and if so, what stage they are at. Since I make a point of basing most Musings posts on peer-reviewed and published articles, I just caution that the status of these is uncertain.
* Recent article: Observing Ultra-High Energy Cosmic Rays with Smartphones. (D Whiteson et al, Submitted October 10, 2014.) From the UCI group. The article presents how they think the smartphone population would work in practice as a network of cosmic ray detectors. Much of the article is quite readable.
* That refers to the following background article: Using CMOS Sensors in a Cellphone for Gamma Detection and Classification. (J J Cogliati et al, January 7, 2014.) This is reference 15 of the Whiteson paper (above); it is not clearly identified there. It is a more technical discussion about the camera sensors.
More about cosmic rays...
* IceCube finds 28 neutrinos -- from beyond the solar system (June 8, 2014).
* Tree rings, carbon-14, cosmic rays, and a red crucifix (July 16, 2012).
More about muons, in a quite different context: The proton -- and a 40 attometer mystery (March 17, 2013).
And more: High-voltage thunderstorms: how high? (April 29, 2019).
This project is an example of "citizen science", where the resources of many "ordinary citizens" are mobilized as part of a scientific project. Other examples noted by Musings include:
* The quality of citizen science: the SOD Blitz (September 28, 2015).
* Identifying whale songs: You can help (January 4, 2012).
* School of Ants -- you can help (October 16, 2011).
* The Quake-Catcher Network: Using your computer to detect earthquakes (October 14, 2011).
* SETI (October 20, 2009). SETI is the pioneer among such projects, at least in terms of using computers.
More you can do with your phone:
* Can you detect the SARS-2 virus with your phone? (March 2, 2021).
* Testing for lead in drinking water: a quick and inexpensive test using a smartphone (October 20, 2018).
* Using your phone to find Loa loa (August 14, 2015).
More hand-held science: A ream of microscopes for $300? (June 22, 2014).
A book co-authored by Whiteson -- lead author of an article listed above -- is listed on my page of Books: Suggestions for general science reading. Cham & Whiteson, We Have No Idea -- A guide to the unknown universe (2017). It's an excellent book, combining humor with serious science.
A whiff of oxygen three billion years ago?
April 6, 2015
The Earth's atmosphere is about 21% oxygen. How did it get that way? The story is broadly accepted, with a fair amount of evidence... The Earth's atmosphere was originally anaerobic. Eventually, organisms that made oxygen gas as a by-product of photosynthesis appeared. In modern terms, those are the cyanobacteria and their descendants, including the chloroplasts of algae and plants. Their O2 accumulated in the atmosphere. There is good evidence that the Earth's atmosphere became aerobic around 2.4 billion years ago, a time sometimes dubbed the Great Oxidation Event -- or GOE.
Maybe so. Or maybe that is a greatly simplified view of what really happened.
A recent article reports finding some old rocks in eastern India that show signs of having been affected by atmospheric oxygen. How old? At least three billion years old -- dating back about 600 million years before the GOE.
This new finding isn't the first example of evidence for atmospheric O2 well before the apparent GOE; it does seem to be the oldest -- for now. Such findings are leading to some modification of the original simple GOE idea. The big concept of the GOE remains: oxygenic photosynthesis provided O2 to the atmosphere, long long ago. But our view of how it happened is more nuanced; it was more gradual and more local than the first clues suggested. It may well be that in some places O2 appeared, and then disappeared; perhaps whiffs of O2 appeared many times. That shouldn't be a big surprise. In the earliest days of oxygenic photosynthesis, there wasn't much of it, and chemical processes consumed the O2 about as fast as it was made. By 2.4 billion years ago, the atmosphere had broadly and stably become aerobic (though the level of O2 would fluctuate).
The emerging view, then, is that oxygenation of our atmosphere was not one big event, but occurred gradually. We should think of this as an evolved and improved view of the GOE, as we learn more. This article provides evidence for one of the first whiffs of atmospheric oxygen.
News stories:
* Life forms appeared at least 60 million years earlier than previously thought. (Science Daily, September 4, 2014.) Careful with the title. The article is about a geological finding. The title deals with a biological implication of the finding; there is no biology in the article.
* Early Oxygen. (Tikalon Blog by Dev Gualtieri, September 17, 2014.) A nice overview of the whole story of the oxygenation of the Earth's atmosphere, with the new work put in context. It includes a graph showing estimates of the level of O2 in the atmosphere over the past four billion years. Just a caution that much of this is very rough at this point; it's very much a story still in progress. We might even note that we do not know the source of the early oxygen. It is presumed to be biological, and the simple view for now is that it came from cyanobacterial photosynthesis, or perhaps some precursor. But we do not know that.
* Whiffs of Oxygen in Archean Atmosphere. (Presidency University (Kolkata), undated?) Brief announcement from the lead institution. The story refers to the rock age as "some 300 crore years". A reader explained to me that crore is part of the Indian number system, a prefix word meaning ten million. Thus, 300 crore years is 300 x 107 years, or 3x10⁹, which is 3 billion. Thanks for the help!
The article: Oxygenation of the Archean atmosphere: New paleosol constraints from eastern India. (J Mukhopadhyay et al, Geology 42:923, October 2014.) Check Google Scholar for a copy.
Other posts that note the oxygenation of the Earth's atmosphere:
* Did changes in Earth's rotation promote the rise of oxygen-evolving photosynthesis? (August 23, 2021).
* The artificial trees in the artificial forest are now fixing CO2 (and making high-value products) -- naturally (May 13, 2015).
* The oldest known multicellular organisms? (August 21, 2010).
* An unusual cyanobacterium (December 11, 2008).
A book on the topic, listed on my page of Books: Suggestions for general science reading... Canfield, Oxygen -- A four billion year history (2014).
A post with some quite speculative ideas about how oxygen-evolving photosynthesis might have developed: Photosynthesis that gave off manganese dioxide? (July 21, 2013).
More about photosynthesis:
* If an injured heart is short of oxygen, should you try photosynthesis? (June 25, 2017).
* Improving photosynthesis by better adaptation to changing light levels (February 27, 2017).
More about cyanobacteria:
* Oil in the oceans: made there by bacteria (January 3, 2016).
* Claim of oldest fossilized cells refuted (May 3, 2015).
* Engineering cyanobacteria to make high-value chemicals (September 21, 2010).
* Don't eat the bats.
or
An ALS story: Guam and New Hampshire; food chains and biomagnification; cyanobacteria, cycad trees, and flying foxes; pond scum; and BMAA.
(October 6, 2009).
What if two of the world's most destructive pests spent the evening together in Fort Lauderdale?
April 4, 2015
Worldwide, termites cause some 40 billion dollars of damage a year. Two species of subterranean termites, Coptotermes formosanus and Coptotermes gestroi, are perhaps the most important. They are commonly known as Formosan termites and Asian termites, respectively. They have spread to many areas around the world, dispersed largely by human activity.
The two species generally live in different places. Where their territories overlap, such as in southern Florida, they seem to have different breeding behaviors. These points are behind why they are considered different species.
In 2013, scientists at the University of Florida Institute of Food and Agricultural Sciences, in Fort Lauderdale, noted that both of these termite species were out doing mating flights on the same nights. In 2014, they followed up with careful observations, and confirmed the finding: on many nights, the two species were out together. What does this mean? Could the two species interbreed? If so, what would be the consequences?
To pursue these questions, the scientists did laboratory tests with these termites. The results are of concern. The species do interbreed, at least in the lab.
The following figure shows one key result...
The figure shows the observed populations after four types of crosses.
The four types of crosses are all combinations of the males and females of the two species. The first two bars are for crosses between the species; the final two bars are for crosses within a species ("normal").
The length of each bar shows the average size of the populations from that type of cross, after one year. It is fine to look just at the total bar length.
The main observation is that the first two bars are longer -- about twice as long. That is, crosses between species are leading to larger populations than the traditional crosses within a species. This is an example of hybrid vigor.
The segments of the bars are for different parts of the populations, such as workers, as shown in the key at the lower left. Looking at the segments extends the general picture: the hybrids have more of most everything.
The letters at the right end of each bar indicate groups that are statistically different. That is, the "a" bars are statistically different from the "b" bars, but similar to each other.
Just to be clear... The results here show what happened for each type of cross, carried out under controlled conditions. There is nothing here about how often each type would happen.
This is Figure 5 from the article.
|
These results suggest that interbreeding of these two termite species could lead to increased population size. That might lead to increased damage.
There are limitations to the study. The crosses were done entirely under lab conditions. Do these species interbreed "in the wild"? We don't know. Yet. It's important to find out. We also don't know if the hybrids are fertile. (It will take about five years to find out.) If they are, that opens up further questions.
There are some other observations, which support the potential for hybridization. Field observations during the mating flight events showed that inter-specific pairings occurred, though there is no information on the consequences. In the lab, the scientists did observe that the males of one of the species actually prefer females of the other, if given a choice (Figure 3C). Further, the rate of successful mating and colony formation in the lab seemed about the same for all combinations. These various observations suggest there is little barrier to hybridization, though key information is not yet available.
The article starts with a simple observation: the two kinds of termites are now out together. That leads to questions, which the scientists have begun to test under lab conditions. The results suggest that the system is of concern and needs further study.
News stories:
* Two most destructive termite species forming superswarms in South Florida. (Science Daily, March 25, 2015.)
* Florida Scientists Discover Super Termites, and They're Not Genetically Modified. (R Levine, Entomology Today, March 25, 2015.)
The article, which is freely available: Hybridization of Two Major Termite Invaders as a Consequence of Human Activity. (T Chouvenc et al, PLoS ONE 10(3):e0120745, March 25, 2015.)
Previous posts about termites include:
* Prospecting for gold -- with help from the little ones (March 1, 2013).
* Tracking termites (February 26, 2010).
More Florida hybrids: Grapefruit and medicine (March 26, 2012).
More hybrids: Hybrid formation between organisms that diverged 60 million years ago (May 8, 2015).
More from Florida... Coral history: evidence from old maps (December 12, 2017).
More about the nature of species: Making a new species in the lab (July 26, 2015).
Chikungunya in the Americas, 1827 -- and the dengue confusion
April 3, 2015
A recent post was about the current outbreak of chikungunya in the Americas; it connected to a new article on vaccine development [link at the end].
A new article has just appeared with some interesting discussion of the history of chikungunya and dengue. It is primarily on their history in the Americas, with an emphasis on the chikungunya outbreak of 1827-8 in the Caribbean, spreading into the US. Sound familiar?
Why an article on chikungunya and dengue together? Well, there are some similarities in the diseases, especially in the early stages. But the important connection is that, back then, chikungunya was called dengue. The article is an overview of the two diseases, including their early occurrence in the US, with an emphasis on sorting them out. The result is a short little article with some fascinating history. The extensive reference list is rich in 19th century articles, and goes back to a 1780 article in Dutch ("archaic Dutch", he notes) and a 1789 article by the famous American physician Benjamin Rush. Those two 18th century articles are probably the earliest descriptions of what we now call chikungunya and dengue, respectively.
The article, which is freely available: Reappearance of Chikungunya, Formerly Called Dengue, in the Americas. (S B Halstead, Emerging Infectious Diseases (EID) 21:557, April 2015.)
Background post about chikungunya: Chikungunya in the Americas -- are vaccines near? (March 17, 2015).
Recent post about dengue: Dengue vaccine follow-up: Phase 3 trial (September 15, 2014).
Previous history post... Pi (November 10, 2014).
Previous post about medical history... On a new method of treating compound fracture... (July 11, 2012).
More from the Caribbean: Is photosynthesis the ultimate source of primary production in the food chain? (April 2, 2017).
My page Internet resources: Biology - Miscellaneous contains a section on Medicine: history.
My page for Biotechnology in the News (BITN) -- Other topics includes a section on Emerging diseases (general). It includes a list of related Musings posts.
April 1, 2015
Disease outbreaks: Trends and perspective
March 31, 2015
Outbreaks. We keep hearing about them. Old diseases and new. Some of them appear in Musings.
A new article provides some perspective on the frequency and nature of outbreaks. The following figure summarizes the findings.
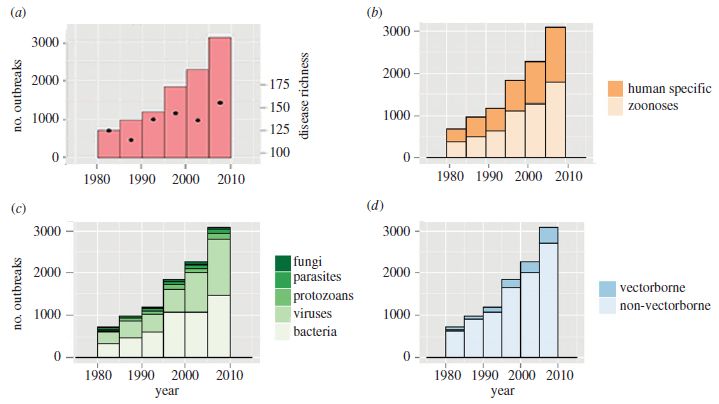
The four frames are very similar. All plot the number of disease outbreaks over time, for the past 30 years. Each bar is for a five-year period. The difference is that the bars are broken up in different ways, to provide different information.
Part a is the basics: the bars show the number of outbreaks. Part a has one additional piece of information. The black dots show the number of different diseases; use the scale on the right. For example, for the most recent period, there were just over 3000 outbreaks, involving about 150 diseases.
Part b shows the same totals, but now divides the outbreaks into two types: human-specific diseases, and zoonoses. The latter are diseases transmitted from animals. Polio and measles would be examples of human-specific diseases, Ebola an example of a zoonosis.
Part c subdivides the diseases by the type of infectious agent. Bacteria and viruses (the lower two segments) dominate.
Part d subdivides the diseases by whether or not they are transmitted by a vector, such as mosquitoes.
This is Figure 1 from the article.
|
The figure shows, for example, that the number of outbreaks has more than tripled over the 30-year period. The number of diseases involved has grown some, too. The authors note that the number of people affected is declining some; apparently we are having more but smaller outbreaks.
You might suspect that there are questions about possible biases in collecting such records over a long time period from around the world. Indeed, this is an issue the authors deal with. They even try to dissect how the Internet affects collection of disease information. Most importantly, they detail what they did; others can challenge their methods, and develop better ones.
There is no big message here. It is a significant achievement to collect the data and make the database available. The authors refer to the article as reporting their "preliminary findings" (in the abstract). It will serve as a resource to many investigators, and it will be developed further.
News story: Infection outbreaks, unique diseases rising since 1980. (Brown University, October 28, 2014.) From the lead institution.
The article: Global rise in human infectious disease outbreaks. (K F Smith et al, Journal of the Royal Society Interface 11:20140950, December 6, 2014.) For a freely available copy, check Google Scholar, and look at the item with the address including "classic". The article also has lists of the top 10 diseases over certain time periods.
A recent post about a disease outbreak: Chikungunya in the Americas -- are vaccines near? (March 17, 2015). This disease is caused by a virus, and is transmitted by mosquitoes. The virus infects a wide range of animals, and outbreaks may well begin with transmission by mosquitoes from some non-human animal to humans; that is, it is a zoonosis.
A post on the broad issue of diseases, with an emphasis on how interconnected we all are: One health (November 15, 2010).
A post on the major types of food poisoning: The cost of food poisoning (October 14, 2014).
More databases: 124,993 and counting: cataloguing plant species in the Americas (February 26, 2018).
My page for Biotechnology in the News (BITN) -- Other topics includes a section on Emerging diseases (general), as well as sections on some specific diseases. Those sections include lists of related Musings posts.
Camels and the transmission of MERS: blame the kids?
March 30, 2015
The role of camels in the transmission of the Middle East Respiratory Syndrome (MERS) virus is unclear. There is considerable reason to suspect that camels are involved, yet direct tests of transmission from camel to human have been largely negative. Musings noted one such report recently [link at the end].
We now have a new article that may offer a resolution. The scientists studied three camel herds in Dubai, using various types of analyses for the virus. Importantly, they grouped the results by the age of the animal.
The following table summarizes their results...
| Animals tested, by age
| antibodies
| viral RNA
| virus particles
|
| adults, > 4 years old
| 96%
| 0
| 0
|
| subadults, 2-4 years old
| 96%
| 3%
| 7%
|
| calves, < 1 year old
| 85%
| 35%
| 14%
|
The first column lists the age groups of the animals. The final three columns show the percentage of those animals that tested positive for each of three tests: presence of antibodies to the virus, viral RNA, or virus particles. (The test for virus particles is to see if they will grow in lab culture. That is, it is a test for viable virus particles.)
The results suggest the following general points...
* Most animals, of all ages, have antibodies to the virus.
* Only the younger animals, especially the calves, have evidence of active virus production (viral RNA or virus particles).
The table is a simplified version of Table 1 from the article. I have shown only the percentages of positive results for each entry. The full table shows the actual numbers. The number of animals tested is different for every entry, making the full table messy. The authors include some statistical testing; I'm not sure they have done that well, for reasons that take too long to explain. For now, the point is only that the table above suggests some trends, which can be subject to further testing.
Those observations suggest that most of the camels get exposed to the MERS virus while young. At least some of them make virus; they may well be able to transmit the virus. The animals develop an immune response, which is apparently successful: the older animals have antibodies but are not making virus. They are not a source of the virus for transmission to humans (and they are presumably immune to subsequent infection). All of this should be tested further; in particular, it would be good to test whether young infected camels that are actively producing viruses can transmit it.
The authors note that their interpretation could lead to a simple improvement in how camels are managed on the Arabian peninsula to reduce human exposure to the virus. Young camels have little contact with humans while they are still with their mother. However, they are often taken away from the mother at about one year of age. Simply leaving the young camels in their natural family groups for another year or so could lead to a substantial reduction in contact of virus-producing camels with humans.
News story: MERS news: 2 more cases; infections in camel calves. (CIDRAP, March 12, 2015.) Scroll down to "Young camels often infected".
The article, which is freely available: Acute Middle East Respiratory Syndrome Coronavirus Infection in Livestock Dromedaries, Dubai, 2014. (U Wernery et al, Emerging Infectious Disease 21:1019, June 2015.) Participating institutions for the work include the Dubai Camel Hospital.
Background post: Do camels transmit MERS to humans? (January 21, 2015).
More MERS...
* A MERS vaccine, for camels (January 22, 2016).
* How the MERS virus spread in Korea: role of super-spreaders (November 3, 2015).
There is more about MERS on my page Biotechnology in the News (BITN) -- Other topics in the section SARS, MERS (coronaviruses). It includes links to good sources of information and news, as well as to related Musings posts.
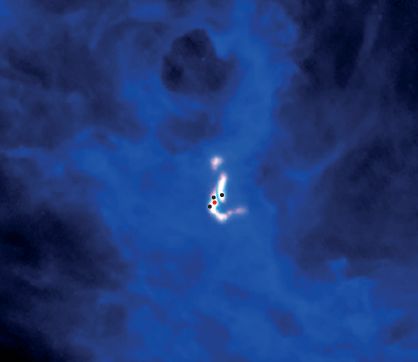
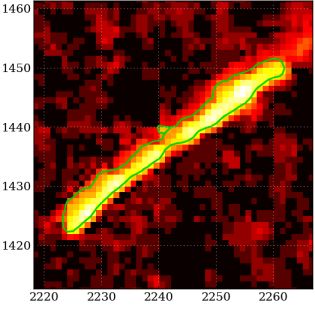
Observing the birth of quadruplets
March 29, 2015
The red dot shows the sibling that was born first; time of birth not known.
The three dark dots nearby show the other three siblings, which are still developing. Scientists estimate their birth will occur within 40,000 years.
It is likely that only two or three of them will survive, perhaps those that are closest. The fate of the others is unknown; they may be ejected.
This is trimmed from Figure 1 from the Nature news article accompanying the article.
|
It's a remarkable study. There are theories about how stars form, but only limited observations of the process. Astronomers think star formation is fast -- on their time scale, perhaps a hundred thousand years or so. That's a tiny fraction of a star's lifetime; catching a star during formation is rare.
Here, we are observing the birth of a 4-star system. It's a favorable case: the star system is rather close, in astronomical terms, and the four clumps are rather far apart. Astronomers are able to resolve them -- by pushing the limits of modern technology. They then interpret their findings in terms of the birth of a 4-star system. The four clumps are developing star embryos. It is astronomers' first snapshot of the birth of a multiple star system so early in its development. Half of average-size stars occur in groups of two ("binaries") or more, but little is known about how they develop.
The figure above shows gas clumps. They are at various stages. Stars form by condensing out of gas clouds; the condensation is driven by gravity. If the gas cloud was uniform, it would presumably condense uniformly into a single object. But many real gas clouds aren't uniform, and this one seems to be on its way to condensing into four objects -- one already well formed and three more that are distinct enough to be noted. All are large enough that they should become stars.
There is a lot of hypothetical in there. This is an unusual snapshot, in that it -- apparently -- shows the birth of quadruplets. The astronomers are having a field day, trying to interpret this, and predict its future. They do a lot of computer modeling, and they claim the results at hand already help them to favor some models over others. At least in this case, it seems that the primordial gas clouds (filaments -- the white regions in the figure) have fragmented prior to star development.
As to the future, which will allow further refinement of the models... it will be revealed over the coming 40,000 years. Stay tuned.
News stories:
* In a first, astronomers catch a multiple star system in the process of forming. (Science Daily, February 11, 2015.)
* Before They Were (Binary) Stars. (M Young, Sky and Telescope, February 12, 2015.)
* News story accompanying the article: Star formation: Sibling rivalry begins at birth. (K M Kratter, Nature 518:173, February 12, 2015.)
* The article: The formation of a quadruple star system with wide separation. (J E Pineda et al, Nature 518:213, February 12, 2015.)
More about star formation:
* Star formation has slowed down (December 4, 2012).
* Cometnapping in the stellar nursery (August 4, 2010).
More about quadruplets: Twins (April 30, 2009).
And more... This could be you (July 8, 2008).
Could a common food plant be used to make rubber?
March 27, 2015
Where does rubber come from? Natural rubber comes from the rubber tree, Hevea brasiliensis, which is grown in various tropical countries, mainly in Asia. There are various reasons to be concerned about the supply. One is the risk that is inherent in relying on a single source, which may be vulnerable to disease. Another is that, if you are in central Canada (or eastern Washington state), rubber trees won't grow there.
How about using lettuce instead?
Two recent articles, from different groups of scientists, explore lettuce as a source of rubber. It has long been known that lettuce exudes a milky latex under certain conditions; that's rubber. Might we develop a practical economical process for rubber production from lettuce? Lettuce starts with some advantages: it is a fast-growing annual, which can grow under a wide range of conditions. Certainly it has merit as a research organism -- and that is really where we are at this point. Surprisingly little is known about rubber production in plants; at the least, studying lettuce should enhance our understanding.
One article (the main one here) uses the lettuce system to identify a key protein complex needed to make rubber. The scientists even tried to make rubber in vitro using the complex; it showed some activity, but worked poorly. It seems likely that they have found part of a larger complex, but more is needed.
The figure at the right summarizes how the scientists think rubber is made, based on their lettuce work.
NR = natural rubber; shown here as red squiggles. ER = endoplasmic reticulum; shown here as a simple lipid bilayer. CPT3 is the key enzyme needed for making the NR. CPTL2 is a newly identified protein that seems to serve some kind of a scaffold role; it targets the enzyme to the ER. Both of these proteins are found primarily in latex-producing cells.
The model shows that the two proteins, CPT3 and CPTL2, form a complex on the ER membrane, and produce NR, which accumulates inside the ER structure. You can also see that specialized structures for NR formation may bud off the ER.
This is Figure 12 from their article (Qu et al).
|
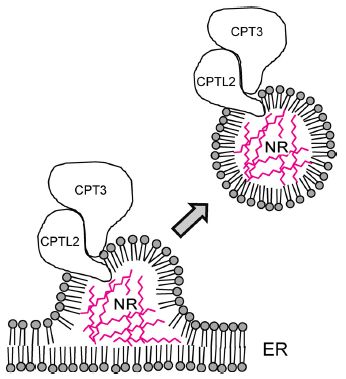
|
That's a small step toward understanding the proteins and structures needed to make lettuce. It's much easier to do such work in a small, fast-growing plant than in a big tree. That is, the big story here is the use of lettuce as a model system for studying rubber production.
Is making rubber in lettuce a good idea? We are now dependent on a single kind of tree for natural rubber. Exploring alternatives is good. Some of them may become useful, some not. Maybe the knowledge acquired by studying lettuce rubber will help us develop better rubber trees, or some other production system.
News story: Scientists learn to make rubber from lettuce. (University of Calgary, January 28, 2015. Now archived.)
The main article: A lettuce (Lactuca sativa) homolog of human Nogo-B receptor interacts with cis-prenyltransferase and is necessary for natural rubber biosynthesis. (Y Qu et al, Journal of Biological Chemistry 290:1898, January 23, 2015.)
There is another article, also recent. I don't have a news story that goes with it, so I'll just note it briefly here. Genetic and Biochemical Evaluation of Natural Rubber from Eastern Washington Prickly Lettuce (Lactuca serriola L.). (J L Bell et al, Journal of Agricultural and Food Chemistry 63:593, January 21, 2015.) The lettuce species studied here is closely related to common lettuce, used in the other study; it may be its direct ancestor. The work involves beginning to study the genetics of rubber production. The authors suggest that the lettuce should be considered as a production system for rubber as well as a model system for studying rubber synthesis. This article is, in part, from Washington State University -- in eastern Washington.
The title of the main article makes a connection to a human protein. Indeed, but the significance is not clear; there is no implication that humans make rubber. The precursor used to make rubber is found in all organisms, plant and animal (and microbial). Making rubber from it is just one option for using that precursor.
This post is about natural rubber. There are also a variety of synthetic rubbers. They are made from petroleum, and have various properties. There is no intent here to weigh the merits of natural vs synthetic rubber.
I don't see any previous Musings posts on rubber or lettuce, but there are posts following on the work of Thomas Alva Edison. These include Restoration of old sound recordings (July 23, 2011). If you don't see the connection, read the news story!
Rubber is an example of a biological addition polymer made from alkenes. For more about alkenes and their polymers, see the section of my page Introduction to Organic and Biochemistry -- Internet resources on Alkenes.
More rubber: Interaction of pollution sources: Can the whole be less than the sum of the parts? (March 9, 2019).
Finally, another post about lettuce... Quality of lettuce grown on the Space Station (April 7, 2020).
More about agricultural biotechnology is on my Biotechnology in the News (BITN) page Agricultural biotechnology (GM foods) and Gene therapy.
Also see: The mystery of the first dinosaur found in the state of Washington (June 12, 2015).
March 25, 2015
Happy birthday, Phil Trans
March 25, 2015
Born March 6, 1665. 350 years old earlier this month, and still going strong.
Briefly: Philosophical Transactions - the world's first science journal. (Royal Society.)
For more...
* Publishing the Philosophical Transactions -- the economic, social and cultural history of a learned journal, 1665-2015. (University of St. Andrews.) This page is part of a larger site about the journal.
* 350 years of Philosophical Transactions. (FORCE. Now archived.) More good pictures!
The old back files of "Phil Trans" are freely available, as noted in the post Royal Society opens its historic journal archives to free access (November 22, 2011).
An example, from 1752, is in the post immediately following that: Benjamin Franklin and the electrical kite (November 22, 2011).
And... The first report of a new planet (March 13, 2011).
Previous birthday posts include:
* Frank Oppenheimer, on his 100th birthday: the Exploratorium (August 14, 2012).
* Happy Birthday (May 27, 2012)
A book about the history of the Royal Society is listed on my page Books: Suggestions for general science reading. Tinniswood, The Royal Society: And the Invention of Modern Science (2019).
Can we pinpoint a specific molecular explanation for tissue damage following a heart attack?
March 24, 2015
We understand in general terms that the tissue damage following a heart attack results from oxygen problems: there is oxygen deprivation during the event, then a burst of oxygen following it. A recent article suggests that there may be a very specific reason, at the molecular level, for the damage. If there is a specific causal event, then it might be possible to inhibit that event.
The following figure shows some of the evidence that points to a specific cause of damage. In this experiment, the scientists measured the levels of several metabolites in various tissues following an artificial heart attack (one induced by the experimenters) in mice.
|
Results are shown here for three tissues. Two are for the heart, tested in vivo (IV) and ex vivo (EV). The third is liver.
Several metabolites are listed across the x-axis. The amounts of each that they found are shown by the bar heights. The y-axis scale shows that the values are presented relative to normal for that metabolite in that tissue. That is, "1" is normal; it is noted with a dashed line in each frame. Note that the y-axis scale is different for each frame, though the idea is the same; compare bar heights only within a frame.
|
The results are clear: the red bar is high in each frame. That is the bar for succinate.
This is part of Figure 1d from the article. The rest of Figure 1d shows the results for brain and kidney; the results are similar to those seen here.
|
The focus on succinate is interesting. Succinate is part of the citric acid (or Krebs) cycle, the central pathway for oxidizing food. Metabolism of succinate leads directly to the electron transport chain. It is easy to see a possible connection between succinate and the generation of reactive oxygen species (ROS), which may be responsible for damage.
If the damage is due to a specific chemical, then inhibiting the production of that chemical should reduce the damage. In fact, the scientists have a chemical that inhibits the production of succinate. It is dimethyl malonate (which is converted in the body to malonate).
The following graph shows the result of one test of the effect of dimethyl malonate. In this case, it is brain tissue that is being damaged, after an artificial stroke. It's the same idea: damage due to oxygen deprivation followed by re-oxygenation.
|
It is a simple graph: only two bars.
The bar height shows the amount of damaged tissue, in cubic millimeters (mm3).
There are two conditions. In both cases, there was a stroke -- labeled "ischaemia". For the right-hand bar, dimethyl malonate was added. It reduced the damage by about half. That's significant.
Ischaemia is the medical term for damage due to oxygen deprivation from loss of blood flow. It is commonly spelled ischemia in American English.
This is Figure 4f from the article.
|
This graph shows that the chemical predicted to be beneficial (or protective) actually works.
Overall... the article has identified a specific chemical (succinate) involved in tissue damage during oxygen deprivation and the subsequent recovery, such as in a heart attack. The evidence suggests that succinate accumulates during the oxygen deprivation; rapid oxidation of the excess succinate upon restoring oxygen leads to the production of ROS. That leads to a prediction about how to prevent damage: reduce the amount of succinate. The article provides evidence that the proposed intervention (malonate, to inhibit succinate production) works.
This article is potentially important. Nevertheless, there are numerous limitations to the work, so be careful. First, the work is in mice, and it is with artificial heart attacks. It remains to be seen whether the main result carries over to humans. Second, although the proposed intervention seems simple, it is not at all obvious how it would be practical during a heart attack. It might well be useful in cases where surgery results in a predicted and controlled oxygen deprivation; perhaps that is where such a method would first be tested. Finally, some of the news coverage notes that the chemical being used as treatment is found in fruits, such as apples. That's true, but is probably of little relevance. Treatment would be with an injection of the chemical, at a dose higher than easily obtained from a piece of fruit. (Is it possible that the levels found in fruit would have any general benefit to a person? That may be a reasonable question to ask, and at some point to test. However, it does not logically follow from what has been found here.)
News story: Researchers use simple chemicals to minimise organ damage following heart attack and stroke. (University of Glasgow, November 5, 2014.) From one of the institutions doing the work.
* News story accompanying the article: Biochemistry: Succinate strikes. (L A J O'Neill, Nature 515:350, November 20, 2014.)
* The article: Ischaemic accumulation of succinate controls reperfusion injury through mitochondrial ROS. (E T Chouchani et al, Nature 515:431, November 20, 2014.)
Also see:
* The origin of life's chemicals: making an almost-Krebs-cycle in the lab (June 10, 2019).
* Role of a receptor for HIV in stroke recovery (March 23, 2019).
* Zebrafish reveal another clue about how to regenerate heart muscle (December 11, 2016).
* A drug for heart hypertrophy? (March 4, 2016).
* Anti-oxidants and cancer? (October 18, 2015).
* Increased risk of congenital heart defects in offspring from older mothers: Why? and can we do anything about it? (July 18, 2015).
* Blood thinning: a new approach (February 2, 2015).
* Mutations that lead to reduced risk for heart disease (November 21, 2014).
* A curcumin-based drug and stroke treatment (March 16, 2011).
Radioactivity released into ocean from Fukushima nuclear accident reaches North America
March 23, 2015
The nuclear reactor accident at Fukushima in 2011 released radioactivity into both the air and the ocean. Scientists have been trying to predict and then actually measure where it went. Reasons concern possible effects on the environment, as well as a better understanding of how material circulates around the Earth.
A group of scientists, mainly in Canada, has been looking for the Fukushima radioactivity approaching the northeastern Pacific Ocean, off the coast of the American west. They report their findings in a new article.
The following graph summarizes some of the findings. It contains data and predictions based on modeling.
|
The graph shows the amount of Cs-137 found in the surface waters at certain sites off the western coast of Canada. Cs-137 is a major radioactive isotope from the Fukushima reactor.
The amount of radioactivity is given in Becquerel per cubic meter (Bq/m3). One Bq is one radioactive decay event; it is, loosely, one "count".
|
The red and blue points from 2012 to 2014 show the levels measured at two stations in the ocean near the Canadian coast. Also note two little arrows near 0 for the early times; these are data points where no Cs-137 was detectable.
The two lines shown in the main graph are two predictions. Both prediction curves have the same general shape: a rise in Cs-137 level to a few Bq/m3, followed by a slow decline. You can see that the measurements are at least roughly consistent with the predictions so far.
(The two prediction lines are actually for different places. The article contains maps showing the relevant geography, including sketches of the ocean currents considered important.)
The inset (upper right) puts the Fukushima contribution in historical context. It shows the level of Cs-137 from fallout from earlier open-air testing of nuclear weapons -- plus the predicted contribution from Fukushima. The fallout curve is in red; the two prediction lines are then added to it for current years. You can see that the Fukushima contribution leads to a significant increase in the total level of Cs-137, but that the total is less than from fallout alone 20 years ago.
This is Figure 3 from the article.
|
The main point above is to show that we can now see the Fukushima radioactivity arriving in the Pacific Ocean off the west coast of Canada. We can also see that the observed radioactivity is at least roughly consistent with predictions. It will take a few more years before we know whether the results follow the other features of the predictions.
Is the level of radioactivity arriving in North America from Fukushima of concern? That is a separate question, and gets us into the murky area of the effects of low level radiation. The short answer is that no one knows for sure what the effects are of such low levels. The effects, if any, are too small to measure directly in human populations.
A simple place to start is to note that Canadian regulations allow Cs-137 in drinking water at a level of 10,000 Bq/m3. The highest levels predicted with the Fukushima contribution are less than 10 Bq/m3 -- a thousand fold below the regulatory threshold. Such regulatory thresholds are sometimes controversial, and not fully based on well-documented facts. However, the Fukushima contribution seems quite negligible, now and in the future.
A more complex issue is how the Cs-137 affects life in the ocean, and how it might affect us if we eat fish that lived in the waters with the Fukushima contribution. The authors summarize what is known. Again, it seems quite likely that the Fukushima contribution will be small in the oceans off North America, and will not affect humans even indirectly. This is based on comparing expected levels to regulatory limits, and also comparing them to natural levels of exposure to radioactivity.
The general tone is that the Fukushima radioactivity is not a big concern in North America. Caution... That does not imply that the Fukushima event was minor. It was a huge event in the Fukushima area. A level of 68 million Bq/m3 was measured at one ocean site near the reactor shortly after the event. But radioactivity levels, and their effects, fall off with distance and time. The current article illustrates how we think that is occurring in the Pacific Ocean off North America.
News stories:
* Fallout from radioactive Fukushima rising in west coast waters. (M Munro, Canada.com, December 29, 2014. Now archived.)
* Tracking Fukushima radiation across the Pacific. (EarthSky, January 6, 2015.)
The article, which is freely available: Arrival of the Fukushima radioactivity plume in North American continental waters. (J N Smith et al, PNAS 112:1310, February 3, 2015.)
For perspective... The article notes that the amount of Cs-137 released at Fukushima was about 1016 Bq. The volume of the Pacific Ocean is about 1018 m3. If the entire Cs-137 release were diluted uniformly in the Pacific Ocean, the level would be 0.01 Bq/m3. It's a big ocean.
There is an interesting technical point about the characterization of Cs-137. The scientists can actually tell whether the Cs-137 they measure came from Fukushima. How? Because Cs-137 emission is accompanied by emission of another radioactive isotope, Cs-134. The latter is short-lived; there is essentially no measurable Cs-134 left from the days of open-air weapons testing. Finding Cs-134 marks the radioactivity as coming from Fukushima. It's a matter of calculation to dissect a Cs-137 measurement to see how much of it came from Fukushima.
Previous posts about Fukushima include:
* Effect of radiation near Fukushima on local monkeys (August 10, 2014).
* Berkeley RadWatch: Radiation in the environment -- Follow-up (May 6, 2014).
* Berkeley RadWatch: Radiation in the environment (February 24, 2014).
Also see: A better way to oxidize americium? A step toward improved processing of nuclear reactor waste? (December 7, 2015).
My page of Introductory Chemistry Internet resources includes a section on Nucleosynthesis; astrochemistry; nuclear energy; radioactivity. That section contains some resources on the effects of radiation. It also includes a list of related Musings posts.
Tamiflu revisited
March 22, 2015
Oseltamivir, commonly known by its trade name Tamiflu, is a drug used to treat or prevent influenza. Nearly a year ago we noted a report summarizing all trial data that was available [link at the end]. The general conclusion was that there was limited evidence for any benefit of Tamiflu. The post noted some of the continuing controversy about the drug.
We now have a new article, with a further analysis of that same available data on the effectiveness of Tamiflu. Interestingly, it reaches a somewhat more positive conclusion. Whether that is due to it being sponsored by the company that makes the drug is an interesting question. Don't jump to conclusions; at least, the potential conflict is disclosed. In fact, the differences between the two evaluations are small; it's more that they emphasize different things. Rather than ask a broad question, such as "is Tamiflu good?", it may be better to ask more focused questions, such as whether it is good under certain conditions, or what specific applications it is good for.
I don't want to get into this much. I posted the original report, in large part, to show how messy the story is. I felt I should note the new article, but the bottom line is the same: it's a messy story. If it interests you, read the earlier post, and the news story listed below.
News story: Tamiflu helps, newest study in long-running debate says. (J Couzin-Frankel, Science Insider, January 29, 2015.) A reasonably informative and balanced overview.
* "Comment" accompanying the article: Influenza: the rational use of oseltamivir. (H Kelly & B J Cowling, Lancet 385:1700, May 2, 2015.)
* The article: Oseltamivir treatment for influenza in adults: a meta-analysis of randomised controlled trials. (J Dobson et al, Lancet 385:1729, May 2, 2015.) Check Google Scholar for a copy.
Background post: Transparency of clinical trials -- Is the flu drug Tamiflu worthless? (May 4, 2014).
Many posts on various flu issues are listed on the supplementary page: Musings: Influenza.
A better way to un-boil an egg -- and why it might be useful
March 20, 2015
There is some light-hearted hype here, and one of the news stories even got the wrong part of the egg in their photo. No, no one has un-boiled an egg. But scientists have done something related, using an egg protein. And it is a method that might actually be useful.
Let's jump in and look at an example of the results, as reported in a new article.
|
In this experiment, the scientists tested some hen egg white lysozyme (HEWL), under various conditions. The bar height (y-axis) shows the activity of the enzyme.
There are five bars. The first, which seems missing, is at zero. The other four bars are all at about the same level -- close enough for our purposes.
|
The first bar, the one with height zero, is for "recombinant HEWL" made in the bacterium E coli. Many proteins are made this way now, using recombinant DNA technology; it allows high level of production. But there is a catch: the protein made this way is inactive. Why? Because in this production system, the protein folds up wrong. It is "denatured", much like egg white protein after cooking. A protein is a long chain of amino acids. When the protein is made, the chain folds up into a specific three-dimensional shape; that 3D shape is needed for the protein to function. In nature, proteins tend to fold up right. But under unusual conditions, such as making a very high level of a chicken protein in bacteria, the folding may fail.
If the protein folds wrong, it may be possible to unfold it and try folding it again in the lab. In fact, there are ways scientists do this now. What the scientists do here is to develop a new way to refold a protein. The next two bars show the activity of the same recombinant HEWL after refolding; the two bars are for two variations of their "VFD" method. You can see that the activity is increased, from essentially 0, to about 8000 (in "units" per milligram of protein).
The final two bars, to the right, labeled "native HEWL", are controls, for the natural protein. One bar is for no treatment, and the other is the result after going through the same treatment used for the recombinant protein. Both bars are about 10,000. Thus the VFD treatment of the recombinant enzyme restored about 80% of the activity, which is good.
This is Figure 2D from the article.
|
Scientists have ways to try to refold recombinant proteins. The method described in the new article may well be simpler -- and much less expensive -- than methods already in use.
What is the new method? It uses a vortex fluid device -- a VFD. The device is essentially a centrifuge; the protein molecules are moving in a thin film of liquid along the surface of the centrifuge tube. This provides a shear stress, due to the increasing centrifugal force along the tube. The shear stress helps separate the misfolded, and entangled, proteins. The scientists discuss background work, where such forces have been used to manipulate other molecular structures. Here, they tune the conditions so that it works to assist with separating misfolded proteins.
It is not clear how widely applicable the new method will be. The scientists test it here on the model protein HEWL, and on two other recombinant proteins. That had to develop proper conditions for each case, but all worked. At the least, VFD may provide another option. It won't unboil eggs, but it may help make some commercially useful proteins cheaper.
News stories:
* Chemists find a way to unboil egg whites: Ability to quickly restore molecular proteins could slash biotechnology costs. (Science Daily, January 26, 2015.)
* Scientists "unboil" eggs. (Naked Scientists, January 30, 2015.) Caution... The picture shows the wrong part of the egg. In fact, the story confuses some of the details, but it is a fun presentation, and broadly good.
The article: Shear-Stress-Mediated Refolding of Proteins from Aggregates and Inclusion Bodies. (T Z Yuan et al, ChemBioChem 16:393, February 9, 2015.)
I don't see any Musings posts on the folding of recombinant proteins. However, as noted, protein folding is an important natural process -- one that goes wrong in certain diseases. Prion diseases, such as scrapie and BSE, are now considered classic cases of protein-misfolding diseases. Increasing evidence suggests that some other neurodegenerative diseases also involve misfolded proteins.
The following posts note examples:
* How BMAA may cause motor neuron disease -- a clue? (July 1, 2014).
* Interfering with prion propagation? (April 5, 2014).
Also...
* For more about prions, see my page Biotechnology in the News (BITN) - Prions (BSE, CJD, etc). It includes a list of related Musings posts.
* My page for Biotechnology in the News (BITN) -- Other topics includes a section on Alzheimer's disease. It includes a list of related Musings posts.
Another unusual centrifuge: The paperfuge: a centrifuge that costs 20 cents (April 17, 2017).
March 18, 2015
Chikungunya in the Americas -- are vaccines near?
March 17, 2015
Musings has discussed many diseases, ranging from the first reported cases of the new Heartland virus to the prospect of eradication of poliovirus [links at the end]. One disease we have not mentioned is chikungunya. This post will serve as a brief introduction to chikungunya; the impetus is a new article reporting an early trial of a vaccine.
Chikungunya is a well-known disease in tropical Asia and Africa; it has been almost unknown in the Americas. Occasional cases imported by travelers were noted, but otherwise, the case count for chikungunya in the Americas has been essentially zero.
Until now. An outbreak of chikungunya in tropical America, centered in the Caribbean, is in progress. It began in late 2013, so is just over a year old. The case count for this current chikungunya outbreak in the Americas is over 1.2 million. About 2500 cases have been reported in the United States; most of those were probably imported by travelers, but 11 cases are thought to be due to local transmission in Florida.
Chikungunya is caused by a virus, and is transmitted by mosquitoes. The mosquito vector plays an important role in determining the range of the virus. A few years ago, the virus adapted to a new species of mosquito, thus allowing it to expand its range. Climate change may also allow the mosquito vectors themselves to expand their range. Concern about chikungunya has increased as we note the likelihood of its expansion -- and observe it in the Americas.
Chikungunya rarely kills; only 183 deaths are attributed to it in this outbreak (as of March 13). But it is a quite nasty infection; many cases develop a debilitating arthritis that can last for several months.
A new article reports a trial of a vaccine against chikungunya. It's a very small early (Phase 1) study. The vaccine is based on a well-known virus used as a measles vaccine; here it has been engineered to deliver chikungunya surface proteins as antigens.
The good news is that participants showed an appropriate production of antibodies after two doses of the vaccine. There was a significant incidence of adverse events; this may be acceptable, but needs further study. There is no testing of whether the vaccine prevents getting the disease (though that was done in the animal tests that preceded the trial). (The primary goal of a Phase 1 trial is to determine a good dose, and to examine safety.)
Other vaccine candidates have been similarly tested; more are in the pipeline. Perhaps oddly, the earlier candidates do not seem to have been followed up well. It will be interesting to see how vaccine development proceeds as the importance of chikungunya is increasingly recognized.
News story: Themis Bioscience's Chikungunya Vaccine Study Results Published in The Lancet Infectious Diseases. (Institut Pasteur, March 3, 2015.) Press release from the research institute and company behind the vaccine development.
* "Comment" accompanying the article: Fighting back against chikungunya. (P A Rudd & S Mahalingam, Lancet Infectious Diseases 15:488, May 2015.)
* The article: Immunogenicity, safety, and tolerability of a recombinant measles-virus-based chikungunya vaccine: a randomised, double-blind, placebo-controlled, active-comparator, first-in-man trial. (K Ramsauer et al, Lancet Infectious Diseases 15:519, May 2015.)
Background posts:
* The Heartland virus (October 2, 2012)
* Polio: Another country may be getting close to eradication (December 8, 2014).
More about chikungunya: Chikungunya in the Americas, 1827 -- and the dengue confusion (April 3, 2015).
Chikungunya is mentioned in the post Why does Zika virus affect brain development? (August 11, 2017).
Also see: Disease outbreaks: Trends and perspective (March 31, 2015).
My page for Biotechnology in the News (BITN) -- Other topics includes a section on Polio, and a more general section on Emerging diseases (general). Those sections, and other disease-related sections there, include lists of related Musings posts. There is also a section on Malaria, which lists other posts on disease-transmitting mosquitoes.
What is the proper length for eyelashes -- and why?
March 16, 2015
We have an answer, thanks to what National Geographic calls "perhaps the most rigorous study of eyelash aerodynamics ever conducted". (From the news story listed below.)
The following figure shows the answer to the first part of that question...

|
The length of the lashes of this goat eye are about one third the width of the eye.
That's typical of what is found, for a wide range of mammals, small and large, according to a new article.
This is from the Georgia Tech news story. Other views of the goat eye are in Figure 1 of the article; same goat, I suspect.
|
That raises a number of questions. Let's look at some of them.
What do eyelashes do? They affect the air flow around the eye. They slow the air, thus reducing evaporation from the eye; they also deflect particles from entering the eye.
How did the scientists find that ratio? That part is observation; they measured the eyelash length and eye width for numerous mammals, and observed that there was a relationship.
Is there some reason for that ratio? This question led the scientists to do some experimental tests. They made an artificial eye structure, with artificial eyelashes -- and tested it in a wind tunnel. That's a miniature wind tunnel, based on a computer fan. What did they find? That the ideal length of the lashes was about one third the eye width.
The following figure shows an example of their wind tunnel results.
In this test, the scientists arranged that droplets might fall on the eye. The droplets contained a fluorescent chemical, which they could measure, following a standard time of exposure.
The graph shows the amount of fluorescence on the eye (y-axis) vs the eyelash length (x-axis). The eyelash length is shown as the ratio L/W -- the lash length divided by the eye width. (Just below the number is a small diagram to give an idea of the L/W ratio.)
|
|
You can see that the amount of fluorescent chemical deposited in the eye was reduced as the lashes got longer -- up to L/W = 0.2 in this case. Longer lashes led to more deposition in the eye.
This is Figure 8d from the article. (I have removed the inset from the figure.)
|
In summary, the results of that test show that short eyelashes reduce deposition into the eye, but longer ones are not as good. The results provide experimental support for there being an optimal length for eyelashes.
The scientists did other tests, with the same general pattern of results. Further, they did theoretical calculations of the aerodynamic effects of eyelashes of various lengths. The general picture is that there seems to be an optimum length for the eyelashes. It is roughly 1/3 of the width of the eye. (They say 0.3 +/- 0.1.)
Are there any practical implications of this work? First, we should understand that the eyelashes are part of the defense mechanisms that protect the eye. That has long been recognized; for example, people without eyelashes have a higher incidence of eye infections. How eyelashes work has not been clear. Thus this article is a contribution toward understanding the body. Beyond that... Well, the authors do note that fake eyelashes commonly used for cosmetic purposes are much too long, and are probably not good for the eyes. They also note possible engineering applications, such as hairs to protect sensors, solar panels or robots.
It's an offbeat article, but it illustrates some interesting combinations of ideas. An engineer reading this post will want to know what Reynolds number the scientists used for their testing; the authors note that their testing is for laminar flow, during walking. And if you ever wondered what an engineer sees upon looking a goat in the eye, now you know.
News story:
* Longer Eyelashes May Be Sexier, But Not Always Better. (National Geographic, February 24, 2015.) Now archived.
* Easy on the eyes: How eyelash length keeps your eyes healthy. (Georgia Tech, February 25, 2015.) From the university where the work was done.
The article: Eyelashes divert airflow to protect the eye. (G J Amador et al, Journal of the Royal Society Interface 12:20141294, April 6, 2015.) Check Google Scholar for a copy.
Previous posts that mentioned eyelashes or wind tunnels: none
Previous post about eyes: How can the mantis shrimp see so many colors of UV? They use filters (August 30, 2014).
* Previous post about wind: How rocks travel (November 14, 2014).
* Next: At what wind speed do trees break? (April 2, 2016).
* and... Atmospheric rivers and wind (May 9, 2017).
More from the same lab: A mammalian device for repelling mosquitoes (December 10, 2018).
Another mention of the Reynolds number -- along with the Weber number: What determines the size of liquid droplets from a sprayer? (September 21, 2018).
On the testability of scientific models
March 14, 2015
A general feature of scientific inquiry is that it involves proposing explanations for how nature works -- explanations that are testable. That is, it should be possible to test a proposed explanation, and, if it is wrong, to show that.
What it means to be testable is open -- and complicated. Some things are easy to test, some are not. But we expect that scientific explanations should be testable, at least in principle.
We now have a phenomenon of ideas that do not seem to be testable at all. Ideas such as multiverses and string theory may be fascinating, but we have no idea how we might test them. In fact, it seems to some people that such ideas are fundamentally untestable. That is, it's not just that we don't see how to test them given the tools at hand, but that we don't think they are testable in principle by human observation.
Are such ideas part of science? Physicists are struggling with this question. A recent "Comment" feature in Nature addresses it. The physics behind the story is complicated, but some of it makes the popular news. The issue of how such ideas fit as science is important, and difficult. I encourage readers to look over this intriguing little article.
"Comment" article, which is freely available: Defend the integrity of physics -- Attempts to exempt speculative theories of the Universe from experimental verification undermine science. (G Ellis & J Silk, Nature 516:321, December 18, 2014.) If you find the physics in this article to be difficult, emphasize the part of the story about the nature of science.
Musings posts about the nature of the universe include:
* Star formation has slowed down (December 4, 2012).
* Quark soup (August 15, 2011).
And about science... The nature of science (February 4, 2009).
My page for Biotechnology in the News (BITN) -- Other topics includes a section on Ethical and social issues; the nature of science.
A recent book that includes some discussion of this issue is listed on my page Books: Suggestions for general science reading: Gleiser, The Island of Knowledge -- The limits of science and the search for meaning (2014).
Shark skin inspires design of a new material to reduce bacterial growth
March 13, 2015
Bacteria stick to surfaces. In fact, they form special structures, called biofilms, that are specialized for sticking to surfaces.
Bacteria in biofilms are hard to deal with. They aren't easily washed away. Further, they tend to be resistant to antibiotics. Biofilms can serve as reservoirs that lead to infection. It is a particular problem in hospitals. Microbiologists have become increasingly aware that the problem of bacterial biofilms needs to be dealt with directly.
A new approach to dealing with biofilms has come from sharks. Turns out that things don't stick well to shark skin. With modern microscope tools, scientists have come to realize that shark skin has a complex surface texture. Inspired by that as a clue, a team of scientists has developed a new material with a somewhat similar complex surface texture. They call it Sharklet, and it resists bacterial attachment, or "fouling". A recent article reports some findings on how well Sharklet works.
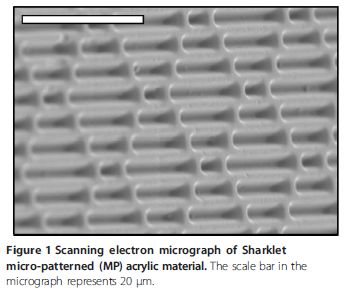
|
That is what the Sharklet surface looks like. The ridges are on the order of the size of individual bacterial cells.
This is Figure 1 from the article. I have included the original figure legend.
|
Here is an example of the results...
In this test, the scientists tested the direct transfer of bacteria from a fabric onto three types of surfaces. They then measured how many bacteria could be recovered from the surfaces. They did that at two time points: "zero" time, and after 90 minutes of drying.
Two of the three surfaces were the plastic film they were using to make Sharklet. In one case (left; black bar), they used smooth film; in the other (middle; gray bar), they used the film with the special Sharklet-patterned surface. The third surface (right; white bar) was smooth copper, sometimes considered an antibacterial material.
At each time point, you can see that the lowest bar is the middle one, for the Sharklet surface. The copper surface was worst. Further, all the bar heights are lower at the later time point.
The numbers... The comment above is sufficient, but if you want to work through some of the numbers... The y-axis uses a log scale. 3 means 103. The difference between 3 and 2 is a factor of 10. For example, if a value is 3 before treatment, then 2 after treatment, that means there are 1/10 as many bacteria; that is a reduction of 90%. The percent number on an individual bar shows the reduction for that bar compared to the "smooth" plastic control at that time point. (A negative value for a bar means that it had more bacteria than the smooth plastic control; the "reduction" was negative.)
You will see the term RODAC on the graph label. It stands for Replicate Organism Detection and Counting. It refers to a standard test for measuring bacteria on a surface.
The results shown above are for MSSA, which stands for methicillin-sensitive Staphylococcus aureus. The right hand side of the full figure, which I have not shown here, is for MRSA, methicillin-resistant Staphylococcus aureus. The results are very similar. That is, the Sharklet material is hard for bacteria to stick to, and that is independent of their regular drug-resistance status, as one would expect.
This is part of Figure 4 from the article.
|
In summary, the surface that was roughened with the Sharklet texture gave the best results. Fewer bacteria stuck to it initially in this touch-transfer test, and persistence after drying was reduced. Other tests used immersion or spray to transfer the bacteria, mimicking spills or sneezes. All the tests led to the same general conclusion.
We should emphasize that the effectiveness of Sharklet is entirely due to the physical nature of the surface. There are no antibacterial additives or such on the surface.
How might one use Sharklet? Transmission of bacteria in hospitals is a serious problem. In part, it is due to the bacteria "hanging around", in a relatively resistant state, on surfaces. Cleaning is useful, but not sufficient. Use of the textured surface could provide an extra layer of protection to help reduce the bacterial load in hospitals.
News stories:
* Shark Skin-Like Wallpaper Highly Effective In Preventing MRSA Superbug Growth On Hospital Surfaces. (Medical Daily, September 17, 2014.)
* Sharks' skin has teeth in the fight against hospital superbugs. (BioMed Central, September 17, 2014.) Press release from the journal publisher.
The article, which is freely available: Surface micropattern limits bacterial contamination. (E E Mann et al, Antimicrobial Resistance and Infection Control 3:28, September 17, 2014.) The article, and most work on the material, is from a professor at the University of Florida who invented Sharklet, and is involved in the company making it. The role of the company is acknowledged in the article. That's fine, but it would be nice at some point to see some independent testing.
I have not seen any discussion of the possibility that the bacteria would, over time, develop the ability to stick to the surface material. This needs to be tested.
Thanks to Thien for bringing this work to my attention.
More about Staph and biofilms: Can the Staph solve the Staph problem? (July 12, 2010).
Biofilms in the food processing industry: Salmonella and food contamination; the biofilm problem (April 28, 2014).
Another post that tries to deal with bacteria by physical means: Black silicon and dragonfly wings kill bacteria by punching holes in them (January 28, 2014).
Antiviral surfaces... ... An antiviral coating for medical textiles (July 12, 2020).
More on antibiotics, and the broad topic of reducing bacterial growth, is on my page Biotechnology in the News (BITN) -- Other topics under Antibiotics. It includes a list of related Musings posts.
This is an example of bio-inspired design, in that the observations of the shark skin were used in designing the new material. For more, see my Biotechnology in the News (BITN) topic Bio-inspiration (biomimetics). It includes a listing of some other Musings posts in the area.
More about biomimetics... Biomimetics -- an overview (December 9, 2015).
Another post that turned out not be about real sharks: How the price of oil might affect what seals eat for dinner (January 18, 2015).
Real sharks...
* Cuttlefish vs shark: the role of bioelectric crypsis (May 10, 2016). Well, some are real. Others are just iPad images.
* Cannibalism in the uterus (May 31, 2013).
More sneezing... Disease transmission by sneezing -- in wheat (July 29, 2019).
More on plastics... A simpler way to make styrene (July 10, 2015).
March 11, 2015
Can chimpanzees learn a foreign language?
March 10, 2015
If you moved from The Netherlands to Scotland, would you learn the word for a favorite food in your new local language? A new article reports that a group of chimpanzees did just that.
The scientists took advantage of a situation that arose, and made some interesting observations. A group of chimps was moved from a zoo in The Netherlands to one in Scotland. Turns out that the two groups of chimps had quite different attitudes about apples, and used quite different sounds to refer to them. Over time, the transplanted Dutch chimps came to use the same vocalization for apples as their Scottish hosts.
For simplicity, I'll refer to the two groups as Dutch and Scottish chimps, based on where they were brought up. And I'll refer to their "languages" as Dutch and Scottish.
There is more to the story. Prior to this work, scientists had thought that the chimp vocalizations were as much a statement of their emotional response as they were of identifying the object. Dutch chimps liked apples, and used a high-pitched sound to refer to them. Scottish chimps disliked apples, and used a low-pitched sound. There was reason to suspect that the type of sound reflected how they felt about the apples. But the results found here are not consistent with that interpretation. The Dutch chimps continued to like apples; they just learned to use the local name for them. The Scottish zoo now had two types of chimps: both used the same term for apples, though one liked them and one did not. Clearly the chimps were using the vocalization as a name for the object, not simply as an emotional response.
Interestingly, the use of the new term for apples by the Dutch chimps correlated with the social integration of the two groups. They remained socially separate for many months, then slowly integrated. The article contains observations of the social networking; the language shift came as they integrated. Language shift, but not a change in taste.
This is a nice little article. It involves simply making observations. It leads to some insight about the nature of language. It's a small step, but interesting.
News stories:
* Chimps 'learn local grunts' to talk to new neighbours. (BBC, February 5, 2015.)
* Do chimps have regional accents? (Naked Scientists, February 9, 2015.) Interview with Dr Katie Slocombe, York University, the senior author. (Available as audio file.)
The article: Vocal Learning in the Functionally Referential Food Grunts of Chimpanzees. (S K Watson et al, Current Biology 25:495, February 16, 2015.)
More about language in non-human primates:
* Can French baboons learn to read English? (May 13, 2012).
* Speech: Taking turns (August 17, 2011).
More about language...
* What do bats argue about? (April 21, 2017).
* Do babbler birds construct words? (August 4, 2015).
Other posts about chimpanzees include:
* What do chimpanzees think about cooking food? (August 30, 2015).
* Genes that make us human: genes that affect what we eat (February 18, 2015).
* The origins of baseball -- two million years ago? (August 18, 2013).
More about apples... Food poisoning outbreak: Listeria infections from caramel apples and fresh apples (January 14, 2015).
Media hype about scientific articles: Who is responsible?
March 9, 2015
Science communication is a big deal these days -- with Musings just one small example of a wide range of resources that try to "spread the news" about scientific developments. We don't always get it right.
A recent article examines one aspect of the problem, where news coverage gives advice to the consumer -- advice that is sometimes not justified by the work at hand. In particular, the scientists look at the role the universities themselves may be playing in hyping the work. It is common that a university involved in an article issues a press release; the news media are likely to use the press release as part of the basis of their own reports. How much more they do varies.
The article focuses on a collection of all health-related press releases accompanying articles from 20 major universities in the UK for 2011. The authors examined the press releases and the news stories about the articles.
The following figure is an example of the findings.
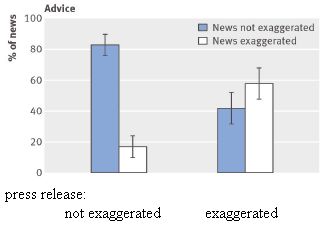
|
In this figure, the authors show how often news stories give exaggerated advice, depending on whether or not the university press release contained exaggerated advice. Here, "advice" refers to giving the reader advice about such things as healthful living, or other suggestions that might be considered medical advice, based on the findings of the article. Exaggerated advice means that the advice went beyond what the article showed.
|
Look at the two white bars. These show the percentage of news stories that gave exaggerated advice. The white bar of the left group is for cases where the university press release was not exaggerated; the white bar of the right group is for cases where the university press release was exaggerated. The latter is about three times the size of the former (60% versus 20%). Exaggerated university press releases are associated with exaggerated news stories.
This is the top frame of Figure 2 from the article. I have added the x-axis labels.
|
The graph above is for one type of hype, described as advice. The findings for two other types of hype are qualitatively similar.
The work establishes a rather clear correlation between hype in university press releases and hype in resulting news stories. Since the news stories typically build on the press releases, a possible reason for the connection is clear. In an ideal world, each news outlet would try to verify the information. But it isn't an ideal world. Anyway, doesn't a general consumer news outlet have some right to expect that the content of university press releases is high quality, especially in technical fields that the media themselves may not know well?
The work has led some to suggest that universities need to make more effort to provide high quality, low-hype press releases. Of course, many of them already do a good job. One issue is the role of the scientists in the development of these press releases. Traditionally, most scientists aren't very interested in popular news coverage of science. Maybe they should be. Maybe they should be responsible for the quality of the press releases about their work. Maybe the press release should be part of the scientist's record. Some thoughts, hopefully constructive, and certainly provocative. For more, see the editorial from the journal, listed below.
There are cautions about the study. The authors discuss some of them, such as the inability to establish cause and effect relationships here. For example, it is possible that news story hype correlates with press release hype because some articles lend themselves to being easily hyped. Nevertheless, the current article is a step toward focusing attention on the problem of media hype. We should also note that some issues here are specific for articles with health-related content, where there is a clear direct relevance to the reader.
News story: Most exaggeration in health news is already present in academic press releases: Scientific community can improve the situation. (Science Daily, December 10, 2014.) Science Daily typically posts stories based on a press release, which is acknowledged. In this case, the press release is from the journal. In my experience, Science Daily stories usually closely follow the press release, but are somewhat improved by the editors.
* Editorial accompanying the article: Preventing bad reporting on health research -- Academics should be made accountable for exaggerations in press releases about their own work. (B Goldacre, BMJ (British Medical Journal) 349:g7465, December 9, 2014.) The general tone of the editorial is that scientists should assume responsibility for the quality of the press releases about their work. As an example of how this might be implemented, the author suggests that that the press release show the names of the scientists who helped write it, and that it be maintained along with the article.
* The article, which is freely available: The association between exaggeration in health related science news and academic press releases: retrospective observational study. (P Sumner et al, BMJ (British Medical Journal) 349:g7015, December 9, 2014.)
What about Musings? I make considerable effort to try to get the facts and the comments correct. But it is impossible to get it all right.
Musings tends to focus on single articles, or even parts of single articles. Doing that can easily lead to distortion. Science stories are more than single articles. For example, an article may be of interest because it presents something that seems unusual. It may be of interest, but science only accepts the result as valid when it is confirmed. It may be natural that there is some hype when talking about individual findings out of context -- which is what we commonly do. That is why we continually remind readers that what we have is a report; the full true story develops over time.
In choosing news stories to list in Musings posts, I try to include ones that I think are good. No source is always good; I don't rely only on the source name. Sometimes I note problems with certain stories, but sometimes I don't. I just assume readers will show some judgment in reaching conclusions. (Hm, I wonder... ) Headlines are notorious for hype; we just take that for granted.
If you see errors -- whether of typos, facts, or interpretations -- please let me know. (Most news media would also appreciate such comments.)
Here are two recent Musings posts that raised some issues about the quality of the news reports.
* Can eating peanut protein reduce the incidence of peanut allergy? (March 3, 2015). In this post, one of the news sources I used was the UK NHS. Their articles typically comment on the news coverage. In this case, they said it was mostly good, other than some tendency to miss the distinction between eating peanuts and eating peanut-based foods -- a problem they traced to the university news release. (One of the news stories for the current post is from them.)
* Why are some types of cancer more common than others? (February 6, 2015). This post about cancer incidence included discussion of the news coverage. The issues here were complicated, but the reluctance of one of the scientists to help may have contributed to the problems with the news coverage.
Another post about science news... The quality of science news (April 26, 2017).
More about news: Comparing how true and false news stories spread (June 5, 2018).
My page for Biotechnology in the News (BITN) -- Other topics includes a section on Ethical and social issues; the nature of science.
How to eat if your jaw looks like a circular saw -- a follow-up
March 8, 2015
Watch the video. (YouTube; 7 seconds; no useful sound.) This video is from the National Geographic news story listed below.
Do you recognize the main character there? It is a Helicoprion, a long-extinct cartilaginous (shark-like) fish. The best characterized part of this fish is a huge set of teeth arranged in a spiral. A previous post showed that this whorl of teeth was part of the lower jaw, in a structure that looked something like a circular saw [link at the end].
A new article from the same group of scientists follows up. They develop a model of the saw-jaw. You see it in the video above, in action.
The goal was to try to understand how the saw-jaw worked, by analyzing not just the teeth but the teeth whorl in the context of the body. Careful examination of the fossil remains showed muscle scars, which provided information on the location and size of muscles. The scientists constructed a physical model, and also did calculations of how the expected jaw movement would move the teeth.
The idea they develop is that the front teeth are well equipped to pull things in as the jaw begins to close. The middle teeth cut flesh. As the jaw closes further, the back teeth presumably propel the meal into the digestive track. What about shells? The scientists think it most likely that hard-bodied animals would bounce off the front teeth; they think Helicoprion ate mainly soft food. [However, if it got the shelled prey at just the right angle, it might have been able to ingest the innards while rejecting the shell -- thus forming what the authors refers to as "a novel mollusk shucking system" (p 60).]
Not exciting? The video might have been a clue. But the new work does represent an attempt to understand a basic function of an animal -- an unusual animal -- that has not been seen for 250 million years. Interesting, even if not exciting. And it is interesting to read how they can extract so much information from such limited source material. A big caution, of course... take all their ideas as tentative.
So far as we know, no animal has eaten like this for 250 million years. Does that mean this is a poor way to eat, a way that nature tried but rejected? That is one of those intriguing questions we can't answer. We do not know why no animal eats like this. It is possible that Helicoprion did lose out in a free competition to better eaters. But the authors suggest that its eating style was well suited to its environment, and that it served this animal well for many millions of years. It is possible that it died out in some mass extinction, or for some reason having nothing to do with its eating style. We do not know. It is also unlikely that we will know anything of its genetics, or have any idea how such an animal might arise. So let's be cautious about judging Helicoprion. Let's enjoy the developments in our understanding, but there is so much more that we don't -- and probably never will -- know about it.
News story: Bizarre, Prehistoric Ratfish Chomped Prey with Buzzsaw Jaws. (B Switek, National Geographic blog, September 3, 2014.) Now archived.
The article: Eating with a Saw for a Jaw: Functional Morphology of the Jaws and Tooth-Whorl in Helicoprion davisii. (J B Ramsay et al, Journal of Morphology 276:47, January 2015.)
Background post: Helicoprion -- a fish with 117 teeth, arranged in a spiral (March 9, 2013). Includes many links.
More about old teeth:
* The case of the missing incisors: what does it mean? (September 13, 2013).
* Bacteria on human teeth -- through the ages (March 24, 2013).
More jaws... How to clamp down to keep the partner from straying (December 15, 2020).
Added April 14, 2026.
More saws... Developing a laser saw for cutting bones (April 14, 2026).
A new antibiotic: an interesting story about the discovery and action of teixobactin
March 7, 2015
The discovery of a new antibiotic was announced recently. Not the approval, but the discovery.
We are in desperate need of new antibiotics. Many are discovered, but few turn out to be useful. Why is the mere discovery of a new antibiotic newsworthy? There are some features of the story that -- just possibly -- could open the door to much more.
Here is that newly discovered antibiotic...
That is teixobactin. Part c shows the chemical structure. Part b (at the top) is a diagram summarizing that much of the structure consists of a series of amino acids connected together.
But no matter. It's not really the structure that is of interest. Continue on...
This is Figure 1 parts b & c from the article.
|
What is of interest?
How it was discovered. The traditional pathway for finding antibiotics is to isolate possible producing organisms, grow each one up, and test what it made to see if it has antibiotic activity (inhibits bacteria). Many useful leads have been found this way, but in recent years there has been little. It seems that we have more or less exhausted this source.
What did the scientists do that was novel in the new work? They tested what the possible producing organisms made without first isolating them -- at least, without isolating them completely. This is important. We now realize we don't know how to grow the vast majority -- perhaps 99% -- of microbes in the lab. Why is a long story in itself, but let's note that in nature, most microbes don't grow alone; they grow in a complex community with many organisms. For a microbe, growing in "pure culture" (without other kinds of organisms around) is an unnatural act; to get it to work requires that we understand what the organism needs to grow.
In the new work, the scientists developed an apparatus where individual cells could grow with some physical separation from other cells, but still close enough that they could share nutrients -- or whatever it is members of the community do together. The general approach for doing this was to isolate single cells into little droplets of agar, but then incubate these droplets in ordinary soil -- the community environment in this case. The products of individual cells could be identified, via the agar droplets, but the cells had been able to grow in something resembling their natural environment.
Good. But that might lead to a problem. What good does it do to find a potentially interesting product if we can't grow the organism that made it? Good question. Until recently it might have been a fatal barrier to using such techniques, but now there are possible solutions. For example, with the compound at hand, we can determine its structure, and perhaps make it by some other means. Or we can now make a special effort to cultivate the producing organism -- knowing it is of special importance. Or we might sequence its genome, identify the genes for making the product, and move them to a new host where, with some luck, they will produce the compound of interest.
In this case, the scientists were able to grow the producing organism well enough to use it for lab-scale antibiotic production. They have also determined the genome sequence and found the genes responsible for making the antibiotic.
A special feature of this antibiotic. After finding the candidate antibiotic, the scientists do the usual tests one would do with something novel. This includes broadly testing it against a variety of organisms at various levels. One thing to watch for is how rapidly resistant mutants arise. After all, antibiotic resistance is one of the major problems nowadays that leads to the need for new antibiotics: the old ones aren't working very well anymore.
In this case, they didn't find resistant mutants. They looked harder, and still didn't find any. The possibility that an antibiotic doesn't lead to resistance is intriguing -- and has been the focus of much news attention. Other antibiotics that act perhaps similarly to the new one have also led to slow development of resistance. So perhaps it is plausible. Not that resistance won't develop, but that it may take much longer. It's certainly a feature to note.
I think this article is of most interest for opening up a new approach to antibiotic discovery. In fact, the scientists have discovered new antibiotics with their system. The current one, the most promising, has some interesting features, but it is a long way to the clinic. That it may be active against some pathogens that are hard to treat provides a good incentive to continue.
News stories:
* New Antibiotic from Soil Bacteria -- Researchers have isolated a new kind of antibiotic from a previously unknown and uncultured bacterial genus. (Anna Azvolinsky, The Scientist, January 7, 2015.) Now archived.
* A New Antibiotic That Resists Resistance. (E Yong, National Geographic blog, January 7, 2015.) Now archived.
* News story accompanying the article: Antibiotics: An irresistible newcomer. (G Wright, Nature 517:442, January 22, 2015.)
* The article: A new antibiotic kills pathogens without detectable resistance. (L L Ling et al, Nature 517:455, January 22, 2015.) Check Google Scholar for a copy.
Other posts on the development of new antibiotics:
* Staph in your nose -- making antibiotics (October 9, 2016).
* Designing a less toxic form of an antibiotic (April 19, 2015).
More on antibiotics is on my page Biotechnology in the News (BITN) -- Other topics under Antibiotics. It includes a list of Musings posts on various aspects of antibiotics, including sources and resistance.
March 4, 2015
Climate engineering: How should we proceed?
March 4, 2015
Climate engineering, sometimes called geoengineering, is a term given to some possible ways to reduce the effects of climate change by modifying the Earth. Examples that have been proposed include adding particulates to the atmosphere or iron to the ocean. Sequestering CO2 can also be included.
It's a controversial field, for various reasons. The background underlying the proposals is incomplete; the full consequences of particular methods are uncertain. All those points belong on the table -- along with all the other ideas.
A recent short "Commentary" article in Nature urges us to take proposals for climate engineering more seriously. Let's evaluate them while there is time to do so. And while we are doing that evaluation, we will need to think hard about what it is we want to test, and how we want to supervise and regulate any such work. It's an intriguing -- and provocative -- article. Just the kind of thing everyone should read and think about. While there is time to do so.
The "Commentary", which is freely available: Start research on climate engineering -- Safe, small-scale experiments build trust and road-test governance. (J C S Long et al, Nature 518:29, February 5, 2015.)
Be careful about having any general reaction to the field, or to the term. When we burn fossil fuels, we are modifying the climate. Isn't that geoengineering? When we buy a hybrid or electric car, thinking it will reduce climate change, isn't that geoengineering? How sure are we that the complete long term consequences of the electric car are favorable? What is it that we should know?
Posts on geoengineering include:
* Predicting the "side-effects" of geoengineering? (September 23, 2018).
* Geoengineering: the advantage of putting limestone in the atmosphere (January 20, 2017).
* Capturing CO2 -- and converting it to stone (July 11, 2016).
* Fertilizing the ocean may lead to reducing atmospheric CO2 (August 24, 2012).
* Geoengineering: a sunscreen for the earth? (February 20, 2010).
An example of trying to analyze the big picture for a specific example of energy usage: Impact of watching movies on global warming (September 30, 2014).
Can eating peanut protein reduce the incidence of peanut allergy?
March 3, 2015
Peanut allergy is an increasingly important problem. Official recommendations about how to deal with the situation have varied over time; frankly, our understanding of what is behind the increase in peanut allergy is low.
A new article reports a clinical trial aimed at reducing the incidence of peanut allergy. The results are so strong that many feel this article will impact the thinking of the medical community almost immediately, even before confirming studies are done.
What the scientists did in this trial was to take a group of infants who were considered at high risk for developing peanut allergy: they had already developed other allergy problems. They divided that group into two treatment groups. One treatment group was asked (via their caregivers) to not consume peanut products. The other treatment group was asked to consume peanut products -- a specified amount of specified peanut food on a specified schedule. Over time, the scientists tested the children to see if they had developed an allergy to peanut.
Here is a summary of the key results...
Prior to starting the trial, the infants were tested to see if they already showed signs of peanut allergy. This was done with a standard skin-prick test (SPT). This testing resulted in three groups: those with no sign of peanut allergy, those with a weak positive response, and those with a strong response. The latter group, deemed to already have the allergy, was excluded from the trial.
The results are shown separately for the two remaining groups (or "cohorts") based on the preliminary skin test: SPT-negative (on the left) and SPT-positive (right).
The bar height (y-axis) shows the percentage of people in that group who showed peanut allergy at 60 months of age. (Treatment started at 4-11 months of age.)
In both cohorts, the frequency of peanut allergy was much higher in the "Avoidance group" (left bar for each cohort) than in the "Consumption group" (right bar). Compare the two bars within each frame. The frequency of allergy was indeed higher in the group that had shown some response in the initial test (SPT-positive); what's important is that the consumption group showed less allergy than the avoidance group.
(Don't make much of the apparent zero bar for the consumption group with SPT-positive. It's a small group; one case would have given a bar at 2%.)
This is part of Figure 2B from the article.
|
Summarizing... Consumption of peanut products by infants appears to decrease the chance of developing peanut allergy. And remember, the trial was done with infants deemed at high risk, because of other allergy problems.
The result goes against at least some of prevailing wisdom, though the evidence supporting avoidance has generally been meager.
If this is of immediate practical interest to you, what should you do? Remember the usual Musings disclaimer: we do not give medical advice. That is partly because of the way we tend to focus on one result. The proper advice, as always, is to consult your medical professional.
News story: Peanut consumption in infancy prevents peanut allergy, study finds. (Science Daily, February 24, 2015.) This story notes how the study got started. An anecdote is not a conclusion, but it can guide forming a good controlled study.
* Editorial accompanying the article: Preventing Peanut Allergy through Early Consumption -- Ready for Prime Time? (R S Gruchalla & H A Sampson, New England Journal of Medicine 372:875, February 26, 2015.)
* The article, which may be freely available: Randomized Trial of Peanut Consumption in Infants at Risk for Peanut Allergy. (G Du Toit et al, New England Journal of Medicine 372:803, February 26, 2015.) Interesting picture at the very end; it wasn't there in the preprint.
Other comments...
One type of question that is open is the long term consequences of the treatment. Does resistance to allergy development continue? Does it depend on continued peanut consumption?
The suggested treatment here is for preventing the development of peanut allergy. Don't mix this up with using peanut protein to treat peanut allergy.
Since we have referred to this as a clinical trial of a medical treatment, we should note that it was not double-blind. The children -- or at least their caregivers -- knew which group they were in. However, the doctors doing the evaluations did not know.
A reminder that infants should not eat whole peanuts, or other chunky food.
I don't see any previous Musings posts about the development of specific allergies. However, we should remind you that many things affect the immune system, including your microbiome and your genes. Here are examples of posts about such effects...
* Why vaccine effectiveness may vary: role of gut microbiome? (February 27, 2015).
* Bach and the immune system (August 26, 2013).
A post about news coverage of scientific articles: Media hype about scientific articles: Who is responsible? (March 9, 2015).
The only previous post that mentions peanuts: Rendezvous with Lutetia (August 14, 2010).
Another food allergy: Carrot allergy (October 25, 2020).
Bee wars
March 1, 2015
Australian scientists have reported that thousands of deaths have occurred, on both sides, during a four-month war -- between two species of bees fighting over a hive.
Tetragonula carbonaria and Tetragonula hockingsi are two closely related species of stingless bees. They often live near each other, in seemingly peaceful coexistence. Until war breaks out. Then a colony of one species may attack a hive of the other. A months-long battle ensues, with massive deaths and maiming of the female worker bees that do the fighting. (The males just watch.) Some hives have been observed to change hands back and forth between the species multiple times.
A recent article documents one four-month war over a single hive. The article includes war statistics and pictures -- taken from a video.
What triggers two colonies that seem to be coexisting to go to war? No one knows. It's an interesting and mysterious story about the natural world. And the farmers lose their honey crops.
News stories:
* Bees Wage Surprisingly Violent Wars -- And Females Do the Fighting. (Jane J Lee, National Geographic, November 10, 2014. Now archived.)
* WATCH: Australian bees wage brutal hive wars that last for MONTHS. (Science Alert, October 21, 2014. Now archived.) Includes a video; see below.
Video. There is a 1 minute video accompanying the article. The only sound is from the bees; the various scenes are labeled at the top. The video with the Science Alert news story (above) is similar, but unlabelled.
The article: Bees at War: Interspecific Battles and Nest Usurpation in Stingless Bees. (J P Cunningham et al, American Naturalist 184:777, December 2014.) Check Google Scholar for a copy.
More insect warfare...
* The advantage of washing with formic acid (August 8, 2014).
* Origin of gas warfare (September 11, 2009).
More about bees:
* Bee history (February 13, 2016).
* Neonicotinoid pesticides and bee decline (July 12, 2014).
More about war:
* The earliest human warfare? (February 17, 2016).
* Flooding in The Netherlands: natural or manmade? (September 19, 2015).
Why vaccine effectiveness may vary: role of gut microbiome?
February 27, 2015
A recent article shows that the gut microbiome contributes to the response to a vaccine. This is another example of how interconnected our body systems are, and another reminder that the microbiome is one of those systems.
The following figure shows an example of the results. The work here is with mice, but there should be no doubt that effects are likely in humans, too.
|
The basic procedure here was that mice were given a flu vaccine, and the response was measured. The four bars are for four different treatments of the mice. The y-axis is a measure of how much antibody the mice made. The dots show the responses of individual mice. The bar height shows the average for the group.
You can see that the mice of the first (left-hand) group gave a high response, whereas the other mice groups gave low responses. What's going on in those three groups? In each group, in one way or another, the scientists have interfered with the role of the gut microbiome.
|
The first bar is labeled WT. That means the mice were "wild type"; this is the "normal" control. Let's skip the 2nd bar for the moment. The 3rd and 4th bars (the two right-hand bars) are for mice that lack gut microbiota. In one case, it is because they were treated with antibiotics, and in the other case because they were raised as germ-free mice. Both of those groups, lacking normal gut microbiota, gave a poor response to the vaccine.
Back to the 2nd bar. It is labeled Tlr5-/-. That means it is "minus" for the TLR5 gene. (Doubly minus; both copies are defective.) What is TLR5? It is a gene of the innate immune system, which responds to the presence of bacteria in general. Mice in this group have a (presumably) normal gut microbiota, but their immune system is not sensing it normally. The result is a poor vaccine response, just as if their gut microbiota were missing.
This is Figure 2A from the article.
|
In summary, the figure shows that the response to the vaccine depends on the gut microbiome -- and on the immune system sensing that gut microbiome. That is, the work makes a connection between the microbiome and the immune system. That there is such a connection is becoming increasingly clear, but we are just beginning to see its implications.
Further work in the article showed that the effect was significant for some vaccines, but not for others. A clue is that the effect was small for vaccines that included an adjuvant: an additional substance in the vaccine that serves to alert the immune system. It seems, then, that the adjuvant is bypassing the need for the TLR5-dependent response.
A limitation of the work... It shows a connection -- a strong connection -- between the gut microbiome and the vaccine response. But this was done mostly with the microbiota all-or-nothing. A good next question might be: what is the effect of variation of gut microbiota -- both normal and pathological variation -- on the response?
A practical implication of the work, even at this level, is that a person's response to a vaccine may be affected if they are undergoing antibiotic treatment. The authors also raise the question of whether varying effectiveness of the same vaccine in different parts of the world might be due, in part, to local variations in the common gut microbiome.
News story: Intestinal bacteria needed for strong flu vaccine responses in mice. (Medical Xpress, September 11, 2014.)
The article: TLR5-Mediated Sensing of Gut Microbiota Is Necessary for Antibody Responses to Seasonal Influenza Vaccination. (J Z Oh et al, Immunity 41:478, September 18, 2014.) Check Google Scholar for a copy.
The following two posts deal with how people respond differently to either the vaccine or to a flu infection.
* Who gets sick from the flu? (September 20, 2011).
* Predicting vaccine responses (August 22, 2011). From the same lab; in fact, the current article is a follow-up to this earlier work.
Another post that connects vaccine response to a TLR (a different one) that senses bacteria. Does it matter what time of day you get a vaccine? (October 26, 2012).
More on vaccine responses... Sleep deprivation and vaccine effectiveness (March 27, 2023).
Posts on flu and flu vaccines are listed on the page Musings: Influenza (Swine flu).
More on vaccines is on my page Biotechnology in the News (BITN) -- Other topics under Vaccines (general).
More about TLR5: Obesity, gut bacteria, and the immune system (May 24, 2010).
More about the innate immune system: How rice recognizes a Xoo infection (August 28, 2015).
A recent post on the gut microbiome: Fecal transplantation as a treatment for Clostridium difficile: progress towards a biochemical explanation (February 8, 2015).
More about immune responses... Can eating peanut protein reduce the incidence of peanut allergy? (March 3, 2015).
February 25, 2015
Origin of eukaryotic cells: a new hypothesis
February 24, 2015
It's long been clear that mitochondria are closely related to bacteria. This is key background in the common model for how the eukaryotic cell originated. Somehow, an early cell "ate" another bacterium, but instead of digesting it, tamed it; the resulting bacterial symbionts ultimately became mitochondria. This general story of the origin of the eukaryotic cell by endosymbiosis is widely accepted, but little is known about how it actually occurred.
A recent article offers a new hypothesis about how this might have occurred. The new hypothesis makes sense in some ways. Importantly, it makes some predictions that may be testable.
Here are some of the first steps, according to the new proposal...
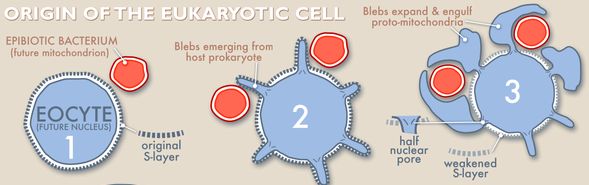
Frame 1 (left) sets the stage... There are two cells, both prokaryotes (archaea and "true" bacteria). One is labeled "eocyte" (a type of archaea). The "S-layer" is the cell wall; the dark line just inside the S-layer is the cell membrane. The other cell is labeled "epibiotic bacterium". "Epibiotic" means that it is on the surface. It may even be an ectosymbiont, with the two cells already having a productive relationship.
In frame 2 (center), blebs -- protrusions of the membrane -- are emerging through the cell wall of the eocyte.
In frame 3 (right), the blebs are engulfing (surrounding) the epibiotic bacteria.
The epibiotic bacteria are on their way to becoming mitochondria, surrounded by a double membrane (their own plus the engulfing membrane). The original eocyte cell still has a membrane around it; that cell is on its way to becoming a nucleus -- with a nuclear membrane. The portions of that cell beyond the nuclear membrane, from the blebs, will become cytoplasm. The sites where the blebs emerge across the wall can become nuclear pores. The S-layer itself will ultimately disappear.
If the two cells already had a symbiotic (productive) relationship, one can imagine how this process might have improved it.
This is trimmed from a figure in the University news release listed below; I have included only the first three frames (out of six). That figure is substantially equivalent to Figure 1 from the article, but better labeled.
|
That's the idea. Remember, it is a hypothesis, or model. The steps proposed seem plausible, but we do not know what happened.
An important feature of this hypothesis is that it offers an explanation for how the eukaryotic nucleus, with its membrane and even pores, arose. That nucleus is almost a defining feature of eukaryotic cells, but common models for the origin of eukaryotic cells are silent on how the nucleus got its membrane. In the new model, a nuclear membrane is intrinsic to the model; it is there from the start. As a result, the authors describe their model as the "inside-out" development of the eukaryotic cell.
There is more to the model. The article is 22 pages, with 209 references. But we can leave it at this for now. The main point is that a plausible and interesting alternative model is on the table. It's premature to spend much time on the little evidence we have. What's important is that active debate on alternative models, and their predictions, is likely to be good, regardless of what the answer turns out to be.
News stories:
* Plausible evolutionary theory suggests eukaryotes might have evolved "inside-out". (Technology.org, October 29, 2014.)
* New theory suggests alternate path led to rise of the eukaryotic cell. (University of Wisconsin, December 12, 2014.) From one of the institutions.)
The article, which is freely available: An inside-out origin for the eukaryotic cell. (D A Baum & B Baum, BMC Biology 12:76, October 28, 2014.) (Authors David and Buzz Baum are cousins -- at universities on different continents.)
More about this model, maybe even some support for it...
* A second Asgard in culture, with an actin-based cytoskeleton (February 19, 2023).
* An Asgard in culture (February 4, 2020).
The endosymbiotic theory for the origin of the eukaryotic cell is noted in Musings posts, including...
* What if a yeast cell contained a bacterial cell? A step toward understanding the evolution of mitochondria? (January 29, 2019).
* A new organelle "in progress"? (September 13, 2010).
* Tarsier; eukaryotic cells (August 31, 2009)
* Origin of chloroplasts (November 17, 2008).
More about the relationship of eukaryotic cells to the archaea:
* Our Loki ancestor? A possible missing link between prokaryotic and eukaryotic cells? (July 6, 2015).
* Are there really three domains of life? (January 12, 2013).
Interestingly, our immune system may still recognize mitochondria as "foreign" under some circumstances... Can you die from an infection without being infected? (March 19, 2010).
The development of an organelle via endosymbiosis is just one possible result of an intimate association between organisms. The whole emerging story about our microbiome fits here. A recent post about another example: More on photosynthetic sea slugs (February 20, 2015).
And...
* Photosynthetic hamster cells (January 8, 2025). An interesting step in the lab.
* Are yeasts important partners in lichens? (September 12, 2016).
* Is the warnowiid ocelloid really an eye? (October 12, 2015).
* The aphid-bacterium symbiosis: a step toward manipulating it (May 15, 2015).
More about nuclear pores: Gemmata obscuriglobus, a bacterium with features of a eukaryotic nucleus? (April 14, 2017).
Expansion microscopy: making an object bigger can make it easier to see
February 23, 2015
Microscopes and telescopes allow us to see things that we could not ordinarily see. However, they have limitations -- and those limitations do limit our knowledge. It's not surprising that we look for ways to make better microscopes and telescopes.
But some of those limitations are fundamental. For example, the laws of optics limit ordinary light microscopes to a resolution of about 200 nanometers (half the wavelength of the light used). There are instruments that get better resolution by using other methods; they are not ordinary image-forming light microscopes. The electron microscope uses electrons rather than visible light; the electrons have a much shorter wavelength, and the electron microscope allows a correspondingly better resolution. A whole suite of new light microscopy methods bypassing ordinary image formation was recognized by last year's Nobel chemistry prize. These are all wonderful developments, but they have their own limitations, and they are expensive.
A recent article offers a new approach to overcoming the common resolution limit of light microscopy. It's clever, and relatively simple.
Here is an example...
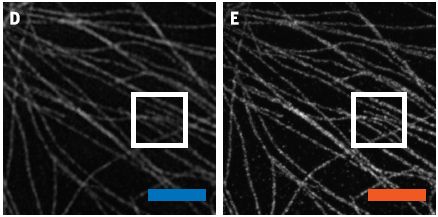
|
The figure shows two images of the same sample. Both were taken using a light microscope. Both are shown here at the same magnification; the scale bar (lower right) is 2 micrometers.
|
The image in E (right side) is clearly sharper. (I hope that survives all the extra steps of getting the figure from the article to your screen.) Why is E the better image? Because the object was made larger before the image was made. The sample was expanded by about a factor of 4. That is, the 2 µm scale bar represents about 8 µm as the sample was photographed; the resulting image was then shrunk down to its normal size. Expand the sample; shrink the photograph.
The sample here is from human kidney cells grown in culture. The structures seen here are microtubules. Much of the work in the article is with mouse brain. The authors claim that they have achieved an effective resolution of about 70 nm.
This is Figure 2 Parts D & E from the article.
|
The above figure shows that if you make an object bigger before taking its picture, it is easier to see. The authors call their method expansion microscopy.
How do they expand the object? Well, it's just like how diapers expand when they get wet. The diapers contain an absorbent material that expands when it gets wet. So does the sample in frame E above. The scientists effectively put the absorbent material inside the sample. What they actually did was to infuse the subunits of the material into the sample; the subunits then reacted (polymerized) to form the absorbent material inside the sample. Once formed, the absorbent material absorbed water and expanded, making the object larger. It really is larger -- about four-fold larger, as seen above.
What kind of absorbent material did they use? The same stuff used in commercial disposable diapers. It is a type of acrylic polymer. It carries charges, which attract water, leading to swelling.
That's the idea. It's simple and inexpensive, and it seems to work. We know little about its limitations at this point, and there certainly are questions about it. A simple limitation is that it wouldn't apply to a material if we couldn't get this expanding material inside. But even if we get it inside, the method assumes that the expansion is uniform -- that there is no distortion of the sample upon expansion. The scientists spend some time on this issue. The method includes special preservation of selected structures. It is not clear how general the method may be.
Expansion microscopy is an intriguing development. We'll learn more about what it can and can't do with further work.
News story: Expanding the brain achieves super-resolution with ordinary confocal microscopes. (Kurzweil, January 16, 2015.)
* News story accompanying the article: Microscopy: The superresolved brain. (H-U Dodt, Science 347:474, January 30, 2015.)
* The article: Expansion microscopy. (F Chen et al, Science 347:543, January 30, 2015.) Check Google Scholar for a freely available pdf of a preprint.
From the Nobel prize site: 'The Nobel Prize in Chemistry 2014 was awarded jointly to Eric Betzig, Stefan W. Hell and William E. Moerner "for the development of super-resolved fluorescence microscopy".'
A recent Musings post about developments in microscopy: A ream of microscopes for $300? (June 22, 2014). It's a good reminder of the basic simplicity of light microscopy.
More...
* Super-resolution microscopy -- without special labels (May 15, 2022).
* How a spider can help you do better microscopy (September 9, 2016).
Also see a section of my page Internet resources: Biology - Miscellaneous on Microscopy.
More about high resolution distance measurements... Can the naked human eye measure distance to nanometer accuracy? (July 20, 2015).
Exoplanet Travel Bureau
February 21, 2015
We have noted several developments in the search for "exoplanets" -- planets beyond our solar system. In our earliest such post, the number of exoplanets known was a few hundred, and there was no hint of any that would be suitable for visiting. The opening of a new travel bureau must be a clue that things have changed.
Check it out... Exoplanet Travel Bureau. The following figure is reduced from one of the posters available there.
Posts about exoplanets include:
* Habitable planets very close to a star (June 19, 2016).
* Habitable Exoplanets Catalog (July 27, 2012).
* The Kepler Orrery (June 3, 2011).
* Extrasolar planets (December 8, 2009).
Posts about how to travel include:
* How rocks travel (November 14, 2014).
* Hyperloop: Ground transportation at near the speed of sound (August 19, 2013).
* Solar taxi (July 14, 2008).
More on photosynthetic sea slugs
February 20, 2015
The sea slug Elysia chlorotica is green -- and photosynthetic. It's green because it maintains functional chloroplasts. It eats algae, but sometimes saves the chloroplasts rather than digesting them. There is controversy about the nature of the system. One interesting claim is that the animal has incorporated algal genes into its own genome. Although each animal must acquire its own chloroplasts, the presence of algal genes in the animal helps to maintain the system. We have noted the sea slug-chloroplast system in earlier posts, including one that questions some of the basic findings [links at the end].
One of the concerns is that some labs have been unable to find evidence that the algal genes claimed to be part of the sea slug genome are actually there. A new article provides evidence that one of those genes is indeed found in the sea slug genome.
Here is the evidence...
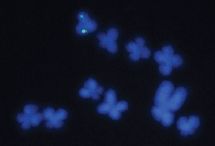
|
Chromosomes of a sea slug probed with an algal gene.
In such an experiment, a probe -- a small piece of DNA -- is made that corresponds to the gene of interest. In this case, that is one of the algal genes that might be in the sea slug genome. The probe is tested to see whether it binds to the sea slug chromosomes. There are two dyes: one on the probe and another that binds to the chromosomes.
|
In the figure you can see several chromosomes dyed with the darker dye. Look at the upper left chromosome. There are two lighter-colored dots. (They are at about the same position on each of two sister chromosomes.) These dots are from the algal gene probe being tested. That's where it binds.
This is trimmed from Figure 3A from the article.
|
That's the evidence that the sea slug genome contains that particular algal gene. (The figure above does not show the complete sea slug chromosome set. The authors note that the only place where they have seen the probe bind is at that one location on that small chromosome.)
Does this solve the problem? Not really. It is one piece of evidence. It is conceivable that the probe is binding something other than the intended algal gene. If the gene is present, why haven't sequencing efforts found it? (They probably are incomplete.) What about the other algal genes that are claimed to be in the slug genome? Noting these concerns is not a criticism of the new work; it's just a statement of its limitations. The scientists have done many good control experiments, which are clearly described in the article. However, one article can not do everything.
At this point, we have some positive results and some negative results, and no explanation for the discrepancy. This result may be a useful step. The system is intriguing, and worth studying further.
News story: Sea slug has taken genes from algae it eats, allowing it to photosynthesize like a plant. (Science Daily, February 3, 2015.) Features a nice picture of the animal -- if you can find it.
The article: FISH Labeling Reveals a Horizontally Transferred Algal (Vaucheria litorea) Nuclear Gene on a Sea Slug (Elysia chlorotica) Chromosome. (J A Schwartz et al, Biological Bulletin 227:300, December 2014.) Check Google Scholar for a copy. A quite readable paper.
Background posts on the sea slugs (oldest first):
* COOL AS HELL! Sea slug that runs on solar power (Really) (November 30, 2008). Links to other posts on photosynthetic animals.
* A challenge to the story of photosynthetic sea slugs (January 7, 2014). This post deals with a challenge to the importance of the photosynthesis to the sea slug animal.
* Photosynthetic sea slugs; species vary (June 9, 2015).
Aside from the fascination with the immediate biological issue here, one reason for interest in this story is that it would seem to represent an example of horizontal gene transfer (HGT) in higher (multicellular) organisms. For more...
* A case of horizontal gene transfer from plant to insect; exploiting it for insect control (April 18, 2021).
* Who's been genetically engineering the sweet potatoes? (June 28, 2015).
* Lesbian necrophiliacs (March 8, 2010).
Also see...
* Are yeasts important partners in lichens? (September 12, 2016).
* Origin of eukaryotic cells: a new hypothesis (February 24, 2015).
February 18, 2015
Genes that make us human: genes that affect what we eat
February 18, 2015
We now know the genome sequences of many primates: modern humans, ancient humans, and more. Comparing these sequences allows us to infer when during history certain traits arose. It allows us to determine when genetic characteristics that are distinctively human arose.
A new article compares the genome sequences of five primates: modern humans, Neandertal and Denisovan humans, an old human labeled as "Montana", and chimpanzees. The focus in this article is genes that may be related to eating.
"Montana" is a 12,000-year-old specimen. It's young enough that it is presumably a "modern" human, but old enough that it requires the methodology for handling "ancient" DNA.
Here is the data set for one analysis...
The gene being analyzed here is called TAS2R62; it is a gene coding for a taste receptor -- a receptor for "bitter".
The figure shows the base sequence for a portion of that gene in the five primates. At the top is the corresponding protein sequence, using the one-letter code for amino acids. For example, the first three bases, TCA, code for serine, shown as S.
You can ignore most of that detail. The big picture is that all five primates have the same genome sequences there -- except for one position. Look at the region that is highlighted, near the middle and marked with a red bar at the top. You can see that a "C" in the chimp genome is now "T" in the four human genomes. That changes the meaning of this position. In fact, it changes it to "stop", shown as * in the amino acid sequence at the top; the new codon there is TAG, which causes termination of the protein chain. The effect of this single base change is to cause the loss of this protein.
This is part of Figure 1 from the article. It is the second case shown there.
|
The results show that chimps have this bitter receptor; humans -- all the humans shown here -- do not. It would seem that absence of this taste receptor is a distinctive part of the human lineage.
The logic is good. This is how one compares genomes to see what changes have occurred, and what effect they might have.
Articles such as this are greeted with long analyses of what this all means. I'll leave that. I would emphasize that although the logic is fine, we do not know how good the data are. How typical are the sequences that were used in this analysis? Is it possible there are errors in the sequences? Perhaps there is another gene that plays the same role in humans, so that there really isn't any loss of function. That's not to minimize the work, just to note its limitations. The first near-complete human genome was reported in 2001; most of the genomes analyzed here were reported within the last five years. It's early; much more such data will become available. Some conclusions will be changed as further information becomes available. Nevertheless, this type of analysis will increasingly supply clues about the differences among the primates -- and the nature of humans.
The article discusses two other cases, in addition to some taste genes. One is a gene for a muscle protein that is expressed in the jaw. It is absent in all the human genomes studied here. The other is the gene for the salivary amylase, a starch-degrading enzyme in the mouth. In this case, it seems that the number of copies has increased mainly for modern humans.
News story: Neanderthal neurograstronomy. (neuroecology, January 30, 2015.)
The article: Insights into hominin phenotypic and dietary evolution from ancient DNA sequence data. (G H Perry et al, Journal of Human Evolution 79:55, February 2015.)
A previous post about modern and ancient human genomes: The First Americans: the European connection (February 8, 2014).
An earlier and limited example of the same kind of analysis: Did Neandertal children hate broccoli? (November 22, 2009). Here scientists reported that a Neandertal was heterozygous for another "bitter" gene. That is, it had two different versions of the gene. The current work extends that story. These results show that Neandertals varied for this trait -- just as humans and chimps do.
More about modern humans and Neandertals... A person who might, just possibly, have met his Neandertal ancestor (June 30, 2015).
More about taste receptors: Mice that try to drink the laser light -- a study of the taste of water (July 9, 2017).
For some perspective on the dramatic increase in available sequences, here is a post about the ninth human genome that was sequenced. The post was almost exactly five years ago. Inuk, a 4000 year old Saqqaq from Qeqertasussuk (March 1, 2010).
There is more about genome analysis on my Biotechnology in the News (BITN) page DNA and the genome. It includes an extensive list of Musings posts on sequencing and genomes.
A post that is less related to the current one than it might seem: Did the First Americans eat gomphothere? (July 29, 2014).
More about chimpanzees... Can chimpanzees learn a foreign language? (March 10, 2015).
Small numbers to the left? Chickens may agree
February 17, 2015
We tend to arrange numbers from smaller on the left to larger on the right. It is apparently instinctive in humans. It is as if we have some biologically ingrained sense of number line that goes from left to right.
A new article suggests that baby chickens do, too. It's an intriguing article.
Here is an example of how the scientists tested the chicks for their sense of number line...
In part A (top frame), the chick is being trained. The panel has 20 dots; the chick is being trained that 20 is "normal" or the "target".
In the lower two frames, the trained chick is tested. In part B (lower left), both panels have 8 dots. In part C (lower right), both panels have 32 dots. In B, the chick goes to the left; in C, it goes to the right.
This is Figure 2 from the article. See the article for more complete details of the testing. There are some worms involved, to attract the attention of the chicks.
|
The authors interpret these test results as follows... In B, the chick sees two panels with a smaller number of dots than were in the training panel. Therefore it goes to the left -- because 8 is less than 20. In C, the chick sees two panels with a larger number of dots than were in the training panel. Therefore it goes to the right -- because 32 is more than 20. That is, the response of the chick is based on comparing the current situation to the training situation.
Note that there are at least two steps, according to this interpretation. First, the chick is making a numerical comparison. Second, it is responding to that comparison in a certain way.
The figure above shows the results of single tests. The scientists accumulated considerable data for such tests. The summary of those data is quite interesting; it is shown in the following figure.
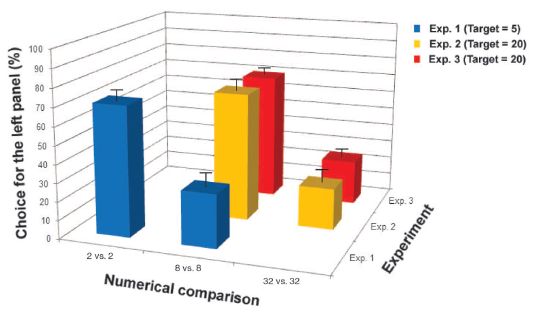
The first thing that is striking is that there are two very distinct types of results: tall bars and short bars. Error bars are shown; they are small compared to the difference between the two types of response. There is something going on here.
The bar height is the percent of responses where the chick went to the left; see the z-axis scale at the left. That is, tall bars are "left" and short bars are "right".
There are three experiments summarized here; see the y-axis scale at the right, and the "key" at the upper right. Each experiment is generally like the one discussed above. Let's walk through them.
In experiment 1, the chicks were trained on a target value of 5; see the key. They were then tested on 2 and 8. The x-axis, "numerical comparison", is labeled with things such as "2 vs 2". As we noted above, during a test the chick is faced with two panels with the same number of dots. They are not comparing the two test panels with each other, but comparing them with the target panel used for training. In this case, 2 < 5, and the chicks went to the left (tall bar). But 8 > 5, and the chicks went to the right (short bar).
In experiment 2, the chicks were trained on a target value of 20. They were then tested on 8 and 32. This is the case we discussed above with the top figure. 8 < 20, and the chicks went to the left (tall bar). But 32 > 20, and the chicks went to the right (short bar).
Experiment 3 is a repeat of experiment 2; the results are quite similar.
This is Figure 3 from the article.
|
We should note one more feature of the results. Look at the tests for "8 vs 8", which was included in each experiment. They gave different results depending on the target. If 8 was more than the target (experiment 1), the chicks went to the right; if 8 was less than the target (experiments 2 and 3), the chicks went to the left. This set of results is consistent with the interpretation that the chicks were comparing the test panels with the training target.
What do we make of this? I must say I am quite impressed by two things here. First, the test is quite clever. Second, the results seem to show clear effects. The question must be, what does this all mean? The authors offer an interpretation. Fair enough, but it may or may not be the correct interpretation.
If chicks and humans do share a feature relating to the number line, it opens the question of why. There are many possible reasons. For example, it might reflect some important feature of brain organization that is conserved in all vertebrates, or it might be a coincidence. I think it is premature to worry much about this for now. I think we can appreciate the quality of the work here, and yet realize that the significance is open.
News stories:
* Like Humans, Chicks Count Left to Right -- The findings suggest that the direction of the mental number line may have deep biological roots. (AAAS, January 30, 2015.)
* In the mind's eye of a bird brain. (Why Files, January 29, 2015. Now archived.)
* News story accompanying the article: Animal behavior: Chicks with a number sense -- Chicks and humans map numbers to space in a similar way. (P Brugger, Science 347:477, January 30, 2015.)
* The article: Number-space mapping in the newborn chick resembles humans' mental number line. (R Rugani et al, Science 347:534, January 30, 2015.)
The idea of a mental number line has come from work with humans. An interesting question is whether it holds for those who use a written script that goes from right to left. Apparently, those who read Arabic think of numbers going from right to left. One possibility is that there is an innate number line, but that it can be overridden. This all needs further work.
More about chicks doing math -- from the same lab: Animals counting -- more (July 13, 2009).
More about chickens: Can chickens prevent malaria? (August 12, 2016).
More animal math:
* Do bees count left-to-right? (January 3, 2023).
* Monkey math (June 1, 2014).
There is more about math on my page Internet resources: Miscellaneous in the section Mathematics; statistics. It includes a listing of related Musings posts.
CRISPR: an overview
February 15, 2015
Musings has noted the CRISPR system in several posts. CRISPR is a recently discovered system that seems to serve as something like an adaptive immune system in bacteria. Understanding how it works has led to the development of new tools for molecular biology, such as for gene editing.
Science journalist Carl Zimmer has a new article for a popular science magazine providing an overview of CRISPR. It is aimed at "the general public"; it discusses how scientists uncovered CRISPR and some of the developments toward application. I recommend it for those who would like a broad overview of CRISPR.
The article, which is freely available: Breakthrough DNA Editor Borne of Bacteria -- Interest in a powerful DNA editing tool called CRISPR has revealed that bacteria are far more sophisticated than anyone imagined. (C Zimmer, Quanta, February 6, 2015.) Quanta is an online magazine published by the Simons Foundation to "enhance public understanding of research developments in mathematics and the physical and life sciences".
Video. The article includes a 4-minute video provided by the Zhang lab at MIT. It has little depth. Enjoy if you wish for the visuals, but don't expect much of it.
Here is a list of posts about CRISPR; I think the list is complete. I have expanded this list to include work with other gene-editing techniques, such as transcription activator-like effector nucleases (TALENs) and zinc finger nucleases (ZFNs). I have also included an item on editing the epigenome.
** Also see "updates" at the end of this post.
* Treating prion disease with CHARM, to reduce production of the prion protein (August 21, 2024). Epigenome editing: changing gene expression without modifying the genome sequence itself.
* Briefly noted... Progress toward making a more people-friendly (hypoallergenic) cat (May 5, 2022).
* Improving the accuracy of CRISPR: SuperFi Cas (March 21, 2022).
* Briefly noted... Using CRISPR to make better bananas (August 25, 2021).
* Treating progeria by editing the gene (March 23, 2021).
* Can you detect the SARS-2 virus with your phone? (March 2, 2021).
* Reactivating fetal hemoglobin production to treat β-hemoglobin problems - II (February 16, 2021). Includes an update on FDA approval; added December 11, 2023.
* Briefly noted... (January 15, 2020). Two brief notes.
* What if CRISPR teamed up with graphene? (September 6, 2019).
* Distinguishing pathogenic and benign BRCA1 mutants: a high-throughput test (January 26, 2019).
* CRISPR connections: p53? cancer? (October 6, 2018).
* CRISPR: Making specific base changes -- at the RNA level (February 20, 2018).
* Laika, the first de-PERVed pig (October 22, 2017).
* Update: Controversial article about an alternative to CRISPR is retracted (August 9, 2017).
* Making a functional mouse pancreas in a rat (February 17, 2017). (TALEN)
* Improving soybean oil by gene editing (January 8, 2017). (TALEN)
* CRISPR: First clinical trial in humans (November 28, 2016).
* CRISPR notes (October 11, 2016). Notes the proposed NgAgo system, and other alternatives under development.
* Using CRISPR to change cell fate (September 10, 2016).
* Finding host genes that are required for growth of Zika virus (and related viruses) (August 8, 2016).
* Polled cattle -- by gene editing (July 8, 2016). Uses TALEN.
* It's CRISPR vs HIV -- and HIV might win (April 17, 2016).
* CRISPR commentary (January 27, 2016).
* How to do 62 things at once -- and take a step towards making a pig that is better suited as an organ donor for humans
(January 17, 2016).
* Organ transplantation: from pig to human -- a status report (November 23, 2015).
* An obesity gene: control of brown fat (October 2, 2015).
* CRISPR and editing of the human germline: the ethical line? (May 4, 2015).
* CRISPR: the legal battles begin (February 1, 2015). Notes the CRISPR Nobel.
* A step towards correcting mutant genes with CRISPR (October 7, 2014).
* Down syndrome: Could we turn off the extra chromosome? (November 15, 2013). ZFN.
* CRISPR: What's it doing to help bacteria carry out infections? (September 8, 2013).
* Exploiting the bacterial immune system as a tool for genetic engineering: The Caribou approach (May 4, 2013).
* A virus with an immune system -- stolen from a host? (March 25, 2013).
* Gene therapy: Curing an animal using a ZFN (August 9, 2011). ZFN.
More about gene therapy is on my Biotechnology in the News (BITN) page Agricultural biotechnology (GM foods) and Gene therapy. It includes a list of related Musings posts.
More about immune systems: How rice recognizes a Xoo infection (August 28, 2015).
More from Quanta magazine: The comb jelly nervous system -- more (April 17, 2015).
Update November 30, 2023.
A general description of CRISPR is that it is "programmed" by RNA to a DNA target -- which it then cuts. With the attention on CRISPR, many such enzymes have been found in bacteria. More recently, enzymes with similar properties were found in eukaryotes; these enzymes are called Fanzors. A new article reports that these CRISPR-like enzymes from eukaryotes are widespread. This article alone reports over 3600 of them. The large data set allows exploring their origins; it is clear that such enzymes arose more than once. Further, the larger collection can be examined for features that may be useful in the lab -- or clinic.
* News story: Thousands of programmable DNA-cutters found in algae, snails, and other organisms -- New research finds RNA-guided enzymes called Fanzors are widespread among eukaryotic organisms. (Jennifer Michalowski, MIT News, October 13, 2023.)
* The article, which is open access: Programmable RNA-guided DNA endonucleases are widespread in eukaryotes and their viruses. (Kaiyi Jiang et al, Science Advances 9:eadk0171, September 27, 2023.)
Boston is leaking
February 13, 2015
Yes, Boston is leaking. It's leaking enough to be the focus of attention in a new article in the prestigious scientific journal Proceedings of the National Academy of Sciences.
Leaking methane.
In a sense, that's not news. We might expect some methane leakage from any area using natural gas. What's news is that the rate of methane leakage in the Boston area is 2-3 times the previous official estimate.
What the scientists did was straightforward. They set up sensors in various places, and recorded what they found. They then took the data and integrated them into a mathematical model, to get an estimate of the overall emissions.
There are many potential sources for methane. Distinguishing them can be difficult -- yet is important for understanding the methane story. In this work, the scientists measured ethane as well as methane. (Methane is CH4; ethane is the related compound C2H6.) Natural gas, which is made by chemical processes deep within the Earth, contains substantial amounts of ethane along with the methane. Methane produced by biological processes, such as by the microbes in cows or wetlands, has no ethane. Measuring both methane and ethane helps them to separate the contributions of natural gas and bio-gas.
Perhaps this is a good news - bad news story. It's certainly bad news to learn that the methane emissions are higher than we had thought. But the good news is that we actually know now -- or at least know more than we did.
Methane is an important greenhouse gas; understanding the various ways it gets to the atmosphere is important. Recognizing which sources are most important is a step toward reducing methane emissions. There is a self-interest economic incentive to reduce losses of natural gas in the distribution system. Further, reducing such losses should result in increased safety of the system. Whether those incentives are large enough to result in action is questionable. It may well be that the collective action of the public, through the political system, is needed to promote reductions in greenhouse gas emissions. But doing that comes with a responsibility to get it right.
News stories:
* Methane Leaks From Gas Pipelines Far Exceed Official Estimates, Harvard Study Finds. (Inside Climate News, January 28, 2015.)
* Leaks in Boston area gas pipes exceed estimates. (Boston Globe, January 22, 2015.) I thought it would be nice to include a good news story from the relevant local newspaper, but there seems to be some access limitation. If you can't access this, don't worry about it.
The article, which is freely available: Methane emissions from natural gas infrastructure and use in the urban region of Boston, Massachusetts. (K McKain et al, PNAS 112:1941, February 17, 2015.)
There are background posts on methane emissions. They cover a range of sources of methane, both "natural" and manmade. Some of the posts deal with attempts to analyze the scope of methane emissions. Methane posts include:
* Space-based observation of atmospheric methane -- and the Four Corners methane hotspot (December 29, 2014).
* Quality of oil and gas wells -- fracking and conventional (August 18, 2014).
* Methane leaks -- relevance to use of natural gas as a fuel (April 7, 2014).
* Svalbard is leaking (March 7, 2014).
And newer posts... Los Angeles leaked -- big time! (April 29, 2016).
More about CH4 and climate change: Climate change: Should we focus on methane? (March 24, 2012).
and... How rice leads to global warming, and what we might do about it (September 2, 2015).
There is more about energy issues on my page Internet Resources for Organic and Biochemistry under Energy resources. It includes a list of some related Musings posts.
More about Boston:
* Is Arctic warming leading to colder winters in the eastern United States? (May 11, 2018).
* Traffic congestion patterns analyzed from cell phone records (July 7, 2013).
* See cat run (March 14, 2012).
February 11, 2015
Polio-like disease without polio virus? Follow-up
February 11, 2015
Original post: Polio-like disease without polio virus? (March 17, 2014).
In that post we briefly noted the occurrence of polio-like illnesses without polio virus. We had only a meeting report, and that had only scant evidence. That was a year ago. Where are we now on this story? As the story has developed, there is some evidence linking the new disease to the emergence of a new virus.
The virus is called enterovirus D68. Using "EV" for enterovirus, it is EV D68. We should note that the term "enterovirus" describes a type of virus, and not necessarily where each virus prefers to grow. In fact, EV D68 seems to mainly cause respiratory illness. Poliovirus itself is an enterovirus; it typically grows in the gastrointestinal track, but causes serious illness when it occasionally grows in the nervous system.
A new article offers a study of one recent cluster of cases. The bottom line is that the concern continues, but that we still lack clear evidence.
The heart of the article is reporting and analyzing a cluster of cases from a particular hospital. The following figure sets the stage.
|
The graph includes two lines, showing the number of admissions for respiratory cases (y-axis; left scale) during a certain period of the year (x-axis; it covers August-October).
The "upper" line (with red triangles) is for 2014. The "lower" line (green squares) is the average for the preceding two years.
There is a clear peak for the 2014 curve.
|
The bars show the number of polio-like neurological cases during the same time period. For the meaning of the bar height, see the y-axis scale on the right. There is a peak of neurological cases that roughly corresponds with the peak of respiratory cases. The authors explain that the frequency of such neurological cases is higher than observed at any other time in recent years.
This is Figure 1 from the article.
|
The overall observation, then, is that the graph shows a peak of respiratory illness and a peak of polio-like illness at roughly the same time at this one hospital.
The 12 cases of polio-like neurological disease shown on the graph were studied further, with various techniques. Of particular interest here is that the enterovirus D68 was found in the nasal secretions of 5 of the 12. That is an intriguing but unclear result. The article contains considerable discussion of what that number means, including reasons why it may be underestimating the role of EV D68.
So where are we? It's not clear. Hints of an association between EV D68 and a polio-like illness continue, but it is hard to get clear answers. One role of an article such as this will be to promote better analysis of future clusters that may occur.
News stories:
* Outbreak of rare respiratory virus could be linked with paralysis in 12 Colorado children. (Science Daily, January 29, 2015.)
* Report on polio-like illness in kids supports link to EV-D68. (CIDRAP, January 29, 2015.) A longer but excellent overview of the work; typical of CIDRAP.
* Editorial accompanying the article: Acute flaccid myelitis and enteroviruses: an ongoing story. (A Mirand & H Peigue-Lafeuille, Lancet 385:1601, April 25, 2015.)
* The article: A cluster of acute flaccid paralysis and cranial nerve dysfunction temporally associated with an outbreak of enterovirus D68 in children in Colorado, USA. (K Messacar et al, Lancet 385:1662, April 25, 2015.)
More about this new virus: An enteric virus has acquired the ability to infect neurons; relevance to emerging polio-like illness? (October 22, 2018).
Previous Musings post on polio: Polio: Another country may be getting close to eradication (December 8, 2014).
More -- and closely related to above item... Polio eradication: And then there were two (July 27, 2015).
My page for Biotechnology in the News (BITN) -- Other topics includes a section on Polio. It includes a list of Musings posts on the topic.
The largest -- and most distant -- planetary ring system
February 9, 2015
Shall we show the real thing? or the pretty picture?
A planetary ring system. It's about 200 times larger (across) than the ring system of Saturn.
If Saturn had this ring system, we would be able to see it with the naked eye; it would be larger than the Moon.
This ring system is around the planet J1407b, which orbits the star nicknamed J1407. (The star's full name is 1SWASP J140747.93-394542.6.)
This is reduced from the picture in the University news release listed below.
|
No one has ever seen this ring system. No one has ever seen the planet J1407b. The picture above is an "artist's conception".
An artist's conception, but based on real data, as reported in a new article. Here are the data that led to that picture...
The graph shows the light intensity (y-axis) versus date of observation (x-axis). Light intensity = 1.0 is the background. Dips in light intensity show that something has come between the light source and the observer.
The x-axis time scale is in days, as labeled. If you are wondering about the unusual numbers... The dates are modified Julian dates (MJD). An MJD is the number of days since "the beginning of time", which for the MJD scale is November 17, 1858.
The red dots show the data. The green curve is the line the scientists fit to the data.
The light source here is the central star. The complex pattern of light intensity dips is interpreted as a ring system. The scientists use the green line as the basis for drawing out the ring system.
This is the top part of Figure 4 from the article. I have edited it to add a label for the y-axis. Fig 5 of the article is their drawing of the ring system based on these data. It also shows the observation path. It's a nice picture, too, but not as nice as the artist's conception shown above.
|
This is a nice article, on several counts. It leads to the beautiful picture shown above, but there is quite a story behind that picture.
The basic methodology is measuring the light intensity from a source, and making inferences about what is causing the fluctuations. The Kepler hunt for extrasolar planets uses this method. The light curve, shown above, is incredibly complex. It's a significant mathematical process to deduce that it might be caused by the ring system shown. The scientists have shown the best result they could fit to the data at hand, but they caution that the result is not unique. As you can see, there are substantial gaps in the data set, as well as uncertainties in the measurements. The model should be taken as tentative, pending further observations. It is possible that it is substantially wrong. Remember, neither the rings nor the planet have been directly seen.
The analysis leads to what is, for now, the largest and most distant known ring system. It even leads to the inference of at least one small moon embedded in the ring system, creating the observed gap. It's a good story. Let's see what follows from it.
News story: Gigantic ring system around J1407b much larger, heavier than Saturn's. (University of Rochester, January 26, 2015.) From one of the institutions involved.
The article: Modeling Giant Extrasolar Ring Systems In Eclipse And The Case Of J1407b: Sculpting By Exomoons? (M A Kenworthy & E E Mamajek, Astrophysical Journal 800:126, February 20, 2015.) A preprint of the accepted article is freely available at ArXiv. A quite readable article, though you may want to skip some of the more technical parts.
Another example of rings being inferred from a transit: Rings for Chariklo (May 9, 2014). Compare the complexity of the light intensity data in this post with that shown above.
Rings that really have been seen: Venus: an unusual view (March 18, 2013).
A post about the Kepler telescope, and its search for planets by looking for transits... A new trick for the Kepler planet-hunters (June 25, 2012).
Fecal transplantation as a treatment for Clostridium difficile: progress towards a biochemical explanation
February 8, 2015
The bacterium Clostridium difficile, or "C dif", can lead to serious debilitating illness and even death. In recent years, it has been shown that fecal transplantation is a useful treatment for C dif infections. The idea is that the fecal transplant, from a normal and healthy donor, helps to restore the normal gut microbiota in the ill recipient. That normal microbiota serves to dampen the C dif growth, just as it does in normal healthy people.
Fecal transplantation may be effective, but questions remain. Can we learn more about how it works? Are certain bacteria particularly important in reducing C dif growth? Can we understand why? In fact, a previous post showed that a defined mixture of bacteria could serve as an effective treatment [link at the end]. That result was with mice, but similar results have since been obtained with humans.
A new article offers a biochemical explanation for how the gut microbiota can control the growth of C dif.
Here is an example of the results...
|
In this experiment, the growth of C dif was measured under various conditions.
The first (clear) bar is the control. The bar height is about 6. It's a log scale, so the 6 means that the C dif grew to about 106 bacteria per milliliter. (The y-axis says "c.f.u."; that stands for "colony forming units". One can interpret cfu as bacteria; one bacterial cell is one colony forming unit.)
|
The second (black) bar shows greatly reduced growth; the bar height is more than one log lower; that means the inhibition was greater than 90%. How was this achieved? By adding "C. scindens", it says. That is Clostridium scindens, another type of bacteria of the same genus as C dif, but one that is harmless.
The third (gray) bar shows what happens if we add two things. One is those same C. scindens bacteria; the other is a chemical called cholestyramine. Comparing the third (gray) bar with the second (black), we see that the cholestyramine reverses the inhibition caused by the C. scindens bacteria.
This is Figure 4f from the article.
|
That's the effect. Another bacterium can inhibit C dif, but adding a specific chemical reverses that inhibition. That specific chemical offers a clue about how the bacteria work.
What do we make of that clue? What is the cholestyramine doing? It absorbs bile salts, which were present in these growth tests.
Further work in the article showed that the C. scindens bacteria have an enzyme that can modify bile salts to make something that inhibits C dif. So the pieces fit: C. scindens makes an inhibitor, but only if bile salts are present.
What are the implications, if this explanation is supported by further work? We are now treating C dif with fecal transplantation. It's an effective treatment, but there are concerns about it. Perhaps we could treat with this one inhibitory bacterium. Or perhaps we could treat with the inhibitory compound it makes. These are examples of how the current work may be followed up.
The work here is largely with mice. However, some exploratory work suggests that C. scindens is also important in humans.
Is C. scindens and bile acids the entire story? The article suggests not, but that it is a big piece of the story. This, too, can be studied further.
In any case, this article is a step toward understanding what is going on when fecal transplantation is used to treat C-dif.
News story: Microbes Fight Chronic Infection. (Chris Palmer, The Scientist, October 22, 2014.) Now archived.
The article: Precision microbiome reconstitution restores bile acid mediated resistance to Clostridium difficile. (C G Buffie et al, Nature 517:205, January 8, 2015.) Check Google Scholar for a copy of a preprint.
A background post on C dif: A bacterial cocktail to fight Clostridium difficile (January 19, 2013). In the work discussed here, it was found that a set of lab-grown bacteria could substitute for whole feces.
More C dif:
* A drug to treat the gut microbiome (February 25, 2023).
* Influence of the food additive trehalose on Clostridium difficile? (February 23, 2018).
Another use of fecal transplantation: Can fecal transplantation be useful in treating cancer? (April 27, 2021).
* A recent post on the gut microbiome: Artificial sweeteners: Saccharin and high blood sugar levels (December 7, 2014).
* Next: Why vaccine effectiveness may vary: role of gut microbiome? (February 27, 2015).
A post about another toxin-forming Clostridium: A new botulinum toxin -- and a story of how we deal with dangerous things (July 11, 2015).
Why are some types of cancer more common than others?
February 6, 2015
A new article offers some insight into the origins of cancers. The article has attracted considerable news attention and has provoked controversy. This comes from the complexity of the article, which has resulted in claims that were not intended. Let's see if we can sort some of this out.
We should start with a very broad perspective. There are many kinds of cancers. Lung cancer is a different disease than pancreatic cancer. In fact, there are multiple kinds of lung cancers. Cancers, in general, may be due to many things. For example, they may be due to natural accumulation of errors (mutations) during a normal lifetime, and they may be influenced by external factors, such as ultraviolet light or tobacco smoke. The genetic makeup of each individual affects how each of those possible processes plays out. The point, for the moment, is not to weigh the relative importance of those causes, but to lay out the possibilities.
The following figure summarizes the main findings of the new article. It is also the basis of much of the controversy.
This is Figure 1 from the article.
|
The figure shows a relationship between the frequency of cancer of a particular type (y-axis) and the number of cell divisions in the relevant stem cell population (x-axis). You can see that there is a general trend: more stem cell divisions correlates with a greater lifetime risk of getting that particular cancer type. It's a log-log graph, covering several powers of ten on each axis. The explanation is that the more stem cell divisions there are, the more chance there is for mutations to accumulate.
One can draw a straight line through that data set, to give an idea of the relationship. Analysis of that best-fit curve gives a correlation coefficient, r, of about 0.8. That gives r2 = 0.64, which is about 2/3. The interpretation of the r2 value is complex -- especially since the graph is log-log. (It would have been nice if they had shown the line.)
Some news coverage has suggested that the r2 value means 2/3 of cancers arise from the random mutations inferred from the graph; that is simply incorrect.
What it means is something like this... Some kinds of cancers are more common than others. One reason some kinds are more common is that the stem cells that give rise to them divide more often, and thus have more chance to accumulate mutations. Overall, the graph suggests this is a major contributor to why some kinds of cancer are more common. The r2 value applies here. We might say, loosely, that 2/3 of the reason why one cancer is more common than another is due to the number of stem cell divisions (ignoring the log issue). The actual number of cancers depends on this and other things.
It's a plausible trend. Cancer is caused, at least in part, by mutations. The more cell divisions there are, the more chance for mutations to accumulate. The chance of cancer thus increases with cell divisions -- especially the relevant stem cell divisions. It is greater with age, and it is greater in tissues with more stem cell divisions. If there are more stem cell divisions, there are more steps where an environmental or genetic effect might act.
The authors do another analysis. A simple view is that they look to see which cancers are above the line and which are below it. The actual analysis is more complex than that, but that is the general idea. This leads to a new score, called the adjusted extra risk score (aERS) for each type of cancer. It measures how far each cancer type is from the trend line.
The following graph displays those aERS scores, in order from smallest to largest. (A score of zero would mean that the cancer falls right on the trend line.)
This is Figure 2 from the article.
|
To get the idea of what the figure shows... The highest aERS score in this figure, at the extreme right, is for FAP colorectal cancer. Look at the first figure, and you will see that this cancer is well above the trend line. On the other hand, pancreatic islet cancer, at the extreme left with the lowest aERS score, is below the trend line.
The authors suggest that cancers with high aERS scores are likely to have other factors contributing substantially, beyond the stem cell division effect. That is the "extra risk" part of aERS. They note certain cases where that prediction seems to be correct. Colon cancer is one, where the extra risk factors are well known. Also note that there are two points for lung cancer on the graphs. One is for smokers, one for non-smokers. The lifetime risk of lung cancer for smokers is much higher due to the extra risk factor.
Other predictions are not correct. For example, they predict that melanoma would have small extra effects; it is at -1.62 on the figure above. However, it is known that melanoma is greatly affected by the environment (sunlight).
So what's the message? Well, it's mixed. There may be various reasons for the discrepancies, including that some of the available data are not very good. The analysis of this figure seems to be a good idea, but imperfect at this point.
The article is complex. That should not be a surprise. It deals with the broad topic of the causes of cancer, and it is quite mathematical in approach. It does not lend itself to simple summary. I think the article is a useful contribution, in helping us see how many factors contribute, and how types of cancer vary. But be cautious about the details.
News stories:
* 'Bad luck' of random mutations plays predominant role in cancer, study shows. (Science Daily, January 1, 2015.)
* Two-thirds of adult cancers largely 'down to bad luck' rather than genes. (Guardian, January 2, 2015.) A newspaper story, from a newspaper that tends to do a good job of reporting science. But this story is a mix: some good description of what the article reports, plus considerable misinterpretation of what it means. The title is an example of the latter.
* Bad Luck of Random Mutations Plays Predominant Role in Cancer, Study Shows -- Statistical modeling links cancer risk with number of stem cell divisions. (Johns Hopkins University, January 1, 2015, with an Addendum January 7, 2015. Now archived.) From the institution where the work was done. It's interesting that they have responded to the controversy surrounding the article with the addendum, which is at the top of the page.
There are two news stories in the journal that published the article. One accompanied the article, as usual. The second was a follow-up, by the same reporter, two weeks later.
* News story accompanying the article: Biomedicine: The bad luck of cancer. (J Couzin-Frankel, Science 347:12, January 2, 2015.)
* News story follow-up: Science Communication: Backlash greets 'bad luck' cancer study and coverage -- How subtleties got lost in the telling. (J Couzin-Frankel, Science 347:224, January 16, 2015.) Kudos to Jennifer Couzin-Frankel for publishing this follow-up story. She reflects on the problems with the initial news coverage, including her own, and offers some insight into how it happened. I would like to emphasize... This is a story of the difficulties of good science communication, a problem I struggle with constantly in doing these posts. Let's not play blame-game. For the reader, I think the message is to be cautious about what you read, no matter the source.
* The article: Variation in cancer risk among tissues can be explained by the number of stem cell divisions. (C Tomasetti & B Vogelstein, Science 347:78, January 2, 2015.) Check Google Scholar for a copy.
Follow-up: Why are some types of cancer more common than others? Follow-up (January 24, 2016).
A post about news coverage of scientific articles: Media hype about scientific articles: Who is responsible? (March 9, 2015).
Also see:
* Why do elephants have a low incidence of cancer? (March 20, 2016).
* The role of combinations of chemicals in causing cancer? (September 21, 2015).
My page for Biotechnology in the News (BITN) -- Other topics includes a section on Cancer. It includes a list of some other Musings posts on cancer.
February 4, 2015
An animal that walks on five legs
February 3, 2015
The tail is a distinctive feature of large kangaroos, and is known to be important during hopping. But what about during ordinary walking?
A recent article reports an analysis of kangaroo walking. It includes video footage, and force measurements.
Look...
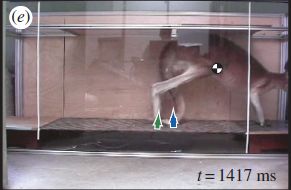
|
One "still" from a movie of a kangaroo walking. You can see that both a leg and the tail are in contact with the ground.
You can't conclude from a single still what the role or importance of the tail is. So, go watch the movie.
This is Figure 1e from the article. The arrows are force vectors; the black-and-white circle on the animal is its approximate center of mass.
|
Movie: Pentapedal locomotion. (YouTube. 38 seconds, no sound. Also available with the news story and with the article.)
That's what it looks like. But still, that doesn't tell us how important the tail is. To get at that, the scientists recorded the forces exerted by tail and legs on the floor. That floor you see above is equipped to be a force-measuring platform. The answer: The tail is carrying more than its share of the load. In fact, the muscular tail serves to propel the animal during its walking gait. The authors conclude that the tail and four legs are used together during walking, in an integrated process.
There is no big surprise here. The importance of the large muscular tail during hopping is well established, and the use of the tail during walking is easily observed. On the other hand, the tail does not look like a leg; anatomically, it is quite different. The importance of the new article is to provide a quantitative understanding of the biomechanics of kangaroo "pentapedal" walking.
News story: Unique Among Animals, Kangaroos Use Tail as Fifth Leg, Scientists Find. (Traci Watson, National Geographic, July 1, 2014. Now archived.) Caution, the subtitle of the story confuses hopping and walking. The new work is about walking.
The article: The kangaroo's tail propels and powers pentapedal locomotion. (S M O'Connor et al, Biology Letters 10: 20140381, July 2014.) Check Google Scholar for a copy.
* Previous post on kangaroos: The kangaroo family tree: the American ancestry of kangaroos (August 13, 2010).
* Next... Handedness in kangaroos: significance? (July 31, 2015).
More on walking:
* An exoskeleton that assists with walking but does not require an external energy source (September 8, 2015).
* "Moonwalkers" -- flies that walk backwards (May 28, 2014). Links to more.
More about "walking" with five "limbs": Where is the front of the circle? How a brittle star moves (July 3, 2012).
Other posts about tails include:
* A mammalian device for repelling mosquitoes (December 10, 2018).
* What has six tails -- and is beyond Mars? (November 20, 2013).
* What if you had eyes on your tail? (July 27, 2013).
Blood thinning: a new approach
February 2, 2015
Blood clotting is essential to recovery from bleeding, but blood clots can be dangerous, if they block blood flow. Thinning the blood -- making it harder to clot -- may be a medical necessity, but it is a delicate matter; excessive thinning can promote bleeding.
A recent article offers a new approach to thinning the blood, one that the authors argue may have a better ratio of benefit to harm. The specific context of interest is treatment for a heart attack.
The following chart shows the idea. It's complex, but following even part of it will help you see why the proposed method is worth considering. We'll walk through key parts of it below.
The figure outlines the phenomena that are considered here, showing why using the enzyme apyrase might be beneficial. I have included the original figure legend, for those who want more than my brief description.
This is Figure 1 from the article.
|
Let's look at some parts of this. The left-hand column, labeled Metabolites, lists four chemicals, all of which are normal biochemicals. At the top is adenosine triphosphate, or ATP; it has three phosphate groups. These are removed one at a time as we go down; the final chemical is adenosine, labeled ADO, with no phosphates left. The "e" in front of various chemical names means extracellular; we are dealing here with ATP free in the blood, not the ATP doing its normal job inside the cells.
Two enzymes are needed to convert ATP (top) to ADO (bottom). One is apyrase, the subject of the study; it carries out the first two steps. The final step is done by another enzyme, which is ubiquitous. The enzymes are shown alongside the arrows from one chemical to the next.
Briefly, the new proposal is to treat with the enzyme apyrase, to convert metabolites near the top of the column to those near the bottom.
Why might that be useful? Because, at least in this context, the ones near the top are harmful and the ones near the bottom are good. That's what the rest of the chart is about.
Look to the right of ATP. The chart shows, at various levels of detail, that ATP is proinflammatory. The ATP row branches into the ADP row; both are prothrombotic -- meaning that they promote clotting. In contrast, the ADO row shows that it is anti-inflammatory and antithrombotic. So, if there is too much clotting, the enzyme apyrase, converting ATP to ADO, could be good.
The chart also shows an example of a drug currently used to reduce clotting. It's called clopidogrel, and is shown just below the ADP row. It inhibits one step on this chart, as shown by the red X.
That's the idea. Does it work? The article reports some results that are encouraging. Apyrase is a normal enzyme in the body. The scientists developed a modified version of the enzyme, more suitable for use as an added drug. They treated dogs that had an experimentally-induced heart attack. The apyrase treatment helped minimize damage following the heart attack. We'll leave the details for now, having spent considerable time on the idea. But the authors conclude that the apyrase treatment is worthy of further work. Trials in humans are imminent.
News story: Experimental heart attack drug reduces tissue damage, minimizes bleeding risk. (Washington University of St. Louis, August 12, 2014.) From the lead institution.
The article: Optimizing human apyrase to treat arterial thrombosis and limit reperfusion injury without increasing bleeding risk. (D Moeckel et al, Science Translational Medicine 6:248ra105, August 6, 2014.)
More about another role of adenosine, ATP, and such: How acupuncture works: another clue (September 2, 2010). Includes the chemical structures of ATP and adenosine.
More about blood clotting:
* Mechanism of blood clotting: how the von Willebrand factor works (May 18, 2021).
* Gene therapy: Could we now treat Queen Victoria's sons? The FIX Fix. (January 6, 2012).
Also see: Can we pinpoint a specific molecular explanation for tissue damage following a heart attack? (March 24, 2015).
CRISPR: the legal battles begin
February 1, 2015
CRISPR is an acronym for a recently discovered system that allows bacteria to fight off attacks by pathogens they have previously encountered. (Even scientists working with CRISPR have trouble remembering what the acronym stands for.) It is fascinating: it seems, in some meaningful sense, to be something of an adaptive immune system for bacteria. It has also become a useful tool for molecular biologists: they have figured out how CRISPR works, and have modified it for their own uses, such as editing genes.
CRISPR is an important development, then, of both basic and applied research. It would not be surprising if it became the subject of a Nobel prize. It may also be of major commercial importance. And therefore it will become the subject of legal fights over the "intellectual property". Will become? Make that has become. The legal fight has begun.
The MIT Technology Review, a generally respected source of science journalism, has a recent story on the developments. I encourage you to look it over. Those interested in the business side of biotechnology will find it of interest. Those who care that humankind benefit from the promise of CRISPR will find it of interest. Together, that should make it of interest to most people.
I don't want to get too involved in such issues. They are complex. I don't think it is a matter of whether we should have patents, but of how people use them.
News story: Who Owns the Biggest Biotech Discovery of the Century? -- There's a bitter fight over the patents for CRISPR, a breakthrough new form of DNA editing. (MIT Technology Review, December 4, 2014.)
A post that introduces CRISPR, and notes one early company: Exploiting the bacterial immune system as a tool for genetic engineering: The Caribou approach (May 4, 2013).
More CRISPR... CRISPR: an overview (February 15, 2015). Includes a list of Musings post on CRISPR, which I will try to keep complete.
We have noted another biotech patent case in several posts. This is the story of the patenting of the breast cancer genes. First post, which links to follow-up posts: Can genes be patented? The Myriad case (April 2, 2010).
A post about the broader framework: Commercializing the output of academic research (January 31, 2011).
My page for Biotechnology in the News (BITN) -- Other topics includes a section on Ethical and social issues; the nature of science. It includes a list of related Musings posts.
That Nobel prize hinted at above... Press release: The Nobel Prize in Chemistry 2020. (Nobel, October 7, 2020.)
What can we learn from reading (the DNA from) old parchments?
January 30, 2015
Before the ready availability of paper, parchment was used for writing. Parchment is made from animal skins.
A new article reports analyzing DNA extracted from old parchments, and identifying the type of animal from which the parchments were made.
The following figure summarizes some results from analyzing the DNA from old parchments.
|
The scientists isolated DNA from the parchments, and sequenced small pieces. They then compared individual sequences -- called "reads" -- to known genomes to see what animal they might come from.
The important results are the red and orange parts of the bars. They represent unique hits: sequences that matched only one animal. That is, these pieces are specific for one animal. As you can see, about 20% of the DNA sequences matched only sheep. There are a few for goat, and even fewer for cow. There was almost no evidence for human-specific sequences; this shows that the parchment samples are quite free of contamination from those who have handled the material (and that they were not made from human hides).
|
The blue and purple bars are for sequences that matched multiple animals. In particular, many sequences matched all the ruminants, but not humans. This is an example of how one can do tests with varying degrees of specificity. However, for the current purpose, the unique results are most useful. And those results point to sheep. There is even some discussion of what kind of sheep was used.
The results shown above are for one particular parchment, from the 17th century. Similar results were obtained for an 18th century parchment.
This is Figure 1a from the article. Part b of the figure shows the results for the other parchment; it looks very similar.
|
That's about as far as this work goes. It introduces technical improvements that should make it easier to isolate and identify DNA from old parchments. The article also contains some work on collagen from the parchments; it, too, can be identified as being from sheep.
Parchment is durable; samples from at least the last millennium are common. Parchments were often used for important documents, which have been carefully stored over the ages; these documents are often well dated. Therefore, many old parchments of known age are available, and it is reasonable they can be analyzed. The authors suggest that doing this could be a window onto agricultural practices over many centuries, but any such application to a more specific scientific question remains for future work.
News story: Scientists reveal parchment's hidden stories. (Science Daily, December 7, 2014.)
The article, which is freely available: Paging through history: parchment as a reservoir of ancient DNA for next generation sequencing. (M D Teasdale et al, Philosophical Transactions of the Royal Society B 370:20130379, January 19, 2015.) Part of a feature issue on ancient DNA; sections include: Ancient human populations; Human evolution and ancient diseases; Animal and crop domestication; Ancient genomics; Environmental DNA.
There are no previous posts about parchment, but the following may be related.
* Stanford Linear Accelerator recovers 18th century musical score (June 22, 2013).
* Playing music can make you sick (July 31, 2010).
Other posts about sheep include:
* Lamb-in-a-bag (July 14, 2017).
* The good and bad of the immune system -- a sheep story (January 21, 2011).
* Do robots dream of electric sheep? (April 10, 2009).
There is more about genome analysis on my Biotechnology in the News (BITN) page DNA and the genome. It includes an extensive list of Musings posts on sequencing and genomes.
January 28, 2015
What if Mickey Mouse got measles?
January 27, 2015
If Mickey Mouse got measles, we might expect a cluster of measles cases among visitors to a Disney theme park.
In fact, a cluster of measles cases in visitors to two Disney facilities in southern California has been reported. They appear to point to a source date in late December. Most cases are in people who had not been vaccinated. Secondary cases have been reported; these involve people who were exposed at Disney taking the virus back to their home town and exposing others.
There is a bit of levity here. But this is not a laughing matter. A measles outbreak is serious. Further, outbreaks of various diseases have similarities, as well as differences. It could be interesting to compare the California measles outbreak with the West Africa Ebola outbreak. In both cases, some animal introduced the virus in an event that may be rare but is inevitable. In both cases, the virus spread, both at the original site and via secondary transmission. In both cases, some cultural practices promote virus transmission. To the public health folks, any such outbreak of a disease that can kill or harm many requires attention. It's worth paying some attention to the measles outbreak. It's important in its own right, but it is also a lesson.
News story: California Department of Public Health Confirms 59 Cases of Measles. (California Department of Public Health, January 21, 2015.) A statement a few days ago from the state public health office.
Some additional comments...
The outbreak is still in progress. The report linked above is a snapshot at one point in time; the numbers, and even some of the "facts", change. You can tell from that report that many things are not known for sure; that often includes the source for any particular case. An "outbreak" often gets defined by statistics, not by clear facts for a particular case.
I have heard that one of our local health departments has diverted resources from planning for Ebola so they can devote more effort to working on the measles outbreak. A major concern is the spread of measles among children at schools. Since there currently are no Ebola cases here, this may be quite reasonable -- for the moment.
A day or so before posting this, a local news story announced that anyone who had been to a certain large store on a certain recent date should be aware that a person known to have measles had been in the store at that time, potentially exposing others.
That point leads to an important difference between measles and Ebola. With any infection, it takes some time before an infected person shows symptoms. Are they capable of transmitting the disease if they do not yet show symptoms? For measles, yes. For Ebola, it is likely that the answer is no, though we may not be sure of this yet. On this feature, a measles outbreak is more serious than an Ebola outbreak.
The source, or "index case", for the measles outbreak has not been identified. It is considered likely that it was a visitor to Disneyland who was not vaccinated against measles, and probably is from (or has recently been to) a place where there is measles. (One news story claiming to identify an index case a few days ago was apparently in error.)
The confirmed measles cases include some employees of Disney; their names (or species) have not been made public.
Lest there be any confusion... Measles infects only humans.
* Previous post about measles: Silk: Stabilizing vaccines and drugs (July 29, 2012).
* Next: Fallout from the Ebola outbreak: more measles? (April 28, 2015).
* and... The measles vaccine: What does it protect against? (June 6, 2015).
There is a section of my page Biotechnology in the News (BITN) -- Other topics on Measles. It lists related posts. The page also contains sections on Ebola, and other diseases. Check the listing at the top of that page.
Also see: A flu shot for Santa Claus? (December 5, 2009)
Is it possible that asteroids helped provide the energy needed to get life started on Earth?
January 26, 2015
About four billion years ago, the Earth was subjected to a period of unusually heavy bombardment by solar system bodies such as asteroids and comets. It is plausible that this bombardment, commonly known as the Late Heavy Bombardment, brought us much of our water. It may also have brought some of the chemicals needed to make life. Or perhaps it helped to create the conditions necessary to make those chemicals.
A new article offers some intriguing chemistry that is relevant to that last point. Let's look first at what the scientists did; then, we can enter into the speculation about how it might have been relevant to how life started on Earth.
The following table shows some results. It shows the production of four nucleobases under various experimental conditions. These nucleobases are the four bases commonly found in modern RNA: A, G, C and U. (T, closely related to U, is also a nucleobase.)
|
There are four rows of data. The four experimental conditions are (partially) described in the first column. We'll come back to this in a moment.
The important results are the next four columns, labeled for the four nucleobases. The amounts of these four nucleobases are given as percentages. The final column shows the total amount of material made, as a concentration.
|
Scan the results quickly, and you'll see that the four conditions generally resulted in production of these four bases. The only exceptions are cases where no C appeared. This was due to a special problem: C is relatively unstable under these conditions. The scientists solved the problem by adding "clay", to stabilize the C; see the third row.
And that's the big story. In the experiment of row 3, a single run produced all four of our modern RNA nucleobases -- using a simple starting condition, plus a commonly available soil surface.
This is Table 1 from the article.
|
What did they do? They started by using a simple chemical called formamide. This is listed in the table as HCONH2; its structure is shown below. It is widely believed that formamide was abundant on the early Earth. Further, it has been shown that various treatments of formamide can lead to one or another of the RNA bases. What's new here is showing that, under certain conditions, they could get all four of the RNA bases in a single run. How did they do this? They irradiated the formamide with a powerful laser.
This strengthens the case that formamide might have played a key role in prebiotic chemistry: the chemistry that led to life. Formamide was around; just shine a laser on it, and you'll get all the bases needed for RNA -- in one pot.
That laser? Well, maybe we could find a substitute. The purpose of the laser was to provide energy. An asteroid might do. An asteroid collision with the Earth. And remember, this was a time of unusually heavy bombardment. The authors have done some calculations. They chose their laser to simulate what they estimate to be the energy of a typical asteroid collision of the day. That is, it may have been that an asteroid collision helped promote the origin of life by providing the energy needed to make the nucleobases.
There is nothing in any of this that says what actually happened four billion years ago. What this work does, as so often with origin-of-life research, is to give us an example of what might have happened. In any case, it is interesting chemistry.
What about that last row of results; the DAMN experiment? The scientists spent much time working out the details of how the four bases were made from formamide. In fact, the article contains two large figures of chemical pathways. Their work suggested that a key chemical along the way was one abbreviated DAMN (and shown below). So they tried one run with DAMN, instead of formamide. You can see that it worked well.
At the right are two of the key chemicals that are involved in this work:
The structures are my own drawings using the free chemistry drawing program ChemSketch.
|
|
News stories:
* Asteroid impacts may have formed life's building blocks. (Science, December 8, 2014.)
* How did life get started on Earth? (The Naked Scientists, December 8, 2014.)
The article: High-energy chemistry of formamide: A unified mechanism of nucleobase formation. (M Ferus et al, PNAS 112:657, January 20, 2015.)
Another post on origin-of-life chemistry, also dealing with RNA: The magnesium dilemma: a step toward understanding how RNA might have been made in "protocells" (February 22, 2014).
More about possible early life: Life on Earth 4.1 billion years ago? (November 2, 2015).
A post on the possible role of comets in providing Earth's water: Were comets the source of Earth's water? (February 3, 2012). I should add that this is still an open question.
More on the implications of asteroid collisions: How the birds survived the extinction of the dinosaurs (June 6, 2014).
How did tuberculosis get to the Americas?
January 24, 2015
It had long been thought that tuberculosis (TB) was brought to the Americas by Europeans, perhaps by Christopher Columbus or others of that era. The finding of skeletons in Peru with unmistakable signs of TB and dating back to several hundred years before Columbus re-opened the question.
A recent article offers an answer to how TB may have gotten to those early Peruvians. It opens up some new ideas about how TB spread around the world.
The scientists were able to isolate DNA from some of those early Peruvian skeletons with TB. In fact, they found DNA that was from the bacteria that cause TB-type diseases. More careful examination of the DNA sequence showed that it is most closely related to the DNA of Mycobacterium pinnipedii, the causative agent of TB in pinnipeds -- seals and sea lions.
A simple interpretation of the result is that the early Peruvian TB was due to a TB strain brought to the Americas by seals. We can speculate that seals carried TB across the ocean from Africa to the Americas. That TB might have crossed the oceans via a marine mammal, rather than through human migrations, is a new idea.
Remember that the proposal is a model that is quite well beyond actual data. It raises new questions, which need further testing. Even if that proposal is true, it does not tell the whole story. Modern TB in the Americas is European, not pinnipedian. Somehow, European TB arrived, and replaced the earlier pinnipedian TB. The finding that Peruvians of yesteryear suffered from TB apparently brought by seals adds to our TB story. As so often, the true story is more complex than we thought. We know one more piece, but not the full answer. It's important to try to separate the facts that have been shown from the speculative story we build around those facts. We await further samples of ancient TB DNA.
News stories:
* New research shows seals, sea lions likely spread tuberculosis to humans. (ASU News, August 20, 2014.) Press release from one of the institutions doing the work, Arizona State University.
* Seals May Have Carried Tuberculosis To The New World. (E Yong, Not Exactly Rocket Science (National Geographic blog), August 20, 2014. Now archived.) A lively and lengthy discussion of the implications of this work -- and of its uncertainties.
The article: Pre-Columbian mycobacterial genomes reveal seals as a source of New World human tuberculosis. (K I Bos et al, Nature 514:494, October 23, 2014.)
More about tuberculosis:
* A new vaccine against tuberculosis? (November 9, 2018).
* A new approach for testing a Llullaillaco mummy for lung infection (August 17, 2012).
* Rats, bananas, and tuberculosis (March 11, 2011).
* A bio-ethics controversy: HIV-TB interaction (July 13, 2010).
More about seals: How the price of oil might affect what seals eat for dinner (January 18, 2015).
There is more about genome analysis on my Biotechnology in the News (BITN) page DNA and the genome. It includes an extensive list of Musings posts on sequencing and genomes.
Are bankers fundamentally dishonest?
January 23, 2015
Perhaps not, according to a new article. Perhaps they are dishonest only when they think about being bankers.
It's fascinating that a team of scientists has put the question to an experimental test. What they did was very clever.
Here is the idea... You are asked to flip a coin some number of times. You are told that if you get a certain result you will get some money (say, $20). You flip the coin, and report what you got. You get paid based on the results you report. Would you cheat, so you could get more money? Would bankers cheat? If we wanted to test that, what would be the control? Of course, one control is the statistical expectation, that you should get 50% "heads". But maybe everyone cheats. So let's test bankers versus some other group. Maybe, but there are many differences between such groups; it would be hard to know what the results mean.
That's where the scientists got clever. They tested one group of bankers versus another group of bankers. The difference was that one group of bankers was made conscious of being bankers during the testing, whereas the other group was not. How did they do that? They got together a large number of bankers (bank employees), and divided them into two groups. Both groups filled out a little informational questionnaire before they did the test; that's normal enough. But that questionnaire for one group included questions about what they did as bankers, whereas the questionnaire for the other group did not.
The following figure shows some of the results.
|
In these graphs, the bar height is the frequency of each result, in percentage. The x-axis reflects the coin flip results. It is labeled "Earnings", in dollars; remember, the participants got paid depending on their coin flip results.
|
Each part of the figure has two sets of bars. The blue (or dark) set is labeled "Binomial" (see key at the top); this set of bars is the same in both parts, and represents the calculated expectation based on flipping a fair coin. The reddish bars are the experimental results.
Let's start with the left side, which is for the "control group": the bankers not made conscious of being bankers. The two distributions are very similar.
Now look at the right side, for the bankers made conscious of being bankers; this is labeled the "Professional identity" group. The red distribution is clearly shifted to the right -- towards making more money.
The observations made above are supported by the statistical analysis of the results, detailed in the article.
This is Figure 1 from the article.
|
Summarizing... the results of a controlled experimental test show that bankers will cheat to make money -- if they are conscious of being bankers.
The scientists did such tests with people from other professions. In each case, they tested "controls" versus a group that had been primed to remind them of their professional identity. The cheating was found only for the bankers -- only for the bankers who had been reminded of their professional identity.
What should we make of this? Let's treat it as a scientific article. The researchers asked a well-defined question. They realized there were difficulties in defining the experimental conditions, and they spent considerable effort dealing with this. What they did is clever. It's fun to read how they designed the experiments. On the other hand, a single experiment isn't always right. Maybe they did not fully define the experimental conditions right. Maybe there are hidden variables or biases. One key test, as with any science: Can others reproduce what they did? Can others improve the experiment? I suggest we take this as an interesting scientific step, but let's be cautious about accepting the conclusion, pending further work. That's science.
News stories:
* Business culture in banking industry favors dishonest behavior. (Science Daily, November 19, 2014.)
* Coining it in: banking industry culture promotes dishonesty, research finds -- Academic study testing bankers' reports of coin tosses to gain winnings revealed cheating not found in tests of other sectors. (Guardian, November 19, 2014.) Beware the author's sharp tongue; still, this is a good overview of the work.
* News story accompanying the article: Behavioural economics: Professional identity can increase dishonesty. (M C Villeval, Nature 516:48, December 4, 2014.)
* The article: Business culture and dishonesty in the banking industry. (A Cohn et al, Nature 516:86, December 4, 2014.) Check Google Scholar for an available preprint.
For those willing to dig deeper into the article... There is interesting discussion of the banking culture, and of what we might do about it.
More about banking... Can you feed a man for life by giving him a fish? A story of microfinance (March 23, 2012).
More about cheating:
* Baseball physics (July 31, 2011).
* A plant that cheats (July 6, 2009).
January 21, 2015
Do camels transmit MERS to humans?
January 21, 2015
MERS is Middle East Respiratory Syndrome. It is a coronavirus infection, similar to SARS, that broke out on the Arabian peninsula in 2012. The infection has a fatality rate nearly as high as for Ebola.
How MERS is transmitted is still unclear. There is some transmission from one human to another, but it seems quite limited; it is not enough to explain the continuing outbreak. It may be that bats are the natural reservoir, but it is unlikely that they are the immediate source for human infection. The role of camels is much debated. It's clear that a high percentage of camels get infected with MERS, and that they get sick. Human exposure to camels -- infected camels -- is undoubtedly high, but the role of camels in transmission to humans remains unclear.
We now have a short article that represents the best work yet to establish the role of camels in transmission of MERS to humans.
What the scientists did was to focus on a single herd of about 70 camels in Saudi Arabia. Over the season, most of them became infected with MERS. The scientists checked about 190 people who had varying degrees of exposure to these camels; they measured the level of antibody to MERS in these people.
Measuring antibody is a good way to measure exposure. The people don't have to get sick, they just have to respond to the virus and make antibody. (With some viruses, including flu, a high percentage of those exposed make antibody but show no signs of illness.)
None of the people showed any antibody response to MERS. Thus this set of observations shows no evidence for transmission of the virus from camels to humans. That doesn't mean there is none, but this test sets limits on how much there could be.
As I read the article, I saw limitations of the study. I was then pleased to see that the authors saw those limitations, too. The conclusions section of the article includes a nice discussion of the limitations of the study.
A nice study, and a nice article. There is no evidence for MERS transmission from camels to humans -- as far as we can tell here, realizing that the study may not tell the whole story. In general, this study is consistent with other, less thorough studies.
We're missing something.
News story: Camels' Role in MERS Contagion Questioned -- A study suggests that transmission of the Middle East respiratory syndrome coronavirus from camels to humans is poor. (Jenny Rood, The Scientist, January 15, 2015.) Now archived.
The article, which is freely available: Lack of Middle East Respiratory Syndrome Coronavirus Transmission from Infected Camels. (M G Hemida et al, Emerging Infectious Disease 21:699, April 2015.) Short and mostly very readable. I encourage you to look it over.
A post that raised the camel-MERS connection: Where is the MERS virus coming from? (September 22, 2013).
More... Camels and the transmission of MERS: blame the kids? (March 30, 2015).
There is more about MERS on my page Biotechnology in the News (BITN) -- Other topics in the section SARS, MERS (coronaviruses). It includes links to good sources of information and news, as well as to related Musings posts.
More about camels: Cloning: camel -- update (June 11, 2012).
Jamming of bat sonar, by bats
January 20, 2015
Bats use echolocation, or sonar, to find things, including their food. They emit a sound; if it bounces back, they have found something.
Is it possible that one bat would interfere with the sonar of another bat? A recent article reports an experimental test of this possibility.
|
The figure shows an example. In this experiment, bats were tested to see if they captured an insect, under controlled laboratory conditions. In the experiment, sounds were played in an attempt to interfere with the bats.
The black bars show the percentage of successes by the bats.
(Each black bar is topped by a lighter bar showing the percentage of failures; the two bars add to 100%, of course. Seems to me that including the lighter bars is just making the graph unnecessarily complex. Wouldn't it have been more helpful to the reader to show error bars, so we got a sense of the variability of the results?)
|
The left-hand bar, labeled "none", is the baseline condition, with no sound.
The key result is shown in the right-hand bar, labeled "SinFM". In this case, a sound recorded from other bats is played. That sound was recorded from bats the scientists thought were interfering with bats that were nearing a capture. You can see that this sound reduced the success rate by about three-fold (from about 60% to about 20%).
The other sounds, for the three middle bars, show little effect. Two of these are "miscellaneous" sounds; these did not interfere (much) with the capture success. This shows that the effect seen with "SinFM" (right-hand bar) is specific, not a general effect of sound. Of particular interest is the bar labeled "SinFM early". In this case, they used the same sinFM sound, but played it back before the echolocating bats were in their final phase of attack. It has a small effect, but certainly not the effect shown in the right-hand bar. This shows that the jamming signal must come at the right time.
This is Figure 2 part I from the article.
|
The evidence thus shows that bats can jam the signal of another bat. The jamming signal is sent only when the jamming bat detects a bat very close to homing in on a meal. Does this mean that the jamming bat then gets the meal? That's certainly the implication. Observation of the bats in the field suggests this is correct. However, the scientists have only limited evidence on that point. If the jamming bat doesn't get the meal, what is the "purpose"?
News stories:
* Bats Make Calls to Jam Rivals' Sonar -- First Time Ever Found. (Carrie Arnold, National Geographic, November 6, 2014.) Now archived.
* Hungry bats compete for prey by jamming sonar. (Science Daily, November 6, 2014.)
The article: Bats jamming bats: Food competition through sonar interference. (A J Corcoran & W E Conner, Science 346:745, November 7, 2014.)
Movies. There are four movies posted with the article at the journal web site, as Supplementary Materials. Most useful, perhaps, are movies S2 and S3 (15-20 seconds each, with sound). Both show a bat trying to catch a moth. In one case, the jamming comes at the right time so that the bat misses. In the other, the jamming is too early; the bat catches it prey. You may need to play these more than once to understand them. Read the descriptions on the page of Supplementary Materials.
More about jamming bat sonar: Warfare: the tymbal (September 3, 2009). This is from the same people. In fact, this work was part of the background to the current work. They noticed that bats were emitting signals similar to those of the moths, which they knew were jamming the bats.
A post about attracting bats by making use of their sonar: A plant that communicates with bats (September 7, 2011).
* Most recent post about bats: The tree where the West Africa Ebola outbreak began? (January 12, 2015).
* Next, also about bat sonar: The use of wing clicks in a simple form of echolocation in bats (May 22, 2015).
And more... Why bats fly into windows (December 3, 2017).
How the price of oil might affect what seals eat for dinner
January 18, 2015
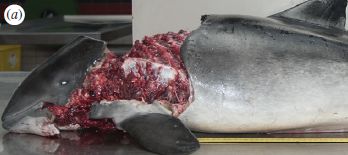
|
Someone has been dining on porpoise.
This is Figure 1a from the article. The full figure shows more specimens, and includes some close-ups of the wounds.
|
That is a harbor porpoise, found on a beach in The Netherlands. Many such mutilated porpoises have been found on the beaches of the southern North Sea in recent years, a surprising development with no clear cause. In some cases, shark warnings have been posted, to alert people on the beaches to the perceived danger.
A new article pinpoints the cause -- or at least one significant cause: the gray seal. That is a surprising finding, as it is well known that seals eat mainly fish, and not mammals.
In an earlier article, from late 2014, the scientists had found evidence of seal DNA in the wounds. Further, there had been observations of seals attacking porpoises. However, more evidence was needed to make a clear case that seals had become a significant porpoise predator.
An important question was whether the seals were attacking live porpoises, or merely scavenging dead ones. Much of the new article analyzes the details of the wounds, from many porpoise carcasses. The conclusion is that they are clearly the result of seal attacks. The porpoises seemed in good condition, with no other reason for death; claw marks suggested seal attack. And now the scientists found seal DNA in deep wounds, protected from the cleansing of the sea; this made clear they had found the guilty party. There are gaps in the analysis, but the scientists suggest that at least 1/6 of the stranded porpoises are from seal attacks. That makes it a major cause, but not the only one. An example of a gap in the study is that there is no way to know how many porpoises are killed, but fall to the sea bottom rather than end up on shore.
The finding that seals are attacking porpoises raises some other questions. One is whether humans on the beaches might be at risk for seal attacks. This would be speculation at this point, but the authors feel it is worthwhile to raise the point as a possible concern. (Seal attacks on humans are rare, except for defense.)
Another question is how this new feeding habit of the seals got started. That's speculation, too. However it got started, the habit seems to have spread. Perhaps it was substantially accidental at first: some bold seal trying a new food, and finding it was good -- and then telling its friends. But another possibility is raised. Most of the rise in porpoise strandings over recent years occurred during a time of steep rises in the price of oil. As a response to the oil prices, fisherman changed their habits, relying more on larger nets -- which also capture porpoises. It is possible that seals were introduced to porpoise as they followed the fishermen's nets. If this was the origin of the new feeding habit, it would provide a link between the price of oil and what seals eat. I emphasize that this is only speculation; it is alluded to in the article, and discussed more explicitly in the news story at Science.
Both the predator and prey of this story are protected species. If one is killing the other, what are the implications for conservation policy? Another dilemma.
News stories:
* Porpoise massacre: seals fingered in whodunnit. (Phys.org, November 26, 2014.)
* Gray seals may be becoming the great white sharks of Dutch beaches. (Science, November 25, 2014.)
The article, which is freely available: Exposing the grey seal as a major predator of harbour porpoises. (M F Leopold et al, Proceedings of the Royal Society B 282:20142429, January 7, 2015.)
Some of the basic background about this work, including the sources of the samples and the DNA testing, are in reference 11, a very recent article (October 2014). It, too, is freely available; you can click through to it from the reference list for the current article.
More about seals: How did tuberculosis get to the Americas? (January 24, 2015).
Another post that turned out not be about real sharks: Shark skin inspires design of a new material to reduce bacterial growth (March 13, 2015).
Other dinner stories include...
* Polystyrene foam for dinner? (October 19, 2015).
* Using a pH meter to help you find dinner (July 8, 2014).
More conservation biology... Re-introducing captive animals into the wild: an orang-utan mix-up (June 27, 2016).
Can we make sense of the many genes involved in autism?
January 16, 2015
Our first understanding of the genetics of human disease came from simple cases. For example, the disease sickle cell anemia is caused by a mutation in one specific gene, that for the beta chain of hemoglobin. There is a clear, direct connection between the genetics and the disease. (We should caution that we still do not completely understand how this "simple" disease works.)
However, such simple relationships are not "the rule". Autism is an example. We know it is a complex disease; we even refer to the range of autism-type diseases as autism spectrum disorder (ASD). And over 300 genes have been implicated as contributing to ASD.
Is there hope of making sense of autism? of the genetic basis for ASD? Perhaps we need to step back and take a novel view of what a human looks like.
The following figure is from a new article analyzing autism. It shows (part of) what a human being looks like -- to a computer scientist. It's a complicated figure, but it does offer some hope.
Each light blue dot represents one human gene (or, perhaps better, its protein).
The blue dots have been arranged into some pattern: clusters of blue dots. Bigger clusters near the top. And some red dots.
One of those clusters has a red box around it, and is labeled #13. Cluster #13. Or Module 13, or "Mod 13". (Another cluster has a box around it, too. It's cut off, but you can see part of its box at the top of the figure. We'll ignore that box here.)
Mod 13 is then blown up, so you can see its detail in the "inset". (The inset is "transparent"; you can see more of the regular blue clusters in the background.)
This is part of Figure 1 from the article.
|
That figure shows our hope of understanding the genetic basis of autism. Let's see if we can make some sense of the figure.
Let's work backwards, starting with the bottom line. Mod 13 is highly enriched for genes associated with autism. Each circle in the inset represents one gene; the gene name is shown. Each colored circle represents a gene that has been associated with ASD. (Ignore the little red dots; they are from the main figure, in the background on the inset.) There is a high percentage of colored circles in the inset. That's not necessarily obvious by looking at this alone, but is the point of the analysis. If you go back to the main figure, you'll see that #13, the boxed cluster, has a higher density of red dots in it than any of the nearby clusters.
So what are those clusters, which are the first step in the analysis? The scientists have grouped the human genes into clusters of interacting genes. Genes are in the same cluster if they interact with each other, as judged by various tests. One such test would be whether the proteins bind to each other, in a simple test in the lab. The lines in the inset show the protein-protein interactions that have been found. Further, they need to be expressed at the same time in the same place in the organism. (If two proteins bind to each other in the lab, but in the real world are not together, then the interaction has no obvious relevance.) Such grouping of genes by their interactions is an active field. It's still rather controversial, because people are still trying to figure out the proper criteria for identifying meaningful interactions. The result, such as the main figure here, is called the interactome, one of the developing plethora of "-omes" in modern biology (starting of course with the genome).
What we have done so far, then, is to group the genes into clusters that are functionally related. One of those clusters is enriched for genes relating to autism. What is the functional role of the genes in Mod 13? They are brain genes, and many are involved in the corpus callosum, the region that joins the two hemispheres of the brain. The clustering helps aim us to what the biology of autism may be. Further, it clues us into to other genes that may turn out to be related to autism.
You may object to some of those conclusions. We already knew that autism involved the brain, and likely involved the corpus callosum. True. In a sense, such findings are a validation, not a new discovery. That's fine. Validating the approach is good; it's still a very new approach. However, showing the genes connected by their interactions does increase our level of understanding. For example, with the information about clustering of known ASD-related genes at hand, the scientists found mutations in other genes of the cluster that also seem associated with ASD.
If you find all this overwhelming or confusing, that's ok. It's the nature of modern biology. We've noted this before with genome work: massive amounts of data, with computers sorting it out and providing some order. But we haven't turned biology over to the computers (or to the computer scientists). Parts of this article explore the biology of groups of genes that are highlighted above. That is, this article includes not only computer-generated figures such as the ones above, but images of brain slices. That is symbolic of the cooperation found -- and needed -- in modern biology between scientists with very diverse types of training.
Overall, this is a complex article that helps identify a group of functionally related genes involved in autism spectrum disorders. That's a useful step towards understanding a complex spectrum of conditions.
News story: Molecular network identified underlying autism spectrum disorders. (Science Daily, December 30, 2014.)
* News story accompanying the article; it is freely available: Autism cornered: network analyses reveal mechanisms of autism spectrum disorders. (C Auffray, Molecular Systems Biology 10:778, December 2014.)
* The article, which is freely available: Integrated systems analysis reveals a molecular network underlying autism spectrum disorders. (J Li et al, Molecular Systems Biology 10:774, December 2014.)
Posts on autism include:
* Genetic analysis suggests there are four different types of autism, with different genetic features (August 26, 2025). Added August 26, 2025.
* Autism in a dish? (September 4, 2015).
* Signs of autism in 2-month-old babies (February 7, 2014).
My page for Biotechnology in the News (BITN) -- Other topics includes a section on Autism. It includes an extensive list of related Musings posts.
A post about a "simple" single-gene disease: Sickle cell disease: a step toward treatment by activation of fetal hemoglobin (October 29, 2011).
There is more about genome analysis on my Biotechnology in the News (BITN) page DNA and the genome. It includes an extensive list of Musings posts on sequencing and genomes.
January 14, 2015
Food poisoning outbreak: Listeria infections from caramel apples and fresh apples
January 14, 2015
We have been experiencing a food poisoning outbreak over recent weeks in the US (and Canada). The affected food is apples. The initial reports associated the outbreak with commercially prepared and packaged caramel apples. Later, contamination of fresh Gala and Granny Smith apples became apparent. The apples are transmitting Listeria bacteria. Listeria causes infections that may be serious, even fatal, for susceptible individuals.
The number of reported US cases is 32, with seven deaths, plus one loss of a fetus. (Two cases that are likely to be related have been reported from Canada. There is a link to a Canadian source on the pages listed below.) As always with events in progress, details are not all clear. For example, not all the deaths may be due to the bacteria.
A recent development is that the source of the contaminated apples has been found. A particular supplier has apples with Listeria. Further, Listeria has been found in their processing facility. In fact, testing of the DNA from the bacteria at that supplier shows a good match with the bacterial strains that have been recovered in the field.
Various companies making caramel apples have already recalled their product. Now, all apples from the identified supplier have been recalled.
Those who might have caramel apples or Gala or Granny Smith apples should check the available information, and decide what to do with the products they have. (Contaminated products should no longer be in the stores -- assuming that the source has been fully identified.) Beyond that, this is an example of an outbreak in progress. Reading about it is good for perspective. Remember that it is typical that the initial information is fragmentary. We know something is wrong, but have little idea of the source. When the source is discovered, considerable product has already been distributed.
Listeria bacteria can grow in the refrigerator. This means that storage of contaminated products in the refrigerator can promote growth of the bacteria. This is a somewhat unusual feature for a human pathogen; it is noted on the FDA page listed below.
News stories. The following links are to US government pages from agencies dealing with the outbreak. These are pages intended for the general public.
* Multistate Outbreak of Listeriosis Linked to Commercially Produced, Prepackaged Caramel Apples. (CDC, January 10, 2015. Now archived.) This page is updated as new information becomes available. "Previous Updates" are included at the bottom; click on the date and you will get the update for that date. CDC announcements dating back to December 19 are available. (With the archived site, navigation of the versions may not work. You can find some of them by putting the original URL into the Wayback machine search.)
* FDA Investigates Listeria monocytogenes Illnesses Linked to Caramel Apples. (FDA, January 10, 2015. Now archived.) Question-and-answer format about the outbreak.
A recent post on food poisoning: The cost of food poisoning (October 14, 2014). Listeria is noted as one of the major causes.
More... Is the lychee (litchi) a toxic food? (May 11, 2015).
Another Listeria outbreak: Disease outbreak from pasteurized milk (March 5, 2019).
Most posts about food poisoning issues are listed with the post
Killer chickens (December 2, 2009).
A post about the man after whom the bacteria are named: On a new method of treating compound fracture... (July 11, 2012).
More about apples... Can chimpanzees learn a foreign language? (March 10, 2015).
A bit of IPD -- found in Antarctica
January 13, 2015
Briefly noted...
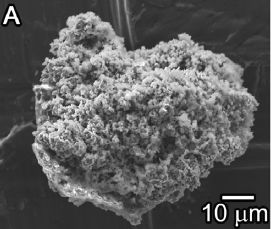
|
That's it.
Electron microscope image.
This is Figure 1a from the article.
|
Why the excitement? IPD means interplanetary dust. In fact, it's thought to be from comets. It may represent the material from which the solar system formed. Scientists expend considerable effort to get such stuff.
A new article reports that interplanetary dust may be in our backyard, on the ground -- at least in the pristine environment of Antarctica. Samples were collected both from surface snow and sub-surface ice, presumably reflecting recent and past falls of these "micrometeorites".
The new article focuses on showing that the newly found particles from Antarctica are very similar to those collected from the stratosphere. The authors also address some of the concerns about collecting ancient solar system material off the "ground". Comparison will continue, but the main message is that the Antarctic material may increase the amount of this primordial material available for study by a hundred fold or more.
News story: Comet dust found in Antarctica. (Science, December 5, 2014.)
The article: Cometary dust in Antarctic ice and snow: Past and present chondritic porous micrometeorites preserved on the Earth's surface. (T Noguchi et al, Earth and Planetary Science Letters 410:1, January 15, 2015.)
A recent post about the Antarctic: What if your compass pointed south? (October 24, 2014).
More... What do microbes eat when there is nothing to eat in Antarctica? (April 2, 2018).
A recent post about comets: Twins? A ducky? Spacecraft may soon be able to tell (August 4, 2014).
The tree where the West Africa Ebola outbreak began?
January 12, 2015
Ebola outbreaks are thought to start with the transmission of the virus from a non-human animal in the environment to a human. The virus then spreads within the human population, until the outbreak dies out. Many animals could potentially be the immediate source for transmission to humans. These include animals such as primates, which get sick from the virus, and animals such as bats, which do not. In fact, the animals that do not get sick from it are likely to be the major reservoir for the virus. It is quite possible that bats transmit the virus to other animals, which then transmit it to humans.
A new article explores how the current West Africa Ebola outbreak may have started. The work builds on the current view that a two-year-old child in the village of Meliandou, Guinea, was the first case, in December 2013. The article does not reach a clear conclusion, but it does make some scenarios more likely and others less likely.
In fact, the authors do offer one specific suggestion as to what happened. The following figure shows where they think the current outbreak might have begun.

|
A tree about 50 meters from the home of the first victim in the Ebola outbreak.
Children, including that victim, played in the tree. Activities included collecting -- and eating -- the bats that lived inside the hollow.
Between the times of the outbreak and of this study, the tree burned. A massive exodus of bats was seen during the fire.
This is Figure 3C from the article.
|
It's a plausible story: that tree might have been where the Ebola outbreak began. A child, playing with the bats that lived in the tree hollow could have become infected there. The child became sick, and then spread the virus to family members.
It's plausible, but we should emphasize that there is no direct evidence to support this particular origin for the outbreak. In particular, testing of the bats the scientists collected from the area did not turn up any sign of the Ebola virus in the bats. That doesn't disprove that the child may have encountered some infected bats there four months earlier, but it does not support it either.
The article contains other findings of the scientific team. For example, they looked at the populations of various carnivores and primates. None of these populations seemed to decline over the relevant time period. That is, there is no evidence for any outbreak within these animals, which are susceptible to the virus. Further, the outbreak mainly affected women and children at first. These findings suggest that the outbreak did not begin with eating "bushmeat".
Even the type of bat may be interesting. It has been known that fruit bats can carry Ebola. These are commonly hunted and eaten. However, the bats in the tree were insectivorous bats. These bats were not commonly hunted -- except by the children. Implicating these bats is not completely new, but they have received less attention than the fruit bats.
The article is by a large group of scientists of various backgrounds, investigating various aspects of the outbreak. Their findings make some things more likely, some less likely. The story of the tree gives us a tangible model of how simple it might be to start an outbreak. The article is quite readable and interesting. I encourage you to look it over. Emphasize the big picture: the approaches they took and the range of findings. The tree is a good story, but the article is about how such an outbreak can be analyzed.
News stories:
* Bats are a possible source of the Ebola epidemic in West Africa. Science Daily (EMBO), December 30, 2014.)
* Investigations yield insights into Ebola outbreak's early months. (CIDRAP, December 30, 2014.) Discusses the current article, and more about the time course of the Ebola outbreak, including apparent missteps by the authorities.
The article, which is freely available: Investigating the zoonotic origin of the West African Ebola epidemic. (A M Saéz et al, EMBO Molecular Medicine 7:17, January 1, 2015.)
* Previous post about Ebola:
Ebola in the United States: the "suspicion" factor (December 15, 2014).
* Next: Fallout from the Ebola outbreak: more measles? (April 28, 2015).
There is more about Ebola on my page Biotechnology in the News (BITN) -- Other topics in the section Ebola and Marburg. That section links to related Musings posts, and to good sources of information and news.
More about bats carrying viruses: Bats and the origin of SARS (January 25, 2014).
More about bats:
* What do bats argue about? (April 21, 2017).
* Jamming of bat sonar, by bats (January 20, 2015).
The real carbonic acid, at last?
January 10, 2015
Carbonic acid is H2CO3. It's made from CO2 + H2O. Carbonic acid is a weak acid; the first ionization step leads to the bicarbonate ion, HCO3-.
That's all fine, except for one thing. Carbonic acid is an elusive chemical. Until recently, it had not been considered to be a stable molecule, one that could be isolated. And recent claims of showing pure carbonic acid have run into a problem: two claims for the crystal structure of carbonic acid disagreed with each other. Without any explanation, that meant that both claims were suspect.
A new article seems to have solved that problem. The article shows which structure of carbonic acid is correct, and shows what went wrong in the other work.
The following figure shows the problem -- and the solution. We will walk though parts of it.
|
All the data here are infrared (IR) spectra of gases. And we will interpret them simply by comparison; we don't need to know what the peaks mean. In fact, you can get the idea by looking mainly at the big peaks in the middle, around 1775-1800 on the x-axis scale.
Start with part b, the middle frame. There are two curves. These are the two IR spectra that had been reported for carbonic acid, by two different labs. You can see that they are different.
(The spectra are for the gas phase -- the gas that goes with each of the two reported carbonic acid crystal structures. The two forms are called alpha and beta, for no particular reason other than that there were two structures. Confusingly, the alpha form is shown as curve b, etc. But it doesn't matter much for us here.)
That's the problem.
|
In the new work, the scientists made two compounds, using a new method. The IR spectrum of one is shown at the top (part a). The IR spectrum of the other is shown at the bottom (part c).
You can see that the new spectrum in part a agrees with one curve in part b (the black one; beta form). The new spectrum in part c agrees with the other one in part b (the red one; alpha form). (Again, I suggest you focus on the big peaks in the middle.)
The compound in part a is carbonic acid; the structure of carbonic acid is shown there. The compound in part c is carbonic acid monomethyl ester (or "methyl carbonate", carbonic acid with a methyl group attached); the structure of methyl carbonate is shown there. (Why are there two structures shown in each case? We'll come to that in a moment, but they are both the same compound in each case.)
Further, the authors of the new work explain that the method used previously to make one of the claimed carbonic acids was actually likely to make methyl carbonate.
This is Figure 3 from the article. I have added text labels in frame b about what the two curves are for.
|
Summarizing... Previous work had reported two spectra for carbonic acid. In the new work, compounds were made that corresponded to each of those. One was and one was not bona fide carbonic acid. Further, there is a plausible explanation of why one of the earlier reports was wrong. Thus we now have a valid procedure for making carbonic acid.
There is another, more advanced, point to be made from the new spectra. How are the parts of the carbonic acid molecule oriented? The two -OH could point toward or away from the =O. Toward is called "cis" and away from is called "trans". The IR spectra can be interpreted in terms of these orientations (or "conformations"). It turns out, for carbonic acid, that two of the three possible forms are seen in the spectra. One is "ct", with one -OH cis and one trans; this is the left-hand structure. (The structure is labeled 1ct; the 1 refers to the specific chemical. That is, this is the cis-trans form of chemical 1.) The other is "cc", with both -OH cis; this is the right-hand structure. The "tt" form was not seen. Interestingly, their theoretical calculations indicated that the tt form was the least likely, with the cc and ct forms about equally likely. Thus, their results for the conformation of carbonic acid agree with predictions.
News story: Carbonic Acid -- And Yet It Exists! (Chemistry Views, September 23, 2014.)
The article: Gas-Phase Preparation of Carbonic Acid and Its Monomethyl Ester. (H P Reisenauer et al, Angewandte Chemie International Edition 53:11766, October 27, 2014.)
Here is an example of a post that mentions carbonic acid -- almost as if it were real: Increased CO2: effect on animals that make carbonate skeletons (January 11, 2010).
More about IR spectra:
* Evidence for dinosaur protein extended by a hundred million years (May 12, 2017).
* A water fountain for Saturn (October 23, 2011).
January 7, 2015
Can people learn to be synesthetic?
January 7, 2015
Synesthesia is a condition in which people have a cross-connection between the senses. For example, a person with synesthesia might associate particular colors with letters or numbers. Many such cross-connections are known.
It is estimated that a few percent of people have synesthetic traits. Why is not known. Both genetic and developmental reasons have been suggested, but nothing has been shown with any certainty. Further, it's not at all clear whether synesthesia is, in any way, good or bad.
In a new article, a team of scientists has taught adults to have a synesthetic skill.
The following figure shows some results.
|
We'll look at the nature of the test in a moment, but for now let's just look at the numbers. The y-axis shows a score; the lower, the "better" -- the more synesthetic.
There are two groups of people, untrained (darker bars) and trained (lighter bars). They are tested pre- and post-training.
The bars on the left are for the two groups before the training; the two groups are about the same. That's the baseline.
|
One of those groups undergoes training, and the test is repeated. The new, post-training, results are shown by the right-hand pair of bars. You can see that the two groups now differ. The untrained group has about the same score as before; the trained group has a much lower (better) score. In fact, the trained group has a score in the range commonly accepted as synesthetic, below the dashed line.
This is Figure 2 from the article.
|
What is the test? The participants are shown a symbol (letters and numbers), and asked to associate a color, from a palette, with the symbol. The score is based on consistency of color assignment in multiple trials for the same symbol. A low score means that the individual is consistent in assigning colors to symbols. (Why is that a low score? Because it means the distance on the palette between the choices for the same symbol is small.) The synesthesia community has experience with this test, and considers scores below 135 (dashed line in the figure above) as demonstrating synesthesia. Thus it appears that the trained group progressed from being non-synesthetic to being synesthetic, as the result of the training. (Other tests were also used, and showed successful training.)
What was the training that resulted in this learned synesthesia? It was what you would expect: lessons that reinforced certain associations.
The relationship of what was shown here to "natural" synesthesia is not clear. It is easy to question the significance of the kind of training that was done. However, whatever happened, it resulted in the trainees "passing" a test normally used for synesthesia. The training is a controllable lab procedure; that means that the phenomenon can be controlled by the investigators. They can control how the training is done, and they can then look for changes in the trainees. The article would seem to open up a new approach to studying synesthesia, but its significance is unclear at this point.
News stories:
* Training can lead to synesthetic experiences: Does learning the 'color of' specific letters boost IQ? (Science Daily, November 18, 2014.)
* Synesthesia Taught To Adults With Colored Letters And Memory Tests (Medical Daily, November 18, 2014.)
The article, which is freely available: Adults Can Be Trained to Acquire Synesthetic Experiences. (D Bor et al, Scientific Reports 4:7089, November 18, 2014.)
There is more information about the testing in the article, and a link to where the test is available online.
More about synesthesia:
* Can you see your hand in total darkness? (April 14, 2014).
* Synesthesia: the good side? (January 14, 2012).
* What does blue light smell like? (July 18, 2010).
Fugu poisoning incident in the United States
January 5, 2015
Fugu (puffer fish, or globefish) is a culinary delicacy in some parts of the world.
Fugu is highly poisonous, due to the presence of a potent neurotoxin called tetrodotoxin.
The conflict between those two statements might be considered amusing were it not so serious. Asian chefs develop expertise in how to prepare various fugu species, each of which has a characteristic distribution of the toxin among the organs. The United States places severe restrictions on the import of fugu.
We now have a case report of a recent fugu poisoning incident in the US. It's described clearly and concisely in a current MMWR article. Some of the facts are clear, some are not. Four people ate from a sample of dried fish purchased from a street vendor in New York City -- and within a half hour developed symptoms of tetrodotoxin poisoning. Fortunately, all recovered, so far as we know. We know what they ate, because those who sought medical attention brought in the fish. Analysis of the fish samples showed that they were of a particular fugu species that is never considered edible, and that the samples contained high levels of the toxin.
The scientists were unable to track the source of the fish. Since this species is never considered edible, there was no legal route for its import.
What is the take home lesson from this incident? The article is short and generally readable, with the usual MMWR summary of the key points. Read it and think about it.
How dangerous were the fish? The information in the article says that the fish with the highest level of toxin had about 70 ppm (parts per million) of toxin. That is 70 mg toxin per kg (dried) fish. The article also says that as little as 2 mg of the toxin could be lethal to an adult. For the fish with 70 ppm of toxin, that would be about 30 grams (1 ounce).
The article, which is freely available: Tetrodotoxin Poisoning Outbreak from Imported Dried Puffer Fish -- Minneapolis, Minnesota, 2014. (J B Cole et al, Morbidity and Mortality Weekly Report (MMWR) 63:1222, January 2, 2015.)
A recent post on food poisoning: The cost of food poisoning (October 14, 2014). Note that most of what is discussed there is due to some pathogen (e.g., virus or bacteria) infecting the food. The current post is about a food that is inherently poisonous. The poison is made by the food animal.
More... Is the lychee (litchi) a toxic food? (May 11, 2015).
Musings posts on a range of food safety issues are listed in the post Killer chickens (December 2, 2009).
How does worm "fur" divide?
January 4, 2015
About the way you might expect -- once you figure out what it is. So says a new article.
Here is one of the worms:
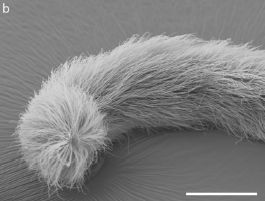
|
One end of a soil nematode worm, Eubostrichus dianeae. Scanning electron microscope image.
The "fur" is apparent.
The scale bar is 100 µm, or 0.1 mm.
This is Figure 1b from the Supplementary Information with the article.
|
What is that stuff? It turns out that each "hair" is one bacterium. Each bacterial cell has one end attached to the worm surface.
As bacteria go, these are quite long. You can see that the length of the bacteria approaches that of the scale bar, which is 0.1 millimeter. That's about long enough to see by eye (though the width, a more normal micrometer or so, would preclude the bacteria from actually being visible). In fact, they are the longest rod-shaped bacteria ever observed.
Name? The bacteria don't have a proper name yet. For now, they are called the Eubostrichus dianeae symbiont, or Eds.
One question the scientists asked is how these long bacteria divide. The common way rod-shaped bacteria, such as Escherichia coli, divide is to constrict in the middle, with one daughter genome on each side. The central constriction is mediated by a protein called FtsZ.
Let's look at what these worm "fur" bacteria do. The following figure shows a single cell of Eds, with three views.
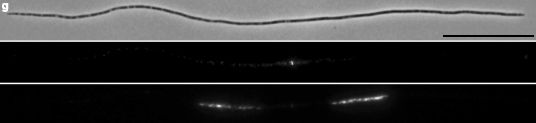
|
The scale bar (right end of top frame) is 20 µm.
The top view is simply what the cell looks like under the microscope.
The middle view shows what happens if the scientists stain the cell for the protein FtsZ. (They use an antibody that had been prepared against FtsZ from E. coli.)
The bottom view shows what happens if they stain the cell for DNA.
This is part of Figure 5g from the article.
|
Put those three results together, and we have a verrrrrry long cell, with some FtsZ quite well localized in the middle -- between two regions of DNA.
The conclusion? These extremely long rod-shaped bacteria seem to divide just like common rod-shaped bacteria. FtsZ accumulates at the midpoint, and there is a genome nearby on each side. It's not just this one cell; they measured the location of FtsZ in many cells, and found that it localized in the middle in longer cells.
A couple things you may wonder about...
1) How does FtsZ know where the middle of the cell is? That's not known, but the authors discuss some of what is known from other bacteria. They suggest that a system involving an inhibitor of FtsZ ring formation may function in these bacteria; the inhibitor is least active at the cell midpoint. It is remarkable that this system is effective over these long distances. Further work is needed to test their suggestion.
2) What are these bacteria doing on the worm? That's not known either, but it seems likely that this is a symbiotic relationship, benefiting both worm and bacteria. It may be that the bacteria are digesting food that the worms cannot, and are thus helping feed the worms. There is precedent for such relationships, but this one remains to be studied.
We should add that cell division in these bacteria has not been directly observed; the conclusions are inferred from the type of observations discussed here.
The significance of the multiple spots for DNA is unknown. It may be that these large bacteria have more than one copy of the genome per cell.
The article actually discusses two kinds of worms and their bacterial ecto-symbionts. For the other worm, the bacteria are attached to the worm surface at both ends. Go look! Those bacteria, too, divide in the middle.
News story: Think big! Bacteria breach cell division size limit. (Science Daily, September 15, 2014.) Most of this news story, including the pictures, is about that other kind of bacteria mentioned above.
The article, which is freely available: Size-independent symmetric division in extraordinarily long cells. (N Pende et al, Nature Communications 5:4803, September 15, 2014.)
Other posts about bacterial symbionts include:
* A quasi-quiz: The fate of bone and wood on the Antarctic seafloor -- and the discovery of new bone-eating worms (August 20, 2013). This post deals with an extreme case of a worm-bacterium symbiosis, where the worm has no digestive system of its own at all.
* The hydrogen economy -- in the mid-Atlantic (August 30, 2011).
* A new organelle "in progress"? (September 13, 2010).
More worms...
* Worm count (August 27, 2019).
* How to avoid cannibalism (May 25, 2019).
There is more about large bacteria on my page Unusual microbes in the section Big bacteria.
Discovery of a chemical of biological origin from Mars?
January 2, 2015
In 2011 a piece of Mars landed in Morocco. A new article reports analysis of this meteorite, which is named Tissint; the authors suggest that it contains evidence of biological activity. What's the story?
There are several issues here. The rock is a meteorite. It is from Mars. It is not contaminated with material from Earth. The composition suggests that it may be of biological origin. To make their case, the scientists must establish each of those points. If we do accept those points, we still need to ask: what are possible alternative interpretations?
That the rock is a meteorite is clear: people saw it fall. That it is fairly clean is probably not in dispute, especially for the internal parts analyzed in this study. It is probably from Mars, as explained below; if that part is wrong, and it is biological, it would be even more interesting.
Let's look at some of the evidence.
Key parts of the story depend on analyses of isotopes in the material. As we have noted in other posts, different parts of the solar system have different isotopic composition. In this case, there are two key findings:
1) The ratio of isotopes of hydrogen found in the rock is typical of Mars, not Earth. This supports the identification of the rock as being from Mars.
2) The ratio of isotopes of carbon found in the rock is distinct from that in the Martian atmosphere. This is the point that leads to the suggestion that the material has a biological origin. Why? Because that is what we find on Earth, where the heavier isotope C-13 is discriminated against during photosynthesis. That is, the carbon in this Martian rock bears the same relationship to Martian atmospheric carbon as Earthly coal does to Earthly atmospheric carbon. Earthly coal is of biological origin, thus the scientists suggest that the Martian rock is also of biological origin.
It's important to keep perspective on this article. The scientists report data. And they offer their interpretation of the data. Their preferred interpretation is that the rock shows evidence of biological activity on Mars. It's good to see what the argument for that is. Importantly, there is no direct evidence for biological activity. That the rock may have a biological contribution is inferred from some of its features, by comparison with things we know from Earth. It's all logical, but not conclusive. The authors make clear that other interpretations are possible, even if all their data are correct. Overall, the article represents a fascinating piece of science; we just don't know what it means.
From the abstract: "The C isotopic compositions of the organic matter (...) are significantly lighter than Martian atmospheric CO2 and carbonate, providing a tantalizing hint for a possible biotic process. Alternatively, the organic matter could be derived from carbonaceous chondrites, as insoluble organic matter from the latter has similar chemical and isotopic compositions."
News stories:
* Martian meteorite may contain evidence of extraterrestrial life. (CNET, December 2, 2014.)
* Traces of possible Martian biological activity inside a meteorite. (École Polytechnique Fédérale de Lausanne, December 2, 2014.) From one of the institutions doing the work.
The article: NanoSIMS analysis of organic carbon from the Tissint Martian meteorite: Evidence for the past existence of subsurface organic-bearing fluids on Mars. (Y Lin et al, Meteoritics & Planetary Science 49:2201, December 2014.)
More about measuring differences in isotope composition:
* Life on Earth 4.1 billion years ago? (November 2, 2015).
* A new, simple way to measure bone loss? (September 14, 2012). This post is about isotope fractionation in biological systems:
* The Moon: might it be a child with only one parent? (April 13, 2012). This post makes the point that different bodies in the Solar System have different isotopic compositions.
Other posts about Mars include...
* Could Deinococcus radiodurans survive on Mars? (November 6, 2022).
* Perchlorate on Mars surface, irradiated by UV, is toxic (July 21, 2017).
* What causes gullies on Mars? (September 8, 2014).
A recent post about meteorites: Formation of the Moon: the California connection (October 10, 2014).
My page of Introductory Chemistry Internet resources includes a section on Nuclei; Isotopes; Atomic weights. It includes a list of related Musings posts.
Top of page
The main page for current items is Musings.
The first archive page is Musings Archive.
E-mail announcements -- information and sign-up: e-mail announcements. The list is being used only occasionally.
Contact information
Site home page
Last update: April 14, 2026